You Have Been Warned: These 6 Banks Might Suffer From Downgrade Review
The charts for a handful of regional banks recently tabbed for downgrade scrutiny suggest stock price hits on the horizon.
You've reached your free article limit
You've read 0 of 1 free Pro articles.
The credit rating agency Moody’s MCO put several U.S. regional banks on downgrade review over commercial real-estate concerns on Friday. Let's check out the charts of the six banks under review and the SPDR S&P Regional Banking ETF KRE.
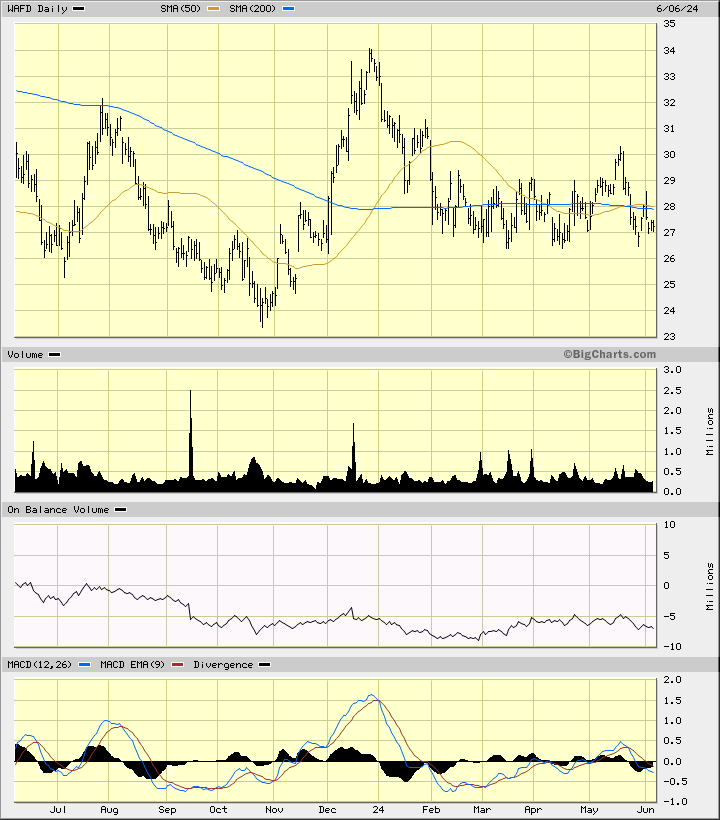
In this first chart, let's check WaFd, Inc WAFD. WaFd the nickname and an abbreviation of Washington Federal.
In this daily bar chart of WAFD below, I can see that prices rallied in November and December and then has settled down in a choppy sideways trading range for the past four months. Prices show weakness in May with prices trading below the 50-day and 200-day moving average lines. The On-Balance-Volume (OBV) line has rolled over in April and May and tells me that traders are now being more aggressive sellers instead of aggressive buyers. The trend-following Moving Average Convergence Divergence (MACD) oscillator has fallen below the zero line for an outright sell signal.
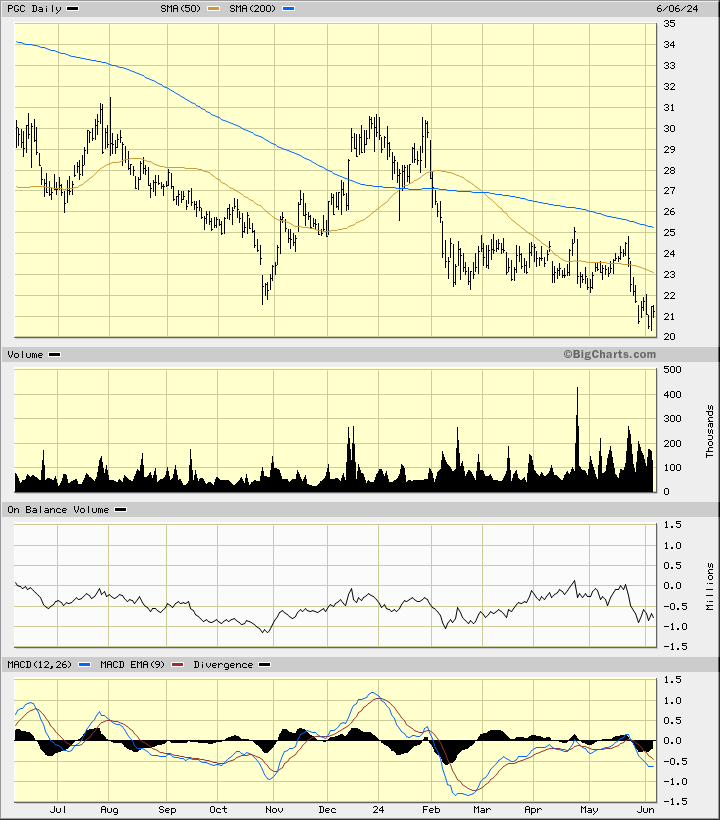
The next bank on Moody's list is the Peapack-Gladstone Financial Corp. PGC. As a former resident of New Jersey, I know right where this institution is located. Let's check out a chart and the indicators.
In this daily bar chart of PGC below, I can see that prices have been in a downtrend for the past 12 months. PGC trades below the declining 50-day moving average line and below the negatively sloped 200-day moving average line. The trading volume has increased the past five weeks suggesting that some traders and investors are voting with their feet and selling. The OBV line has turned lower in the past five weeks. The MACD oscillator is in a bearish alignment below the zero line.
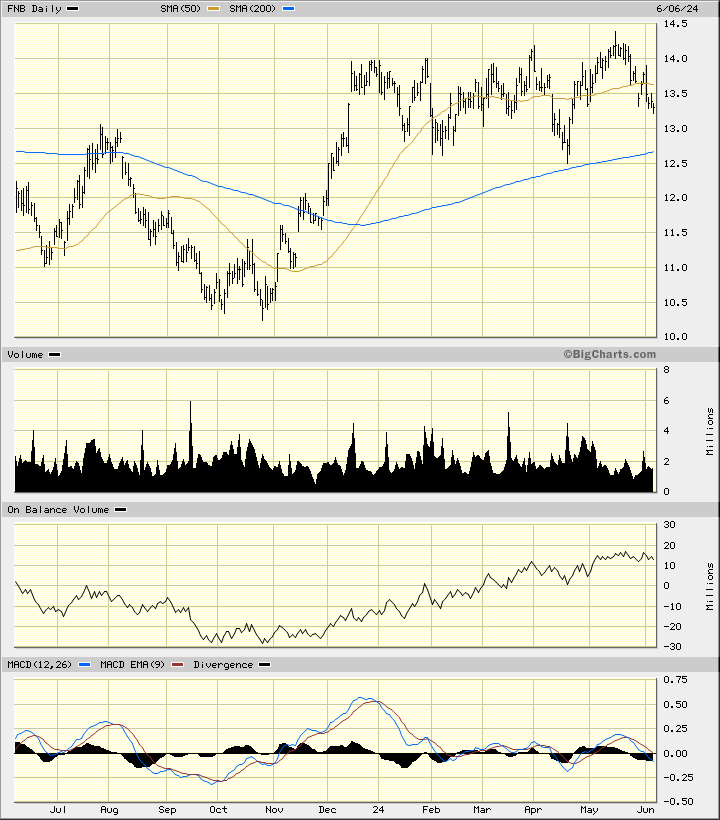
In this third example we look at F.N.B. Corp.(FNB), which is headquartered in Pittsburgh, Pennsylvania, and is a diversified financial services company operating in seven states and the District of Columbia.
In this daily bar chart of FNB below, I can see that prices took a similar path as seen on the chart of WAFD above. Prices rallied in November and December and then chopped sideways for the next five months. FNB trades below the 50-day moving average line. The 200-day moving average line has a positive slope and could be tested in the days ahead. The OBV line shows an advance since October but the line turned neutral in May. The MACD oscillator has fallen below the zero line for an outright sell signal.
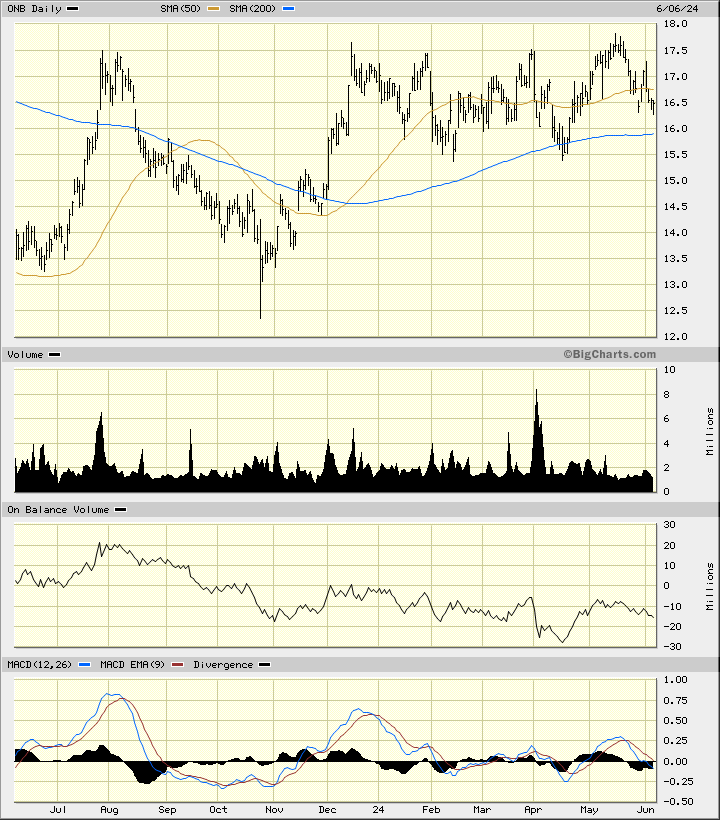
Up next is Old National Bancorp ONB. ONB is the 44th-largest commercial bank in the U.S. with $47 billion in assets.
In this daily bar chart of ONB below, I can see the same choppy price action over the past five months. Prices trade below the 50-day moving average line and are not far from a test or perhaps a break of the 200-day line. The daily OBV line shows weakness since August and that is a long time for some quiet liquidation (selling). The MACD oscillator has been weakening the past year and is now below the zero line.
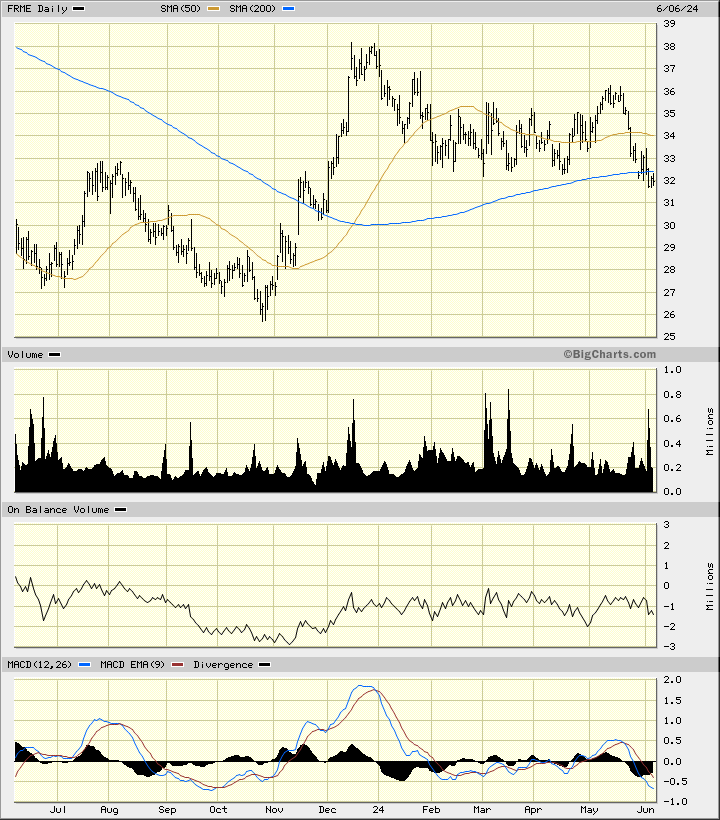
In this next chart, we look at First Merchants Corp. (FRME). In this chart, I can see that prices are weaker than the charts above. FRME is already trading below the 200-day moving average line. The movement of the OBV line matches the choppy price action. The MACD oscillator is bearish.
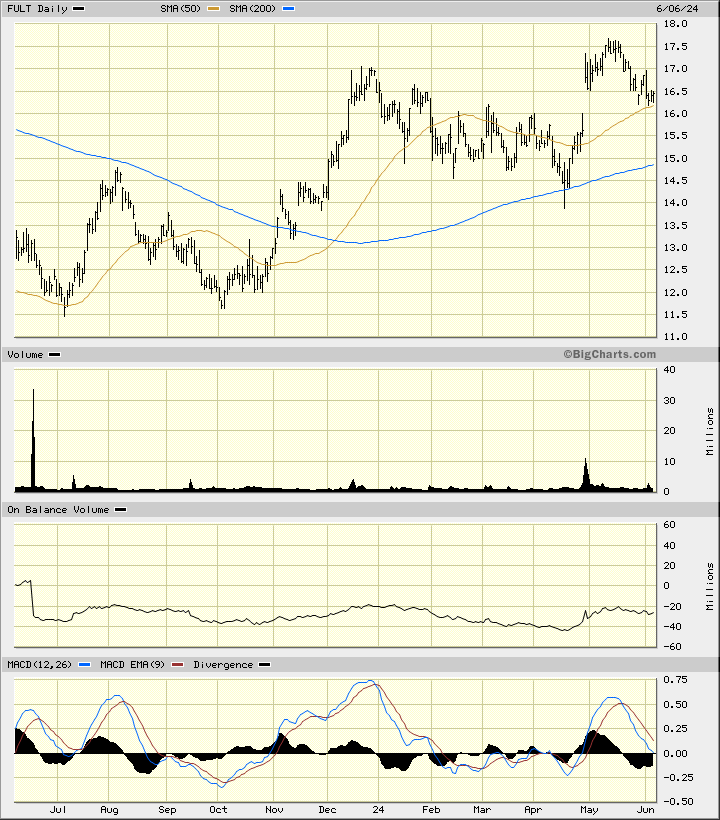
Number-six is Fulton Financial Corp. (FULT). Fulton is a U.S. regional financial services holding company, headquartered in Lancaster, Pennsylvania.
The chart of FULT is in a little better shape than the others we have looked at. FULT is still trading above the 50-day moving average line. The 200-day line has a positive slope. The trading volume is not active. The OBV line generally moves up and down with the price action. The MACD oscillator is bearish.
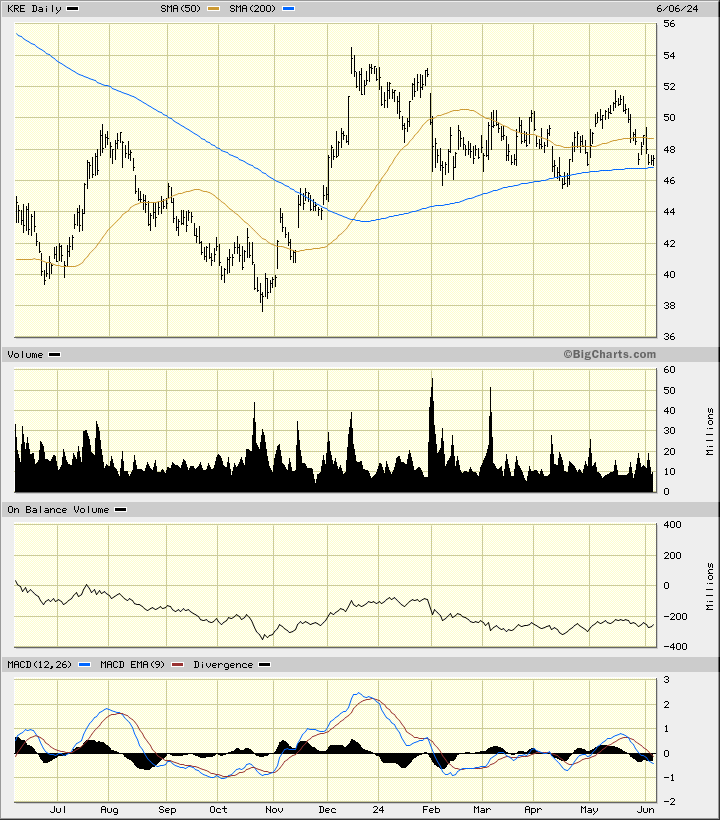
Let's check out the KRE, the SPDR S&P Regional Banking ETF. With the KRE below, prices have weakened since December. Turnover is fairly active and suggests that we may be seeing some hedging being conducted (e.g., shorting the KRE as a hedge against individual holdings). The KRE is testing the 200-day moving average line. A close below the 200-day line could happen as soon as today. The OBV line has been weak since January. The MACD oscillator is moving below the zero line for a sell signal.
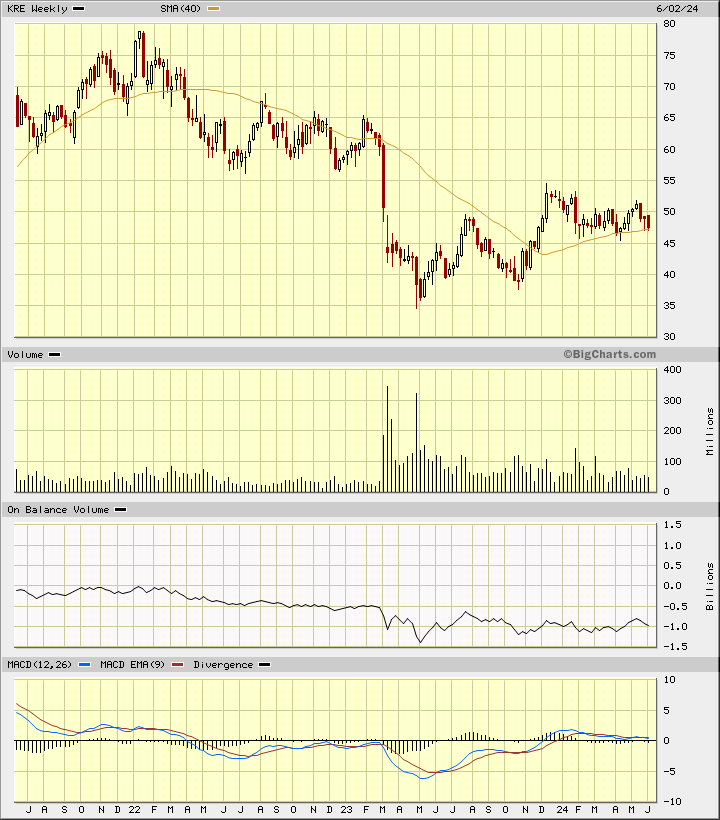
In this weekly Japanese candlestick chart of the KRE below, I can see a bearish setup. Prices are poised to close below the 40-week moving average line. The weekly OBV line is struggling and the MACD oscillator is edging lower.
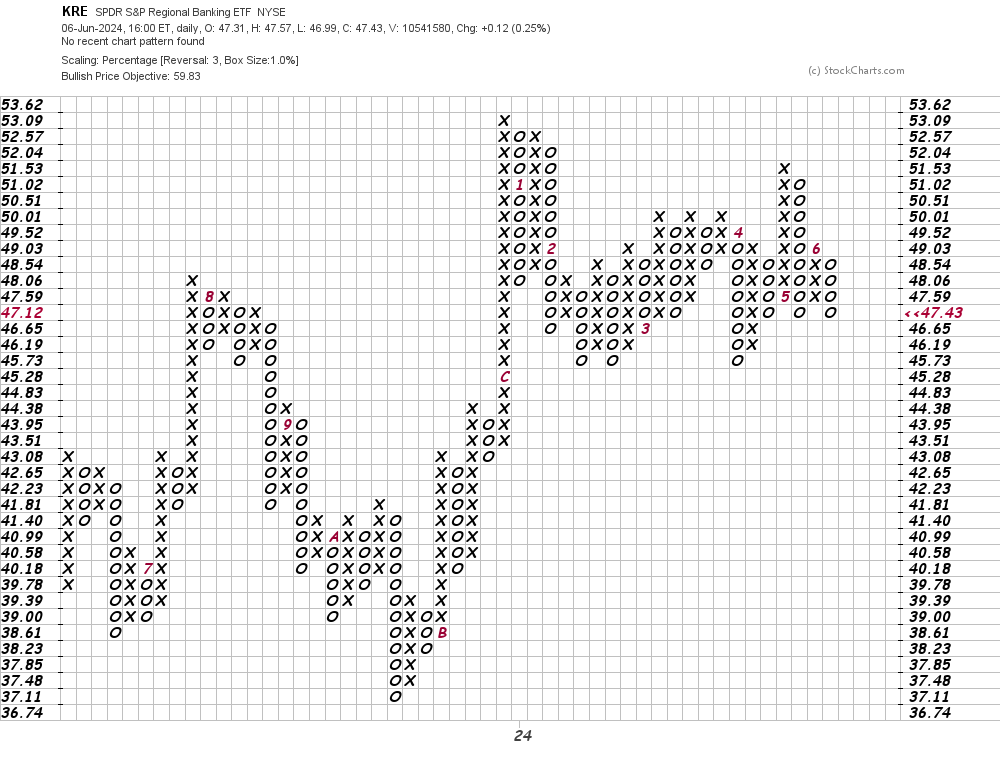
In this daily Point and Figure chart of KRE below, I can see an upside price target in the $59 area. A trade at $45.28 could turn this chart bearish.
Bottom line strategy: Moody's has identified the six banks above for potential downgrades over commercial real-estate concerns. The charts suggest we could see the stock prices weaken. You have been warned.
Employees of TheStreet are prohibited from trading individual securities