Patience Is Required to Know Whether UPS Will Deliver
Here's a technical plan for United Parcel Service as it misses on earnings.
You've reached your free article limit
You've read 0 of 1 free Pro articles.
United Parcel Service UPS reported a adjusted earnings per share of $1.79 Tuesday morning, which missed by $0.20 and revenue of $21.8 billion, which missed by $440 million. Share prices are sharply lower in the premarket so let's not waste any time checking out the charts and indicators.
Customers are waiting.
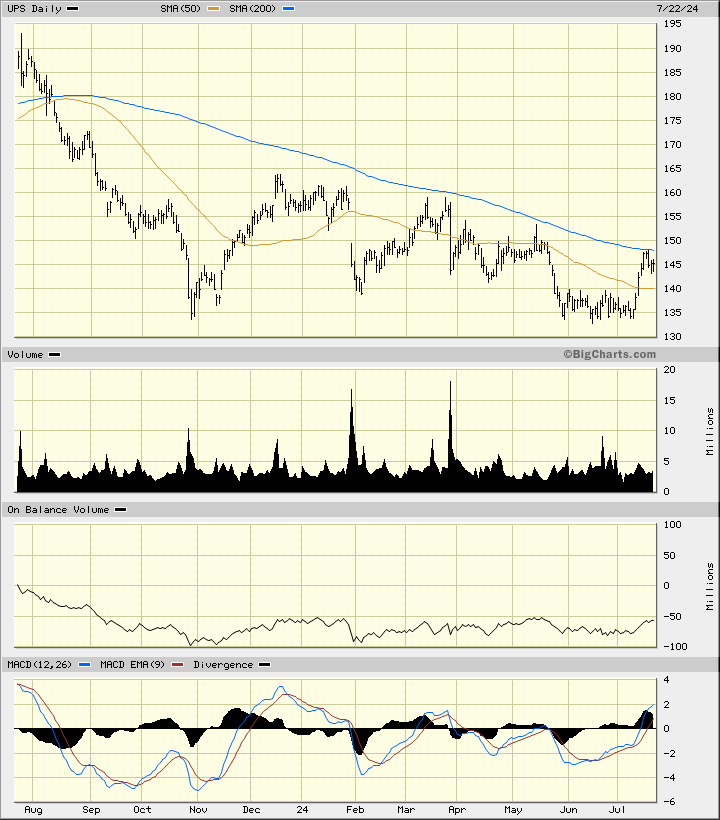
In this daily bar chart of UPS, below, I can see that prices have been in a downtrend the past 12 months. Prices have made lower-highs and lower-lows into June and July. Tuesday's price weakness needs to be watched closely to see if new lows are made or not. If UPS does not clearly make a new low for the long move down, it can mean that the news has already been discounted and this is what chart watchers take notice of as a sign of a bottom.
Prices are trading below the declining 200-day moving average line. UPS is likely to test/break the 50-day line today. The On-Balance-Volume (OBV) made a low back in November, but its subsequent rise has been "half-hearted". The Moving Average Convergence Divergence (MACD) oscillator recently moved above the zero-line, but that may be short-lived.
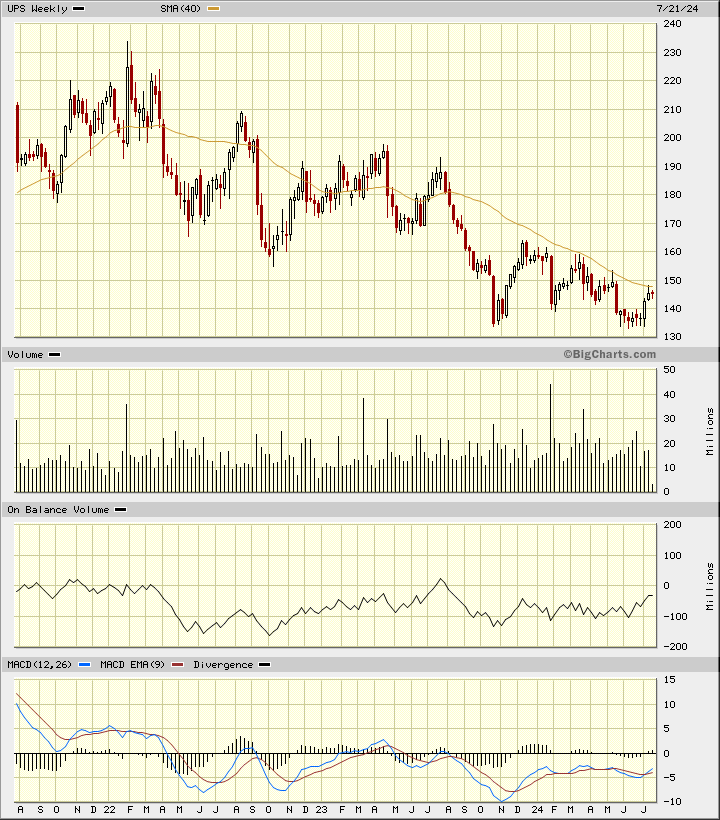
In this weekly Japanese candlestick chart of UPS, below, I see a mixed picture. Prices have made a long decline over the past three years. UPS trades below the declining 40-week moving average line. A number of lower shadows on the candles in June suggest that traders rejected the lows. Trading volume shows us an increase in recent months and could be a subtle sign of a shift in ownership from weak hands to stronger hands. The weekly OBV line has improved a little over the past two years. The MACD oscillator has improved from a low in November but remains below the zero-line.
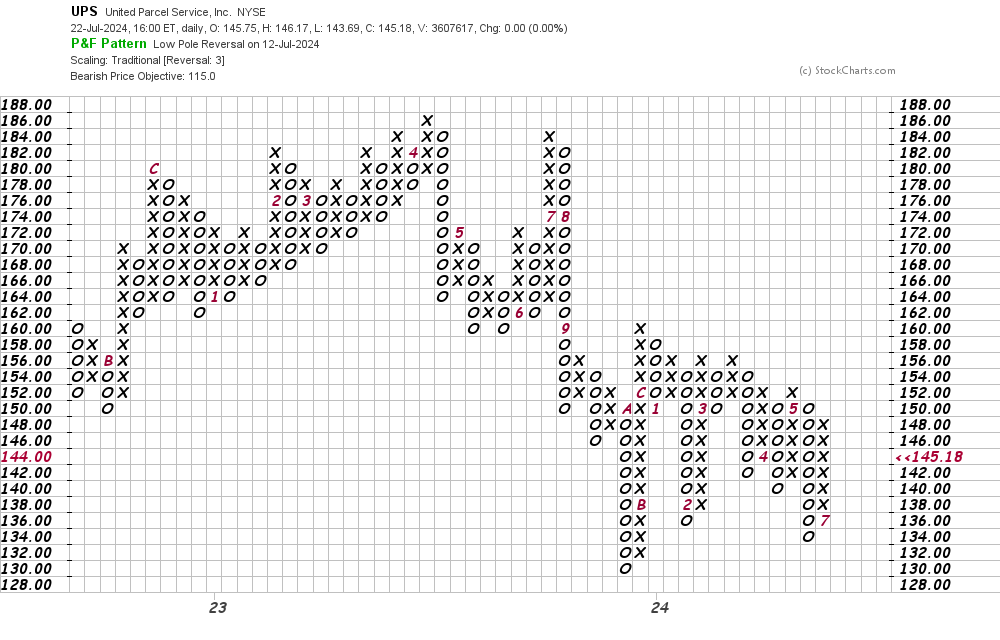
In this daily Point and Figure chart of UPS, below, I can see that the software is projecting a potential downside price target in the $115 area.
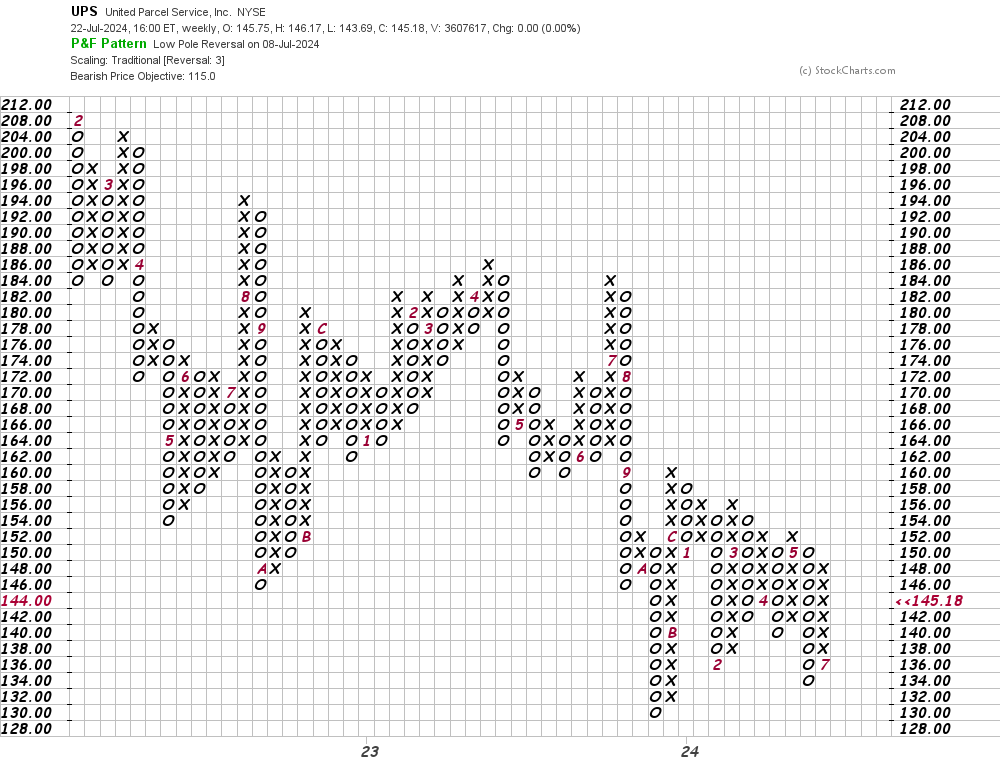
In this second Point and Figure chart of UPS, below, I used weekly price data and here too the software suggests the $115 area as a price target.
Bottom line strategy: Traders should let the dust settle on UPS today. Take no action but let's see if the early selling is quickly absorbed. A new low close for the move down will be bearish and the failure to make a new low and a lower shadow will be bullish. Keep your powder dry.
Employees of TheStreet are prohibited from trading individual securities.