Our New 3M Strategy as the Stock Continues to Improve
Let's check in on MMM again to see how traders should play the stock.
You've reached your free article limit
You've read 0 of 1 free Pro articles.
In my April 30 review of 3M Co. MMM I wrote that "The base is moving along so aggressive traders could now probe the long side of MMM in the $94 area risking to $86 for now."
Let's check in on MMM again today to see what progress has been made.
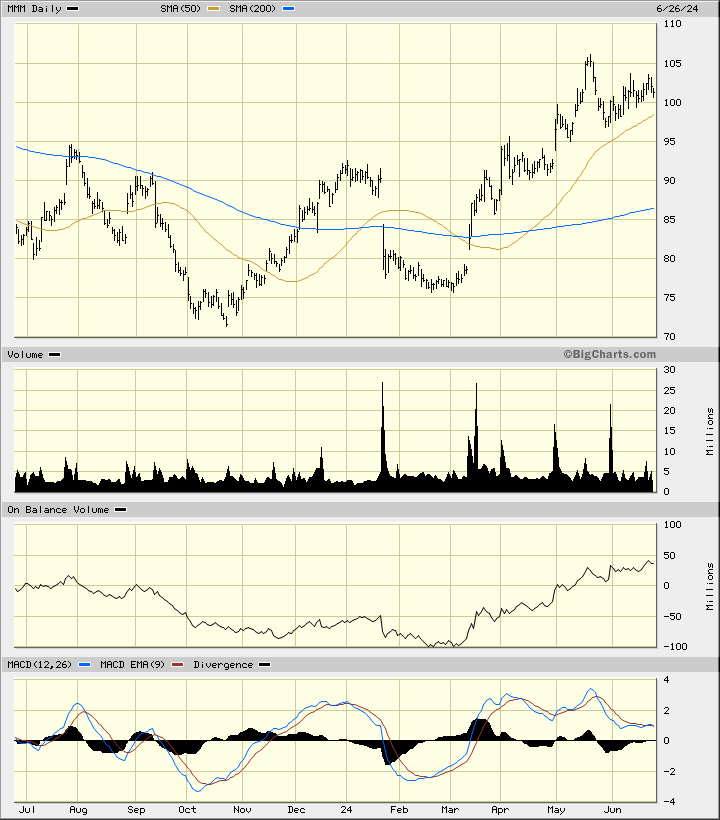
In the daily bar chart of MMM, below, I can see that the shares rallied into the middle of May before making a correction to the downside. Prices are in an uptrend and trade above the rising 50-day moving average line and above the rising 200-day moving average line.
The trading volume has been more active this calendar year. The On-Balance-Volume (OBV) line has been strong since early March and tells me that buyers of MMM have been more aggressive than sellers. The Moving Average Convergence Divergence (MACD) oscillator is above the zero line but correcting.
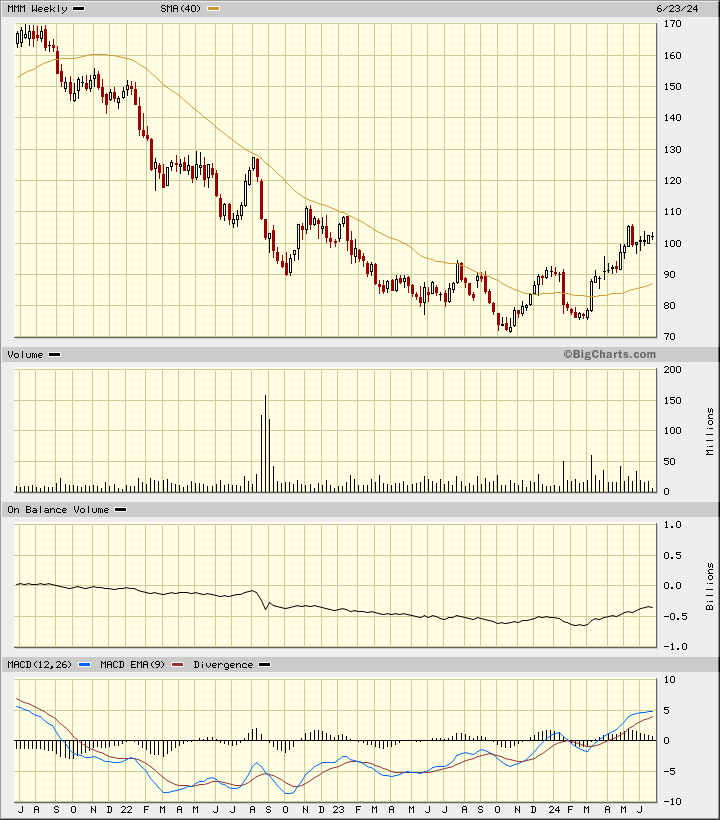
In the weekly Japanese candlestick chart of MMM, below, I can see a long decline in price followed by a decent-looking base pattern. The shares are trading above the rising 40-week moving average line.
The weekly OBV line has been going up the past four months after a lengthy decline. The trend-following Moving Average Convergence Divergence (MACD) oscillator is in a positive alignment above the zero line.
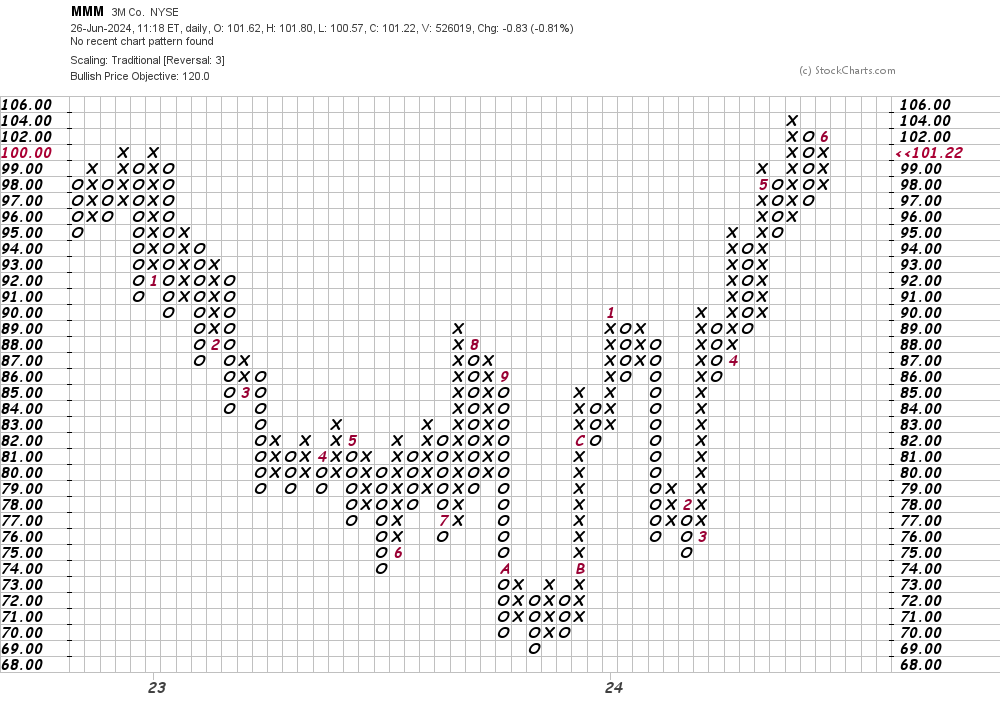
In this daily Point and Figure chart of MMM, below, I can see an upside price target in the $120 area.
In this weekly Point and Figure chart of MMM, below, I used a five-box reversal filter, which suggests a price target in the $174 area.
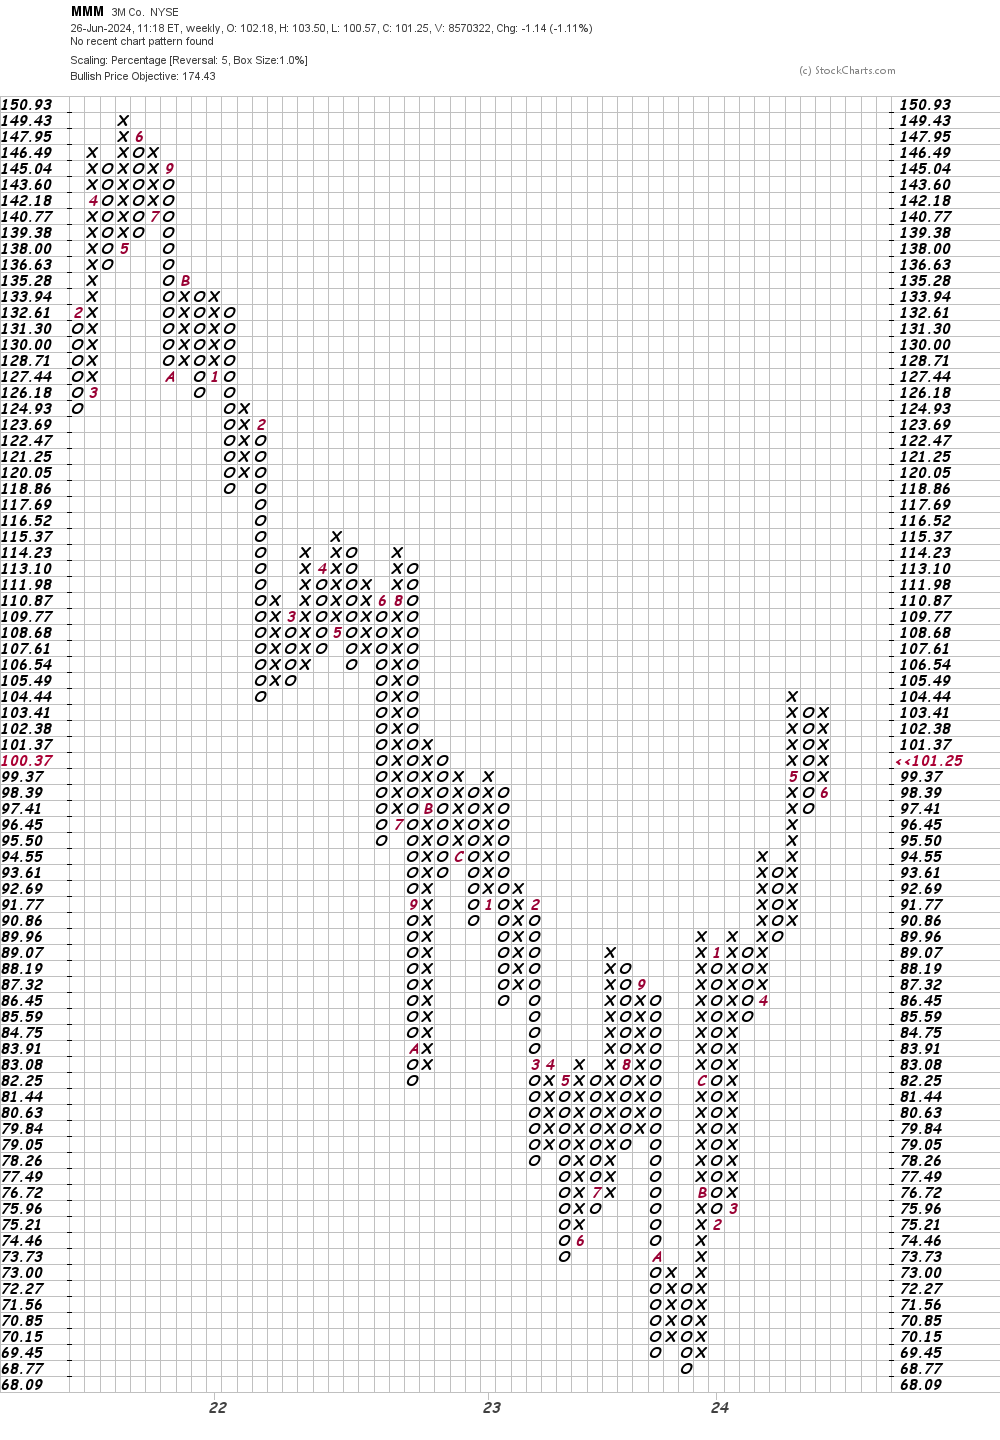
Bottom-line strategy: Traders who are long MMM should continue to hold those positions. Raise stops to $96 from $86. My price targets are $120 and then perhaps $174.
Employees of TheStreet are prohibited from trading individual securities.