We've Got a New Price Target for a Rising Tech Company
A technology manufacturer has seen its stock prices trading higher over the past 12 months and reviewing the charts indicates a new target.
You've reached your free article limit
You've read 0 of 1 free Pro articles.
Seagate Technology STX is known for manufacturing hard drives. I am no technology expert, so let's check out the charts and indicators to determine how STX is faring.
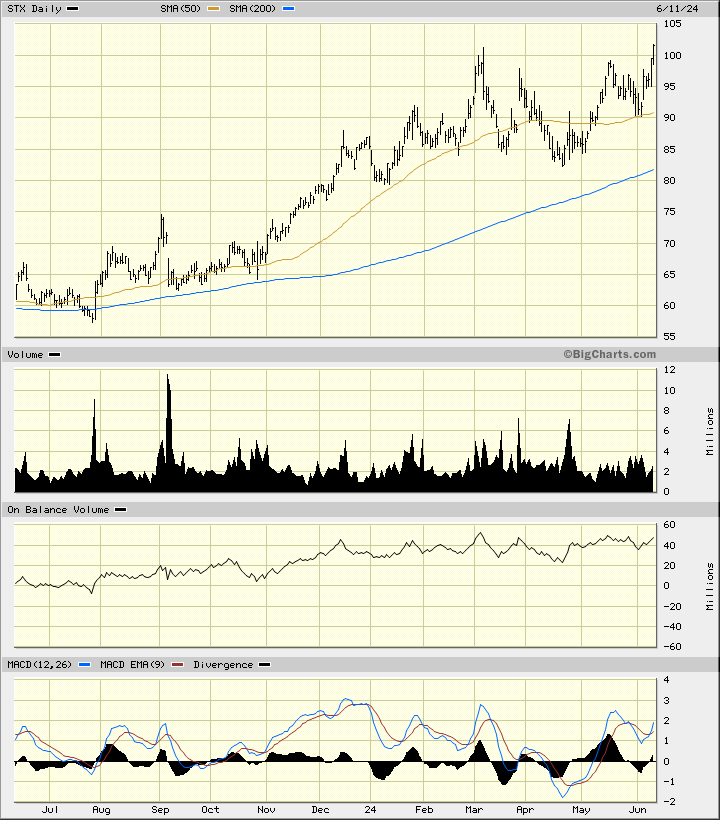
In this daily bar chart of STX below, I can see that prices have traded higher over the past 12 months. STX trades above the rising 50-day moving average line and the rising 200-day moving average line. The trading volume has been fairly active over the past year. The On-Balance-Volume (OBV) line shows a rise into early March followed by a sideways trend. The trend-following Moving Average Convergence Divergence (MACD) oscillator is in a bullish alignment above the zero line.
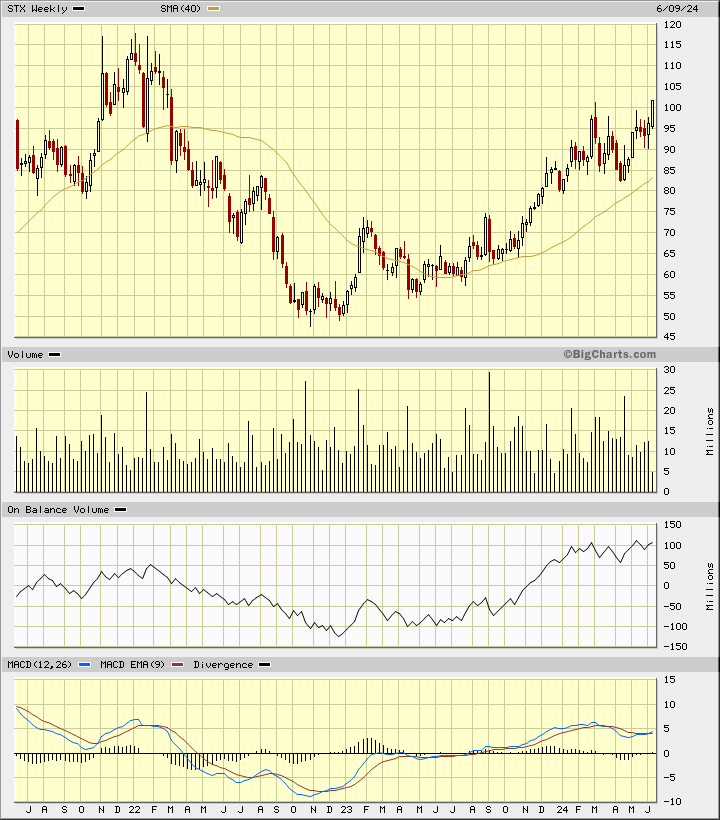
In this weekly Japanese candlestick chart of STX below, I see a bullish pattern playing out. Prices are in a longer-term rise and trade above the bullish 40-week moving average line. The weekly OBV line shows us an advance from early 2023. The MACD oscillator is above the zero line and turning higher.
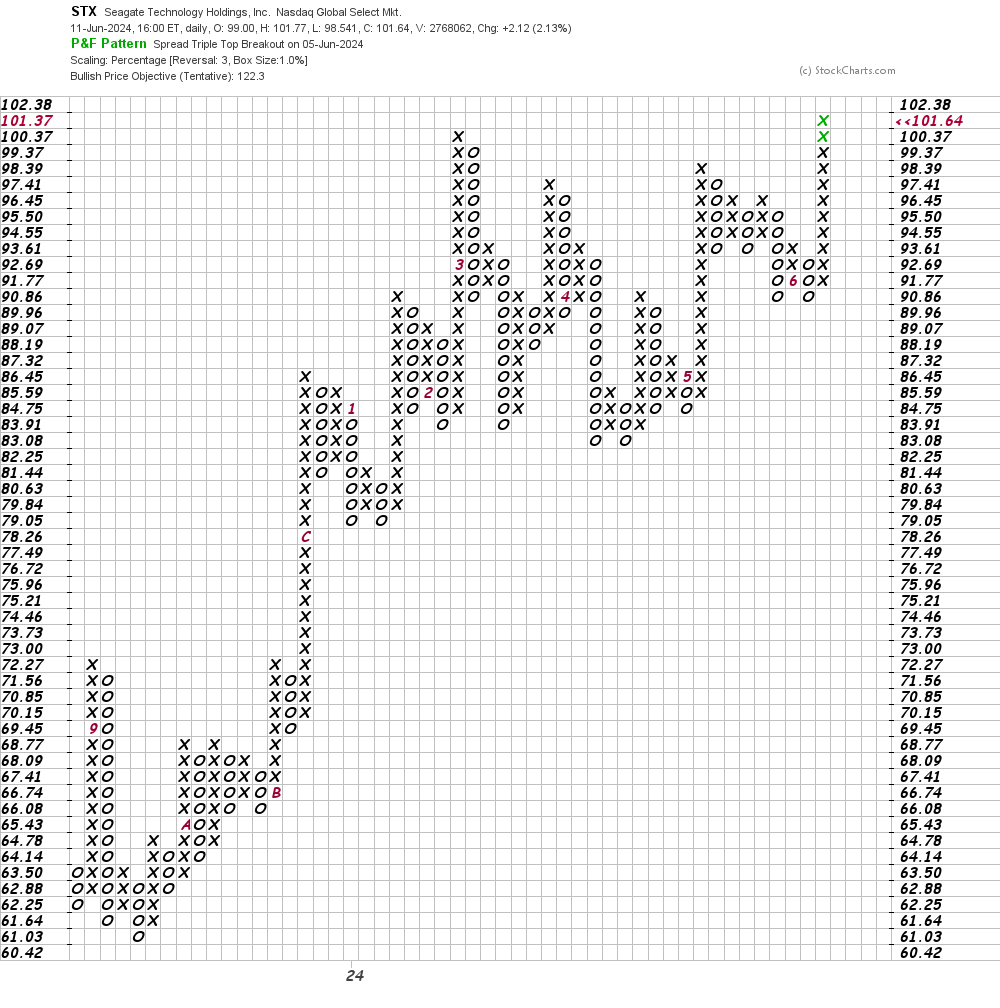
In this daily Point and Figure chart of STX below, I can see that prices made a new high for the move up and this refreshes the uptrend. The software is projecting an upside price target in the $122 area.
In this second Point and Figure chart of STX below, I used weekly price data. Here, the software points to a price target in the $126 area.
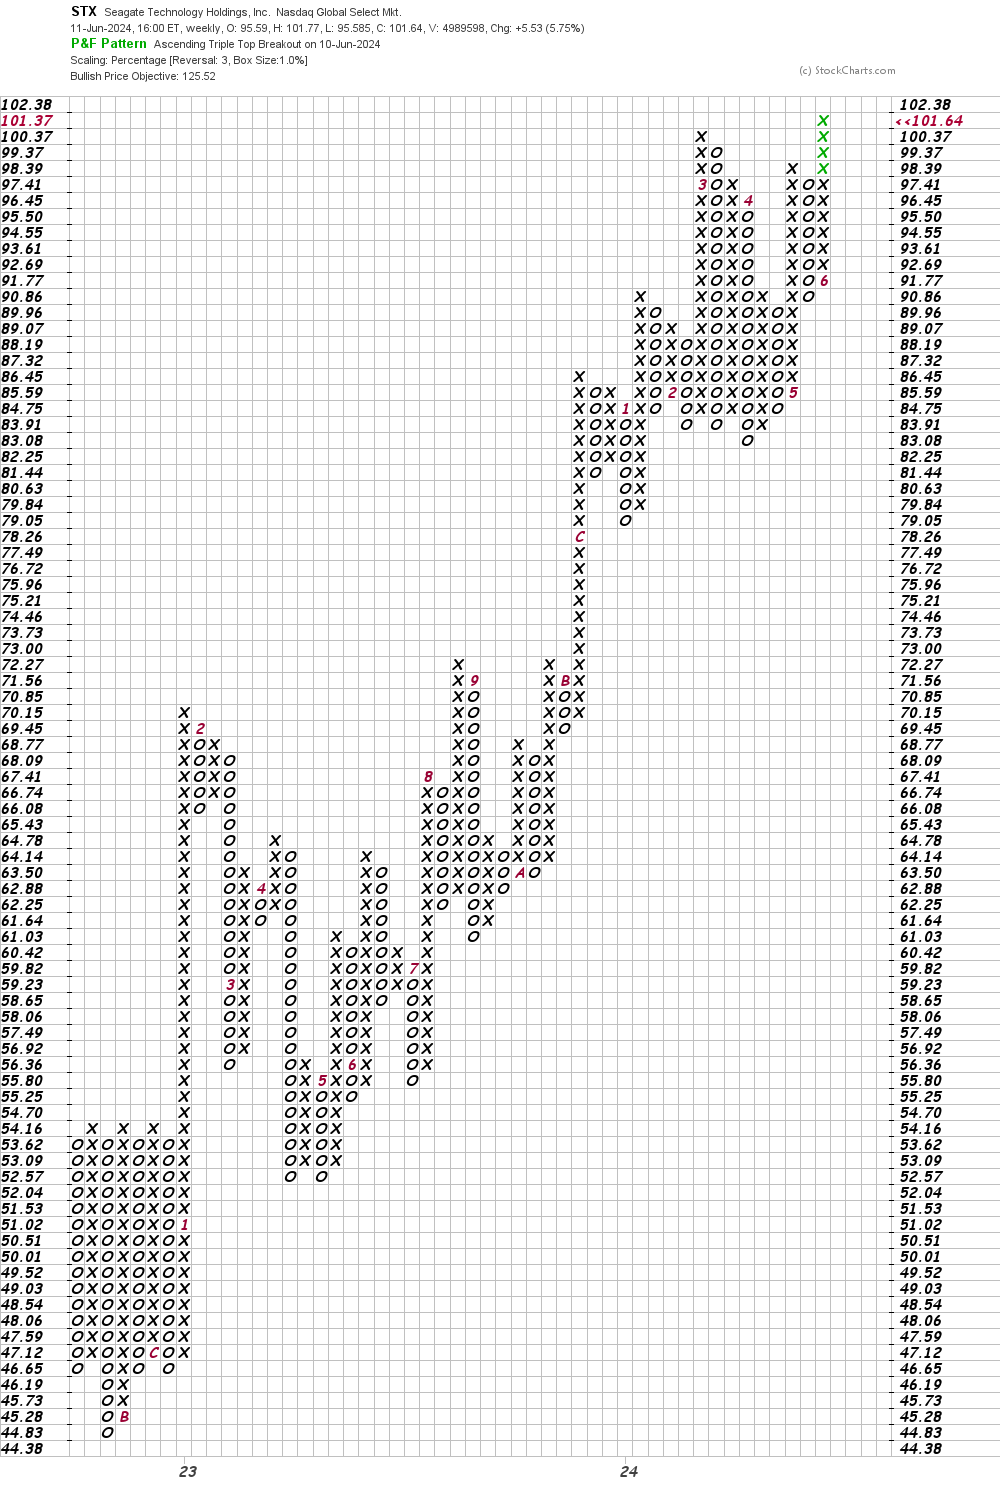
Bottom line strategy: Traders could go long STX or add to existing longs on a dip towards $100. Risk to $89 for now. The $122 to $126 area is my price target for now.
Employees of TheStreet are prohibited from trading individual securities.