There's a New Price Target to Watch on This Low-Priced Gold Name
The daily and weekly charts for New Gold include some bullish indicators and there are some price targets to watch.
You've reached your free article limit
You've read 0 of 1 free Pro articles.
New Gold NGD is a low-priced gold name that is probably not on your buy list. The company mines and produces gold, silver and copper.
I have found that the charts are nearing an important upside breakout level, so let's check them out and review the indicators.
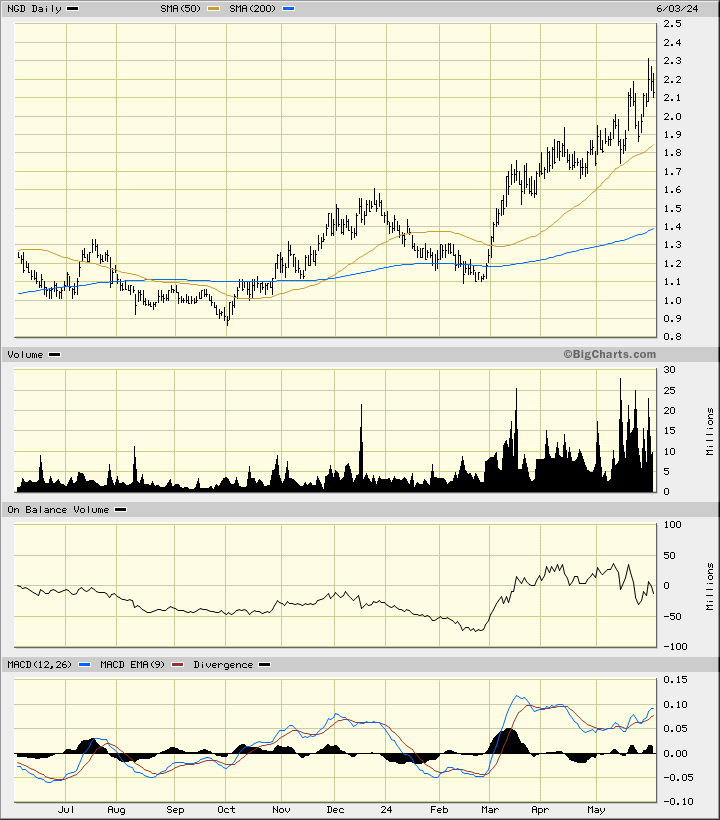
In this daily bar chart of NGD below, I can see that prices have rallied since October. Prices trade above the rising 50-day moving average line and above the rising 200-day moving average line. The daily trading volume has increased sharply in the last three months. The On-Balance-Volume (OBV) line jumped higher in March and April but was corrected in May. The Moving Average Convergence Divergence (MACD) oscillator has been improving the past month.
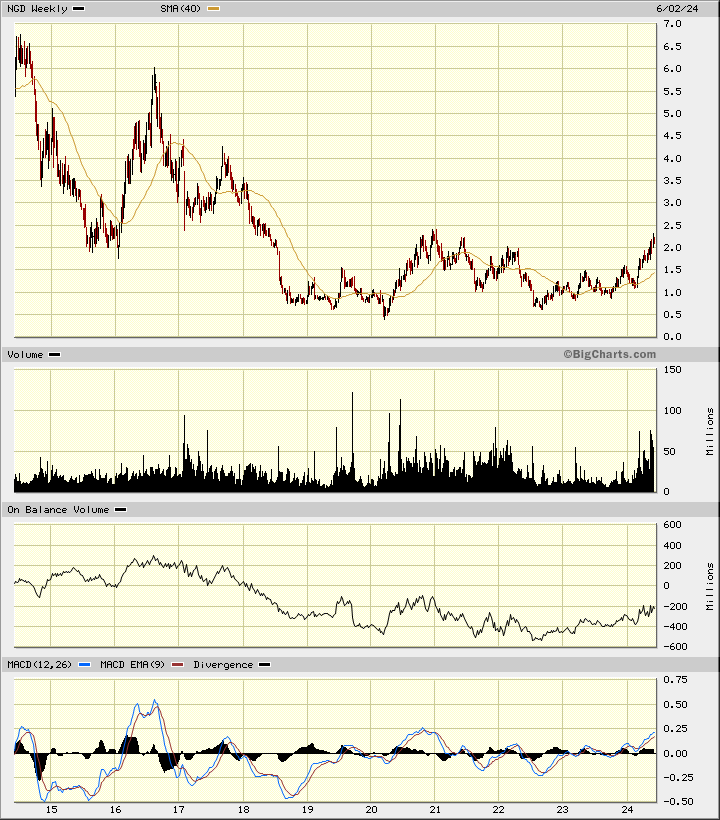
In this weekly Japanese candlestick chart of NGD below, I went back a decade to show you the size of the potential base pattern. Prices trade above the rising 40-week moving average line. The upside breakout is a weekly close above $2.50 — the highs of 2020 to 2021. The weekly OBV line shows gains from the middle of 2022. The MACD oscillator is in a bullish alignment above the zero line.
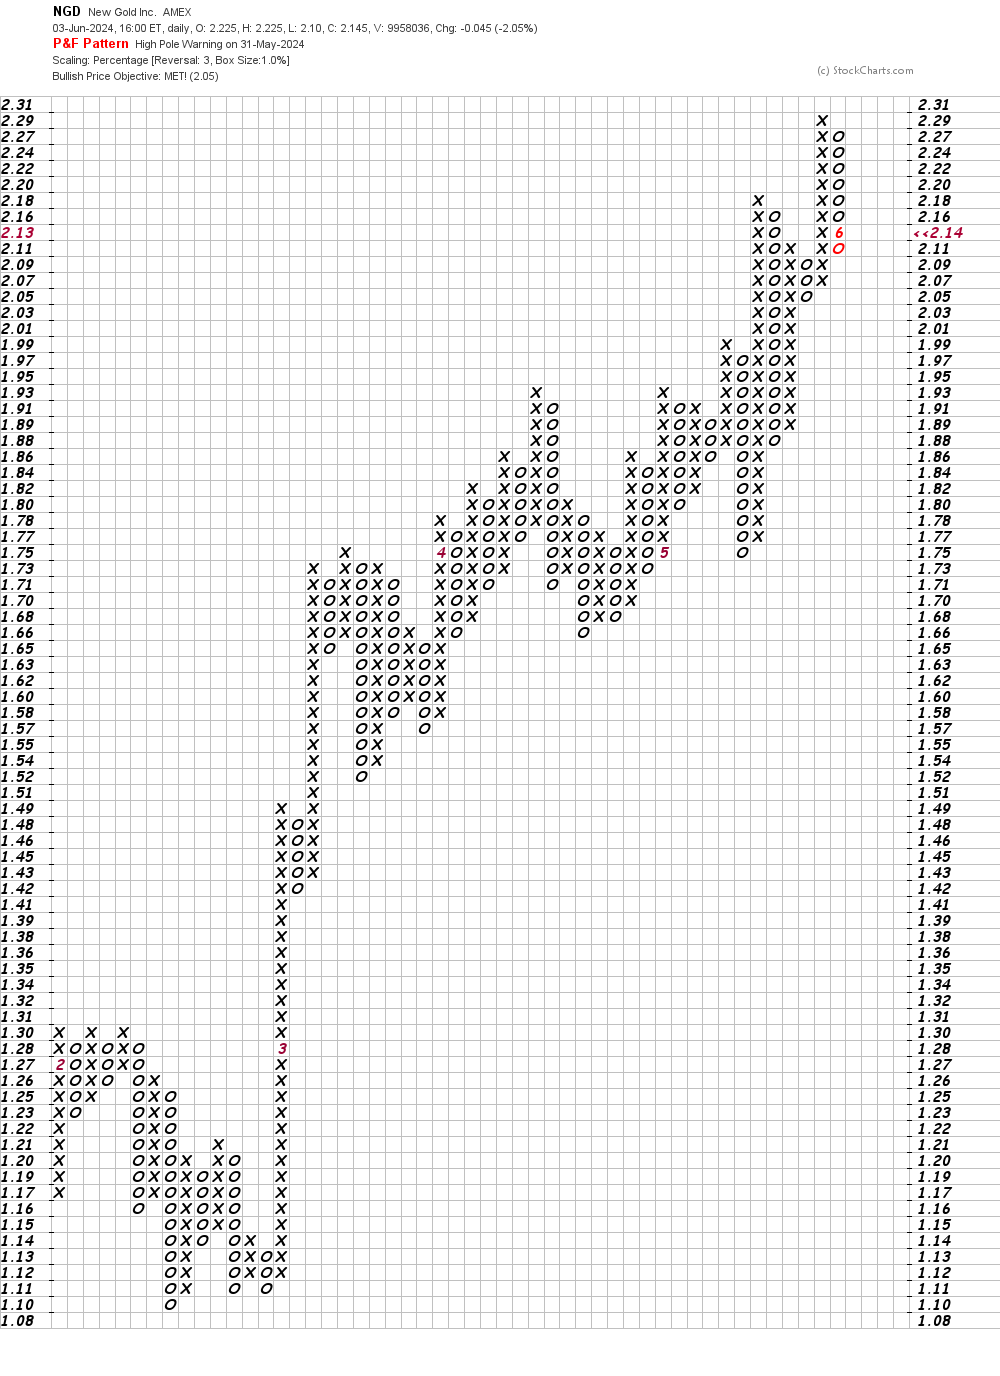
In this daily Point and Figure chart of NGD, below, I can see that prices have reached an upside price target in the $2 area.
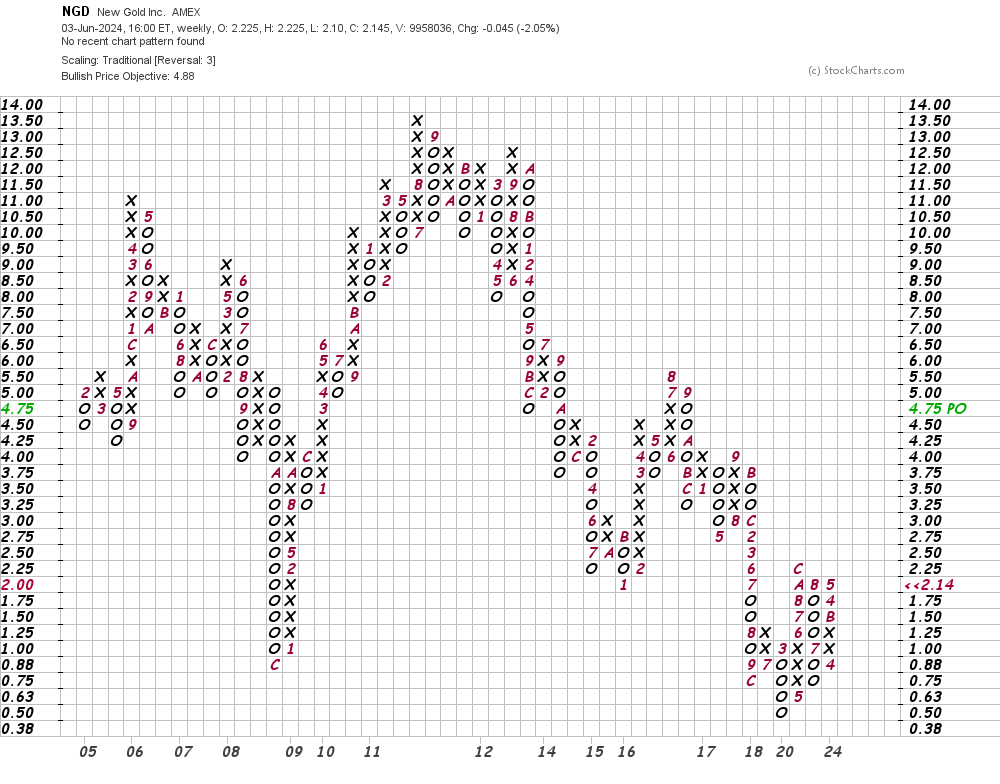
In this weekly Point and Figure chart of NGD, below, I can see an upside price target in the $5.00 area. A trade at $2.50 will refresh the uptrend.
Bottom line strategy: Traders with patience should wait for an upside breakout above $2.50 before going long NGD
Employees of TheStreet are prohibited from trading individual securities.