More Kicks for Phillips 66? We're Adjusting Our Bullish Price Target
These energy shares have rallied above the 50-day and 200-day moving average lines.
You've reached your free article limit
You've read 0 of 1 free Pro articles.
On Tuesday morning Phillips 66 PSX reported its second-quarter 2024 results. The Houston-based downstream energy company posted non-GAAP EPS of $2.31, which beat estimates by $0.33.
PSX is trading 5% higher Tuesday so, let's check out the charts and indicators to see if it has further upside potential.
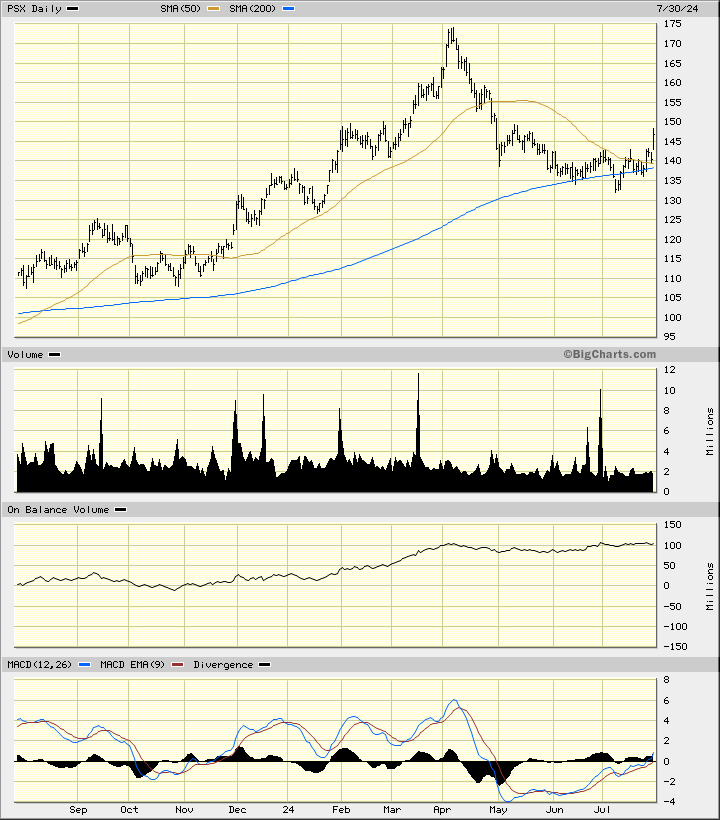
In the daily bar chart of PSX, below, I can see that the shares made a small bottom formation the past three months. Prices have rallied above the 50-day and 200-day moving average lines.
The On-Balance-Volume (OBV) line has moved higher the past 12 months. The Moving Average Convergence Divergence (MACD) oscillator is now crossing above the zero line for an outright buy signal.
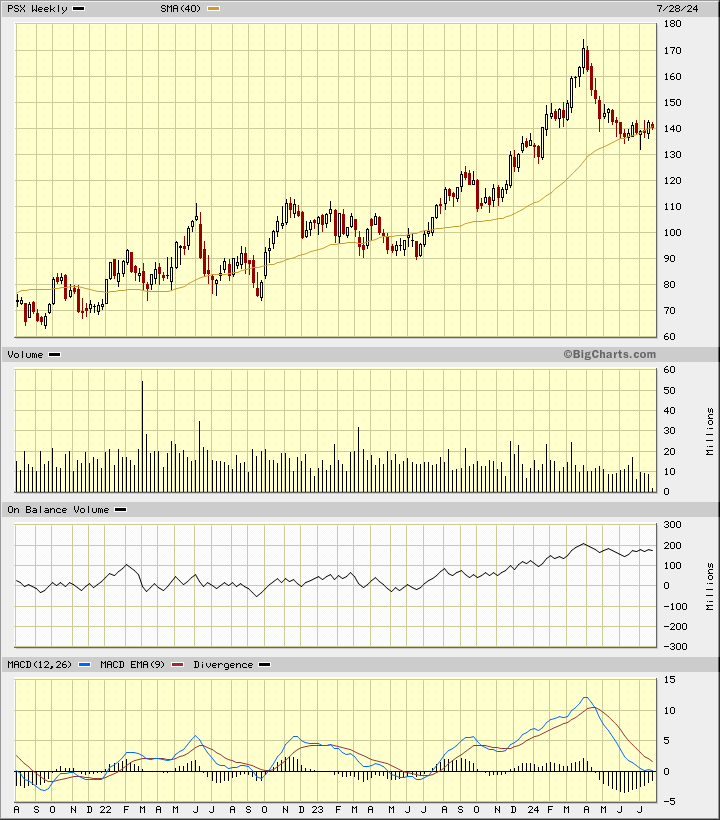
In the weekly Japanese candlestick chart of PSX, below, I can see a long rise in the share price over the past three years. Prices are trading above the 40-week moving average line.
The weekly OBV line shows us a positive trend for a little bit longer than the past year. The MACD oscillator has declined back to the zero line and should narrow in the weeks ahead.
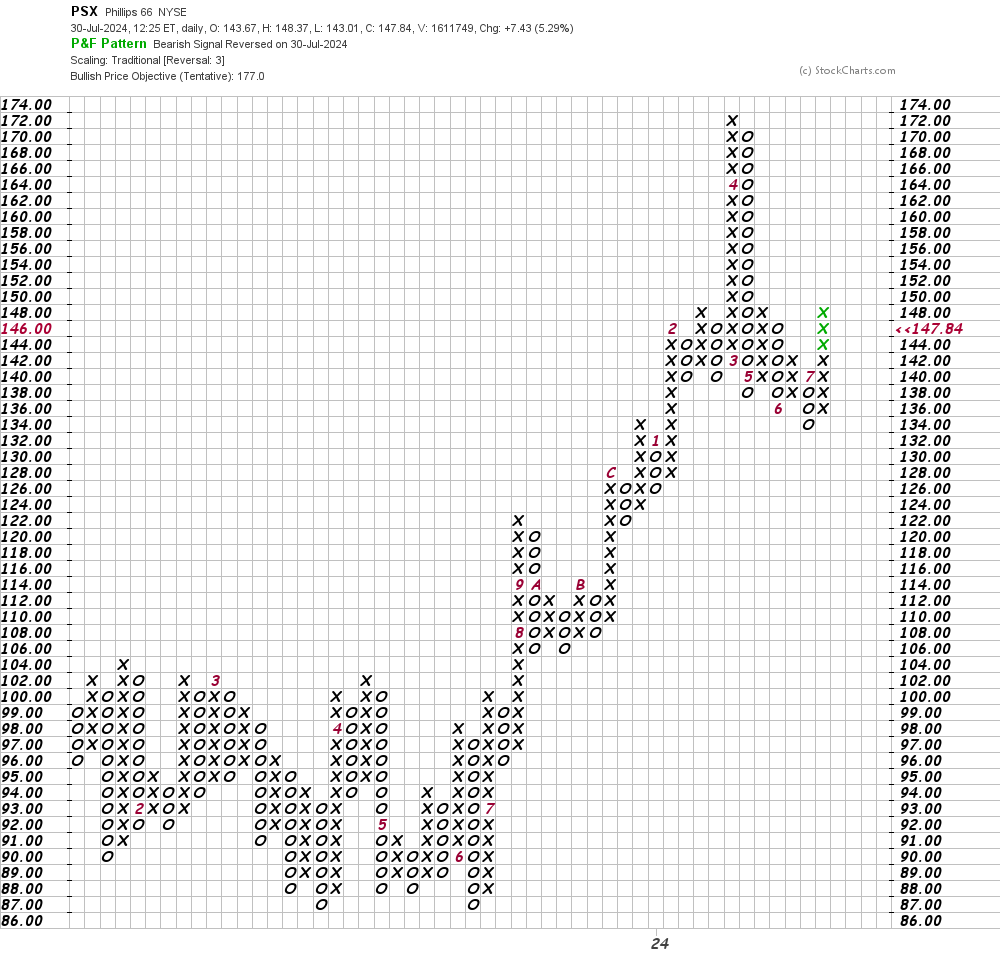
In this daily Point and Figure chart of PSX, below, I can see a price target in the $177 area.
In this weekly Point and Figure chart of PSX, below, I can see a price target in the $177 area - the same as the daily chart above.
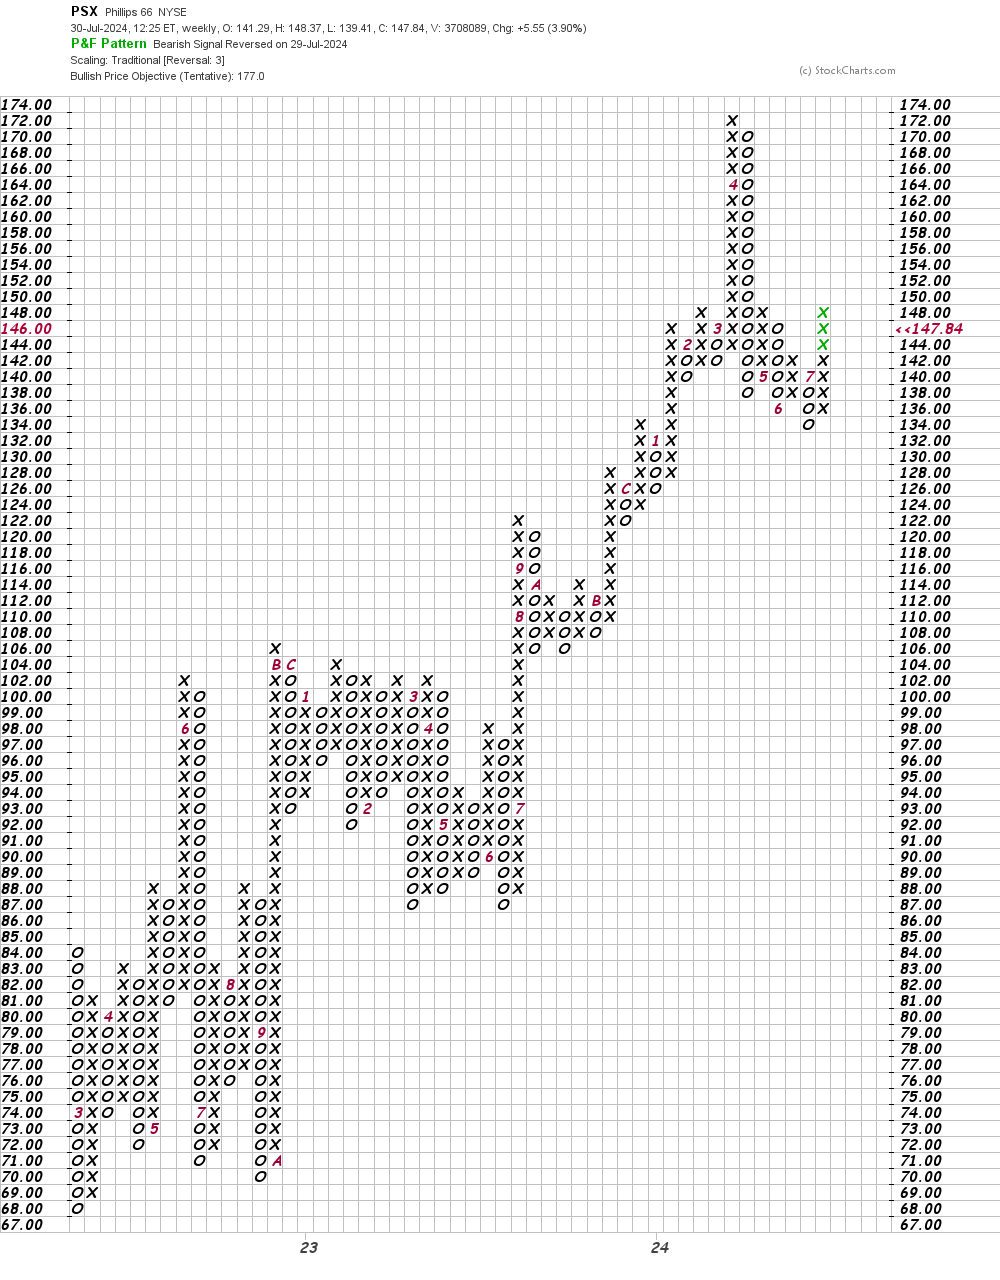
Bottom-line strategy: Aggressive traders could go long PSX on a dip towards $145 risk to $135 for now. The $177 area is my price target for now.
Employees of TheStreet are prohibited from trading individual securities.