Let's See if Sherwin-Williams Is Painting the Charts Red or Green
Here's my plan for SHW after it reports mixed earnings.
You've reached your free article limit
You've read 0 of 1 free Pro articles.
The Sherwin-Williams Company SHW reported an adjusted earnings per share of $3.70 Tuesday, which beat estimates by $0.21 but revenue of $6.27 billion missed by $60 million.
Let's put out a tarp and get our tools and check out the charts and indicators.
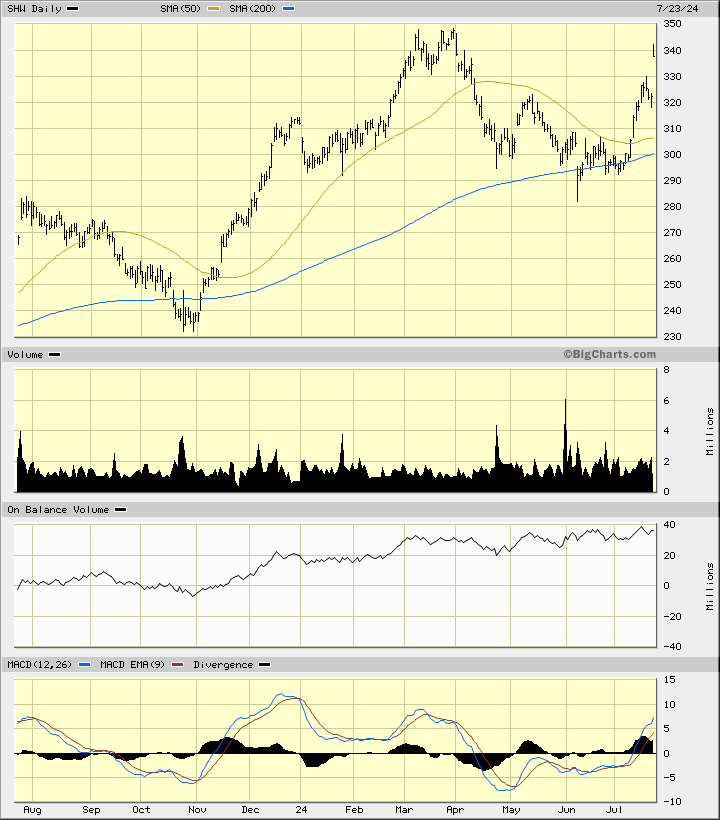
In this daily bar chart of SHW, below, I can see that prices gapped higher Tuesday. SHW trades above the rising 50-day moving average line and above the rising 200-day moving average line. The On-Balance-Volume (OBV) has shown positive movement since early November telling me that buyers of SHW have been more aggressive than sellers. The trend-following Moving Average Convergence Divergence (MAD) oscillator is bullish as it stands above the zero-line.
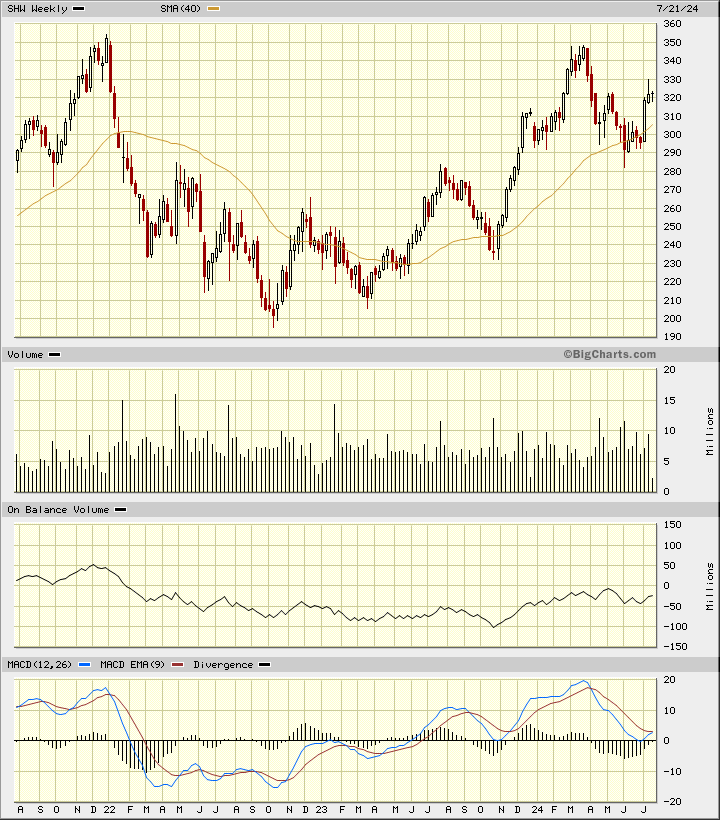
In this weekly Japanese candlestick chart of SHW, below, I see a generally positive picture. Prices are in an uptrend and trade above the rising 40-week moving average line. The weekly OBV line has been mostly positive since October. The MACD oscillator is crossing to the upside from above the zero-line.
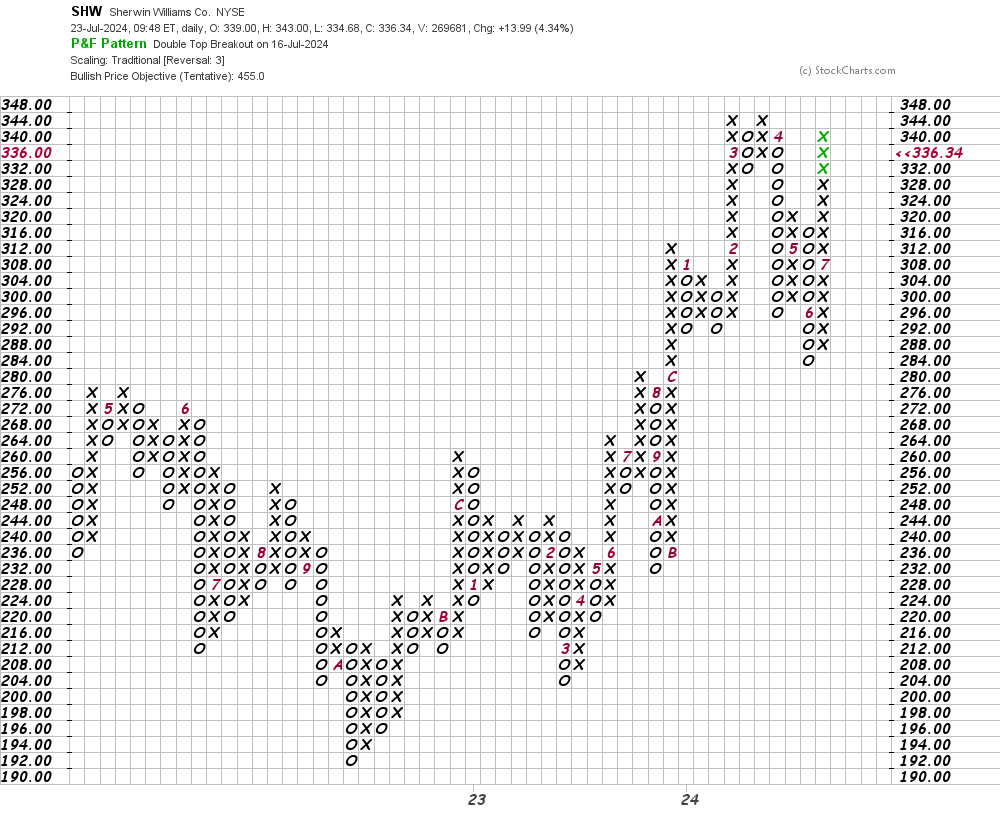
In this daily Point and Figure chart of SHW, below, I can see a potential upside price target in the $455 area.
In this weekly Point and Figure chart of SHW, below, I can see the same $455 price target as shown on the daily chart above.
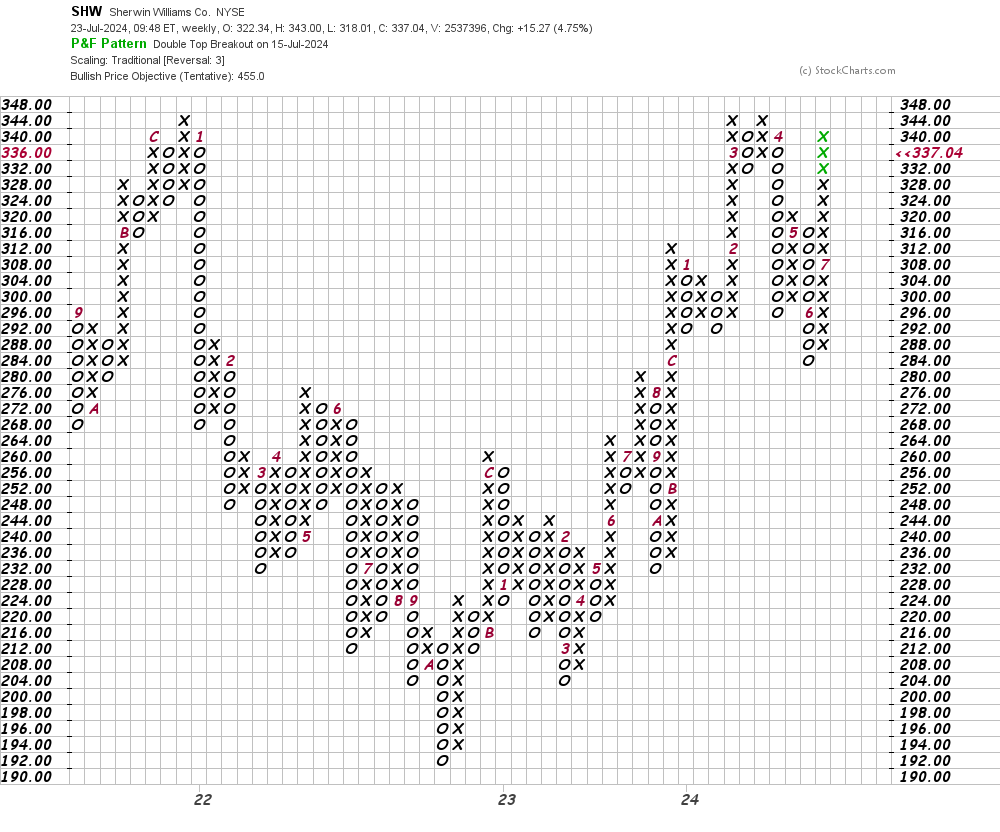
Bottom line strategy: Traders could go long SHW on strength above $348, which is a new high on the two Point and Figure charts above.
Employees of TheStreet are prohibited from trading individual securities.