Let's Put Pencil to International Paper's Charts After Suzano Buy Folds
Failure to ink deal with Brazilian company spells sinking share prices for now, but the story isn't over yet for IP.
You've reached your free article limit
You've read 0 of 1 free Pro articles.
Shares of International Paper IP are sinking Thursday after Brazil's Suzano (SUZ) walked away from a bid for the manufacturer of pulp and paper products.
I looked at IP in late May and wrote that "the charts are bullish and I would look for prices to head higher from current levels."
Shares of IP are trading about 14% lower around about $40.
Let's check and see what that kind of opening will do to the charts.
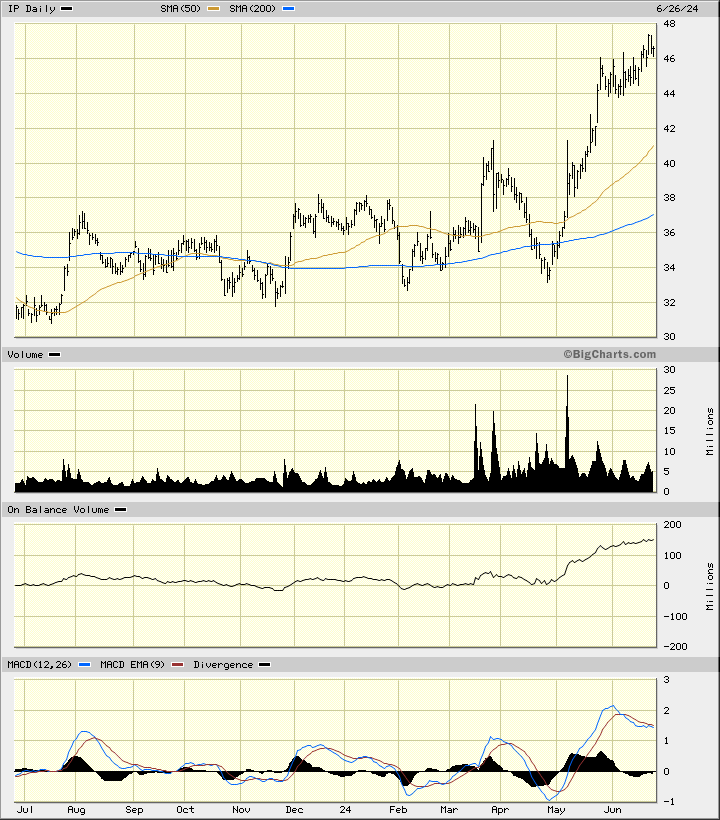
In this daily bar chart of IP, below, I see (in hindsight) a mixed chart and indicators. Prices rallied from late April to late June. IP trades above the rising 50-day moving average line and above the rising 200-day moving average line. Based on pre-market trades we are likely to see IP test the 50-day moving average line. The trading volume increased into early May and then declined as the rally matured. The On-Balance-Volume (OBV) line shows strength in May and June. The trend-following Moving Average Convergence Divergence (MACD) oscillator crossed to the downside at the end of May and tells us that the strength of the advance has been fading.
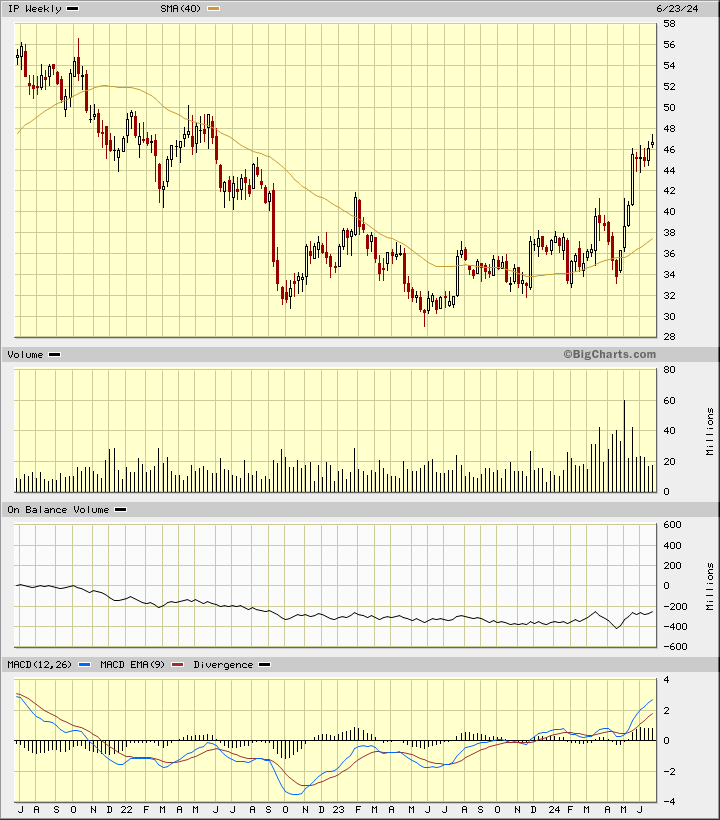
In this weekly Japanese candlestick chart of IP, below, I can see that the most recent candle was part of a top reversal pattern. A bearish (red) candle this week will confirm the reversal. Prices are above the rising 40-week moving average line but this is a lagging indicator. The weekly volume moved up into early May and then declined. The OBV line shows a limited period of strength. The Moving Average Convergence Divergence oscillator is above the zero-line, but it looks like it will now start to narrow.
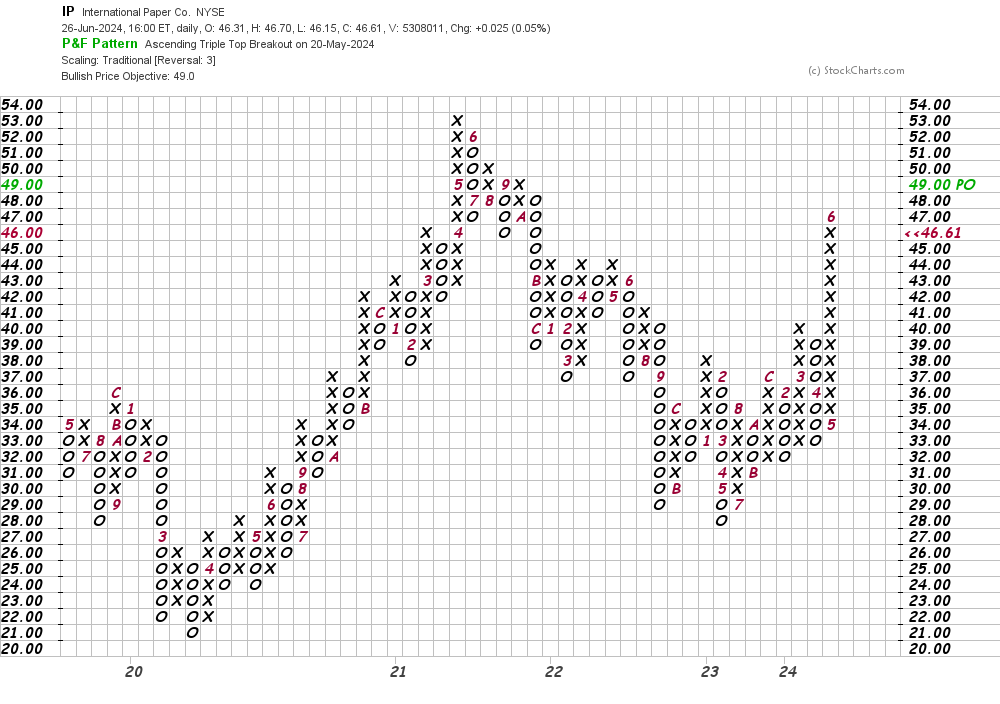
In this daily Point and Figure chart of IP, below, I can see a potential upside price target in the $49 area. Today's early weakness is not plotted.
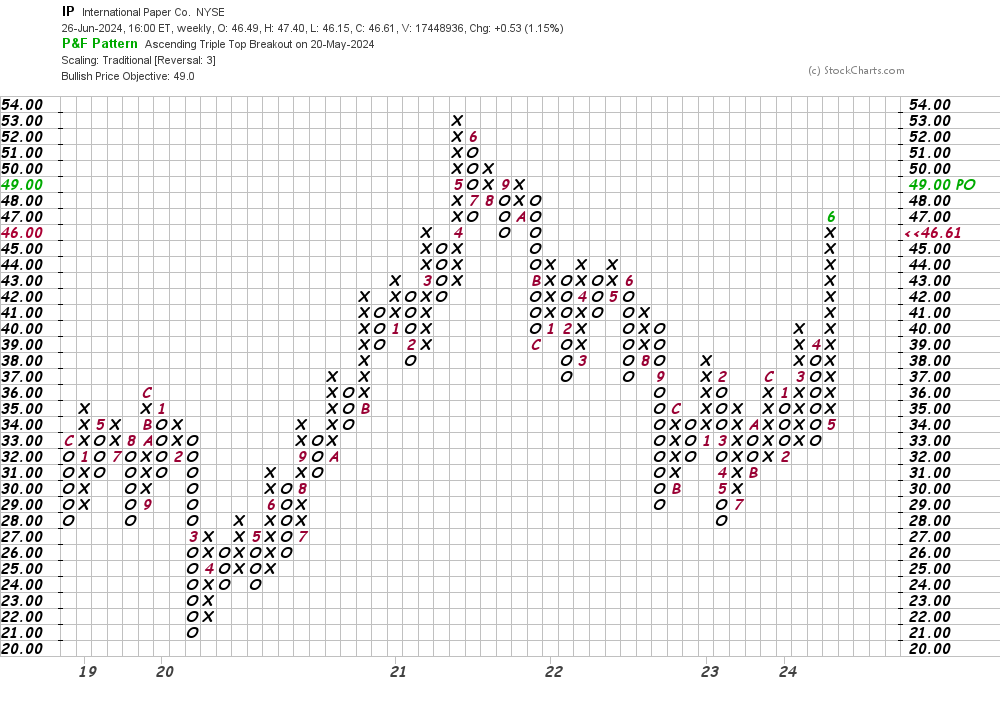
In this weekly Point and Figure chart of IP, below, I see the same $49 price target as the daily chart above.
Bottom line strategy: IP is going to make a pullback. Most if not all of the rally from late April could be retraced in the weeks ahead.
Employees of TheStreet are prohibited from trading individual securities.