Is Broadcom Poised for Fresh Gains?
Shares of the semiconductor designer have stalled out in the $1,400 area.
You've reached your free article limit
You've read 0 of 1 free Pro articles.
Semiconductor designer Broadcom AVGO is a leading supplier of "ethernet switching & routing merchant silicon, network adapters, controllers, PHYs and PHY transceivers."
With other chip and AI stocks getting a lot of attention, let's check out the charts and indicators of this Palo Alto, California-based name.
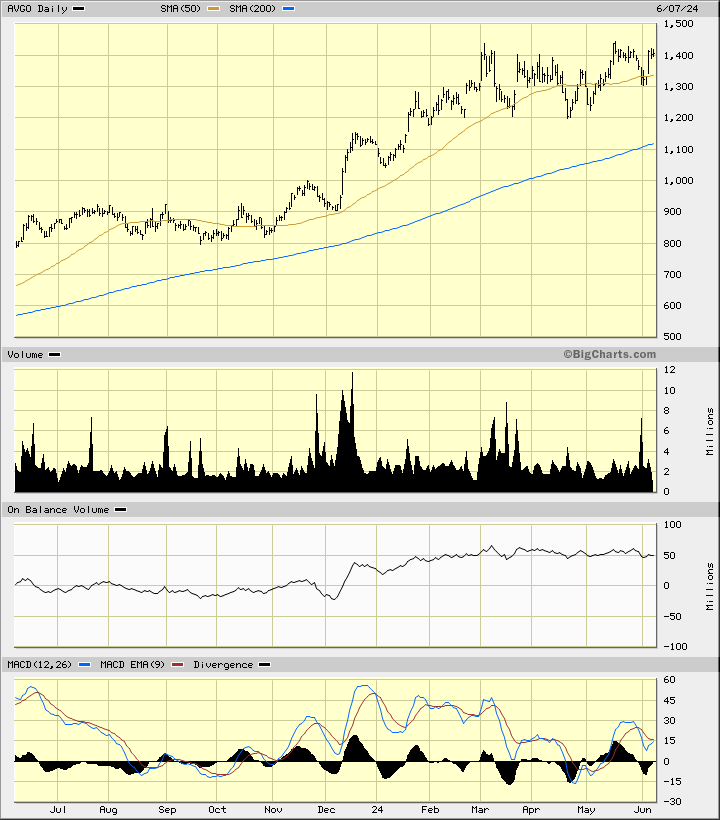
In this daily bar chart of AVGO, below, I can see that the stock has traded higher the past year. The price action shows us higher lows since February. The shares have stalled out in the $1,400 area.
The On-Balance-Volume (OBV) line has been stalled the last three months. The Moving Average Convergence Divergence (MACD) oscillator is above the zero line and poised for a potential upside crossover and fresh buy signal.
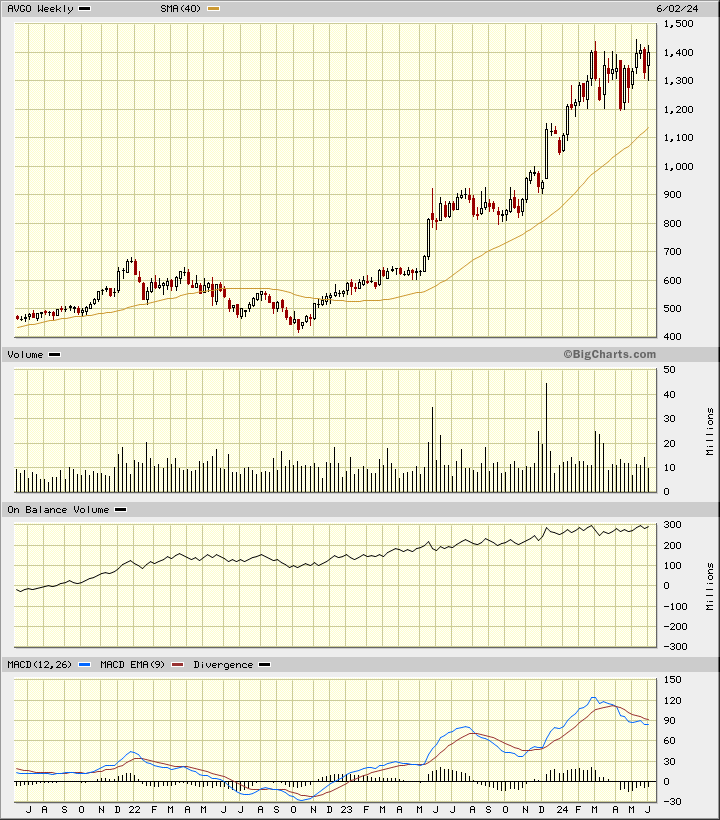
In the weekly Japanese candlestick chart of AVGO, below, I can see a longer-term uptrend. Prices trade above the rising 40-week moving average line.
The weekly OBV line shows strength the past three years. The MACD oscillator has been correcting lower but is well above the zero line. I can see some upper shadows above $1,400 but I don't get the impression that a top reversal pattern is being built.
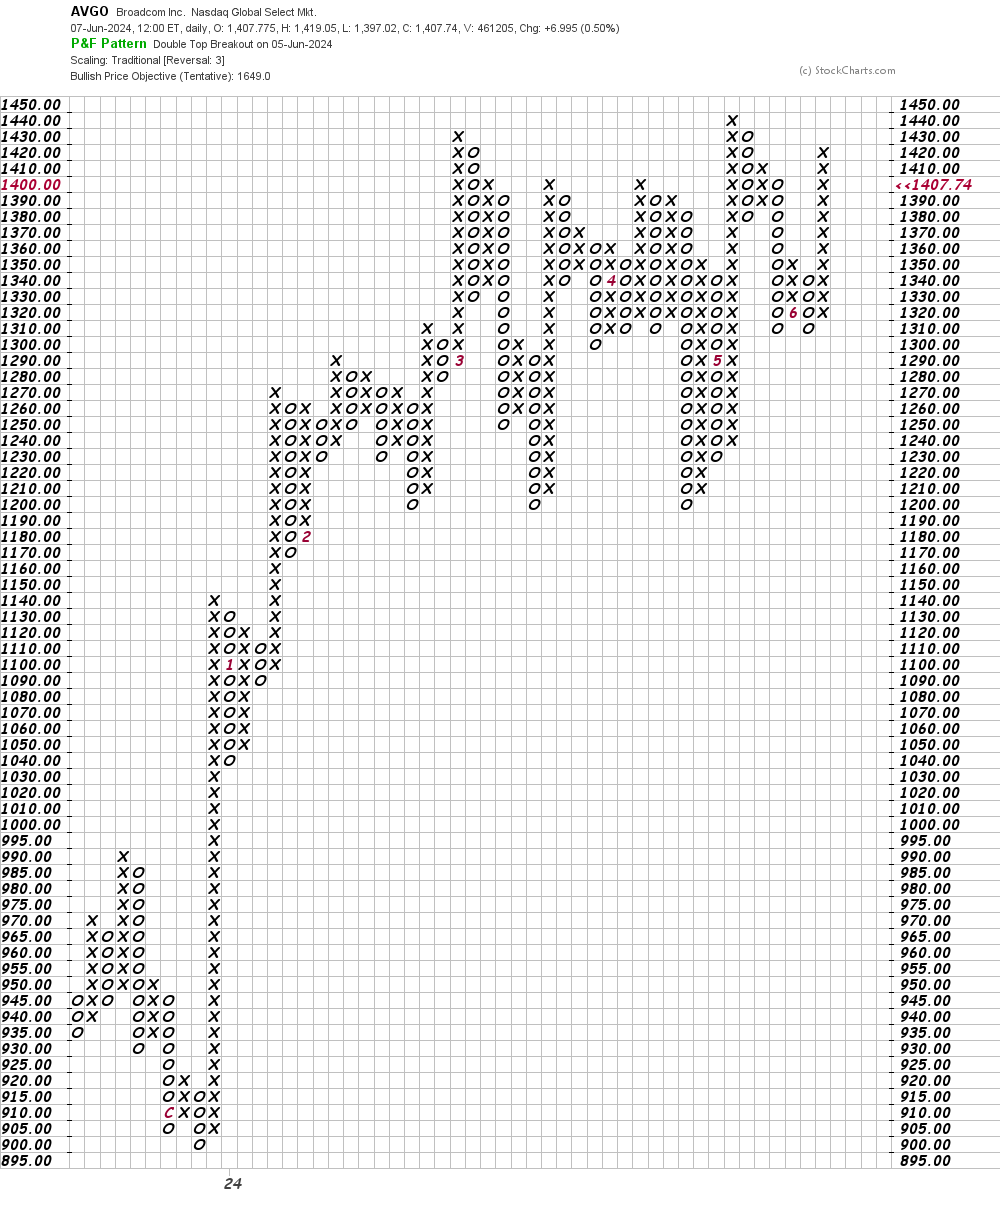
In this daily Point and Figure chart of AVGO, below, I can see a price target in the $1,649 area.
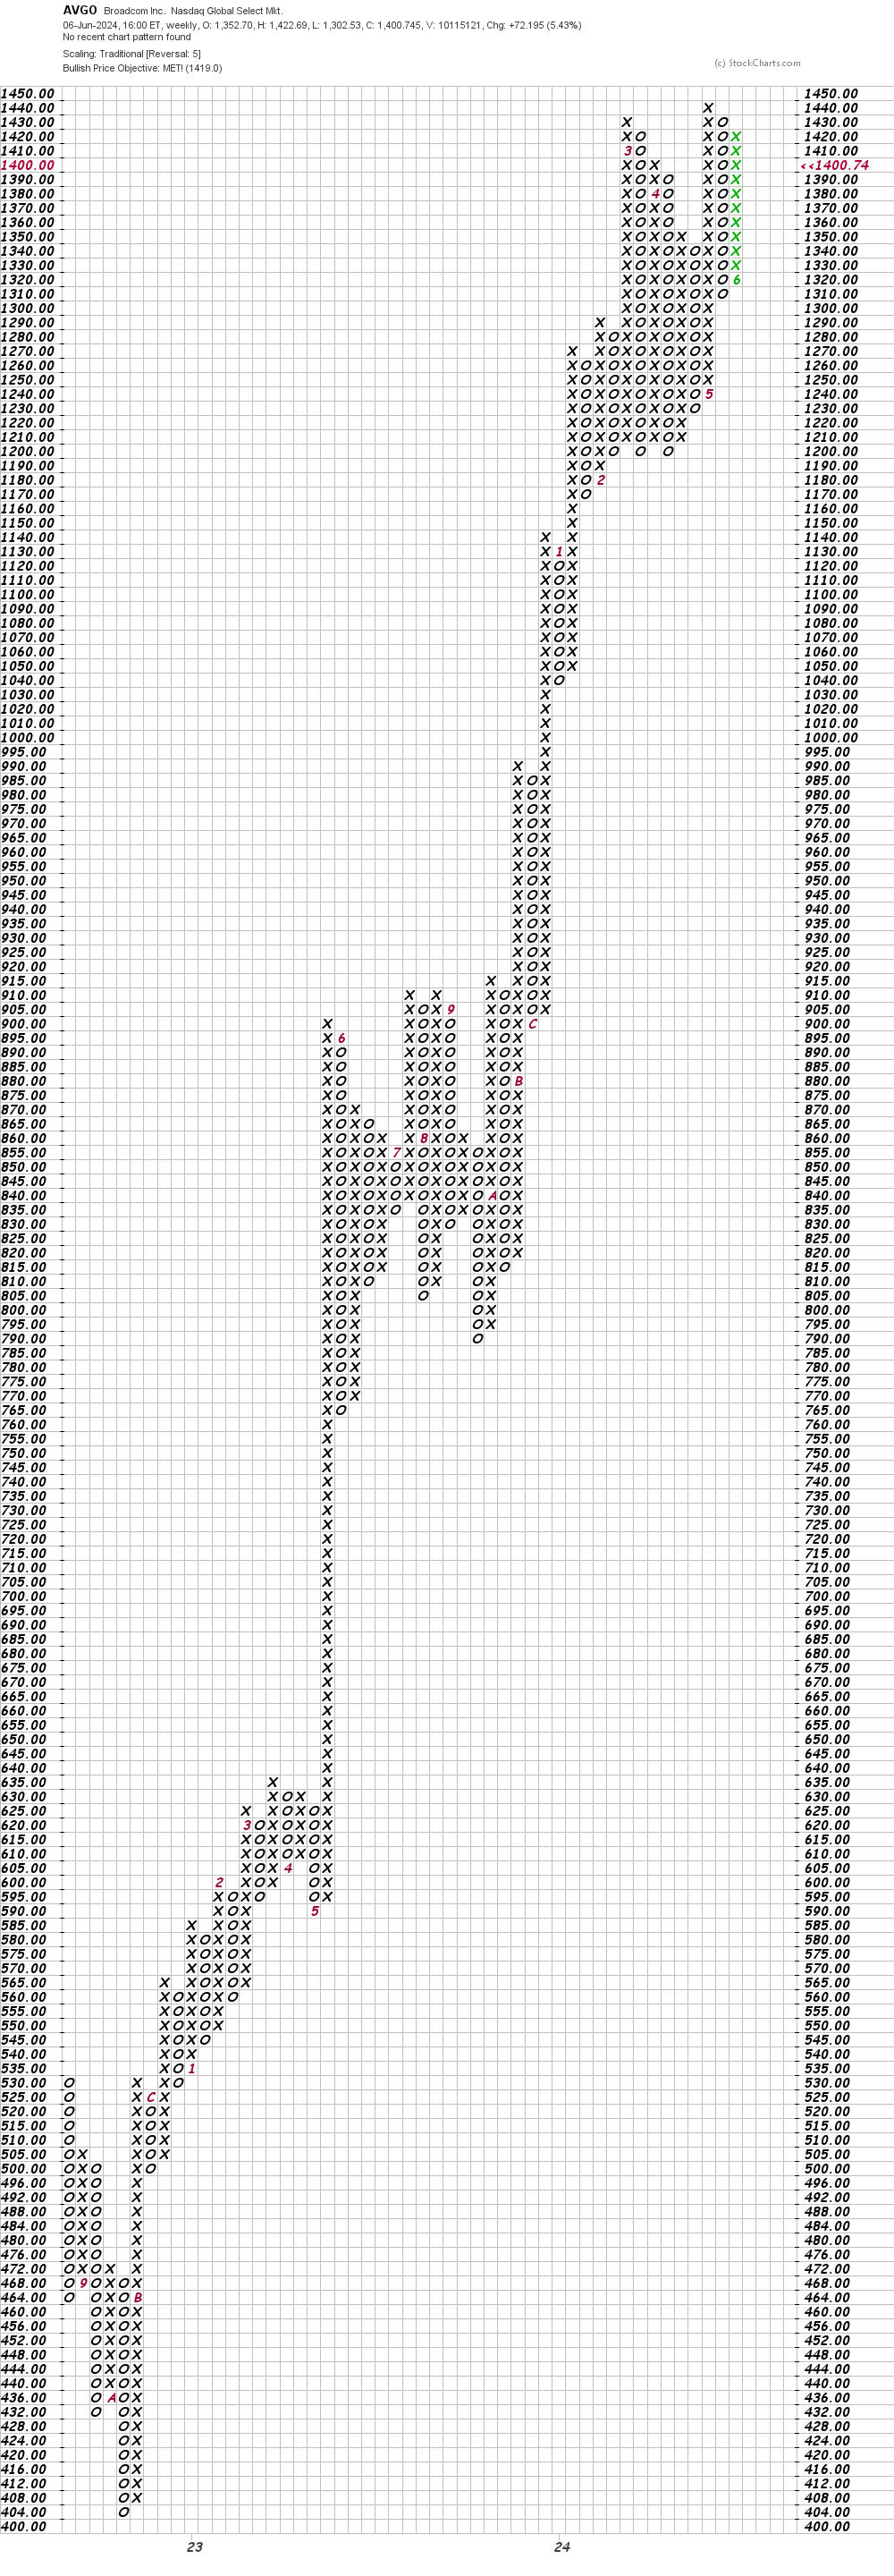
In this weekly Point and Figure chart of AVGO, below, I can see that prices reached a price target in the $1,419 area.
Bottom-line strategy: Traders could go long AVGO at current levels but they need to risk below $1,300.
Employees of TheStreet are prohibited from trading individual securities.