I Wouldn't Follow the CRWD ...
CrowdStrike gets hit with a damage suit after global tech outage, so let's check the charts.
You've reached your free article limit
You've read 0 of 1 free Pro articles.
Delta Airlines DAL has reportedly hired a law firm and is seeking damages from CrowdStrike CRWD and Microsoft MSFT after a massive tech outage. Some analysts are suggesting that damages for Delta could reach $350 million. MSFT is due to report earnings after the close so let's check out the charts of CRWD.
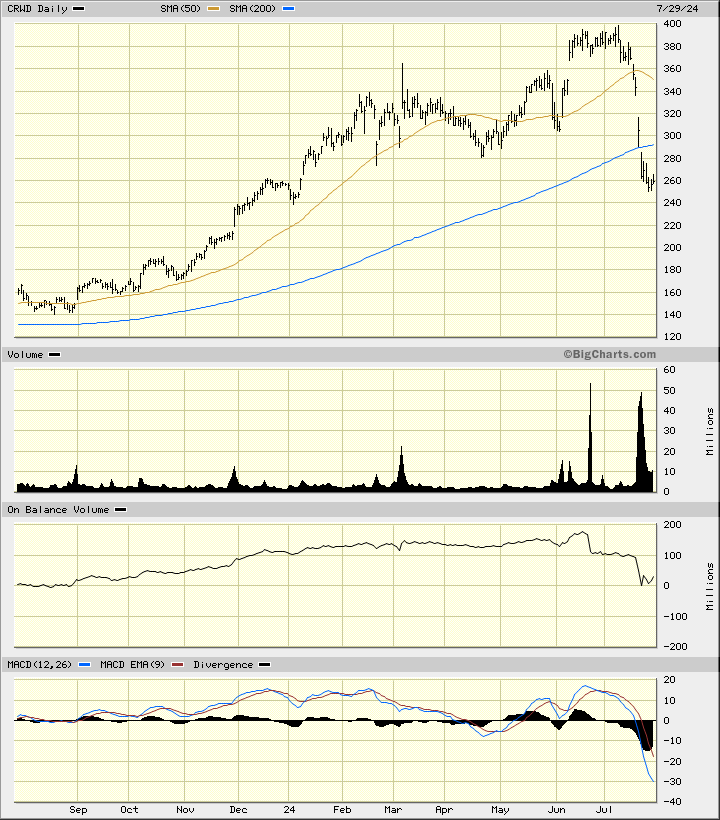
In this daily bar chart of CRWD, below, I can see a weak-looking chart. Prices are below the 200-day moving average line and the slope of the 50-day line is now negative. The trading volume has been very heavy so we know there has been some aggressive selling. The On-Balance-Volume (OBV) line has weakened significantly since the middle of March. The Moving Average Convergence Divergence (MACD) oscillator is bearish as it is below the zero-line.
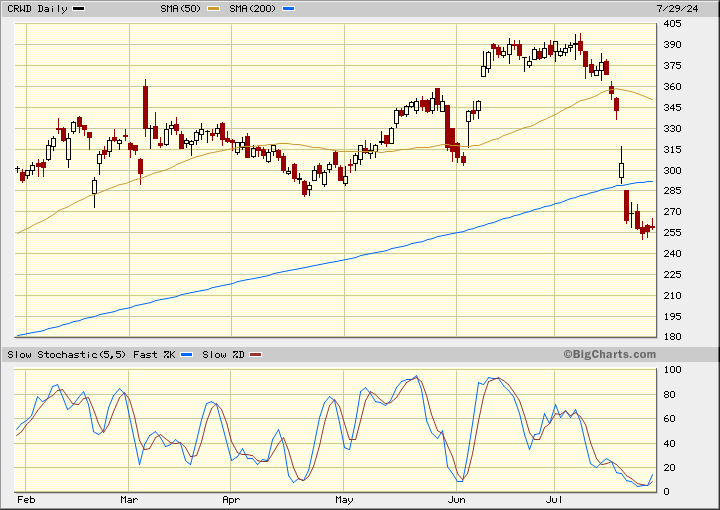
In this daily Japanese candlestick chart of CRWD, below, I look at just the last six months. The recent candles are red or bearish (the close is below the open). The most recent candle has an upper shadow which is interesting even after a big decline - even a big decline traders are rejecting the highs. The slow stochastic is extremely oversold but that does not guarantee that the stock will rally. An oversold condition can be corrected by a sideways move.
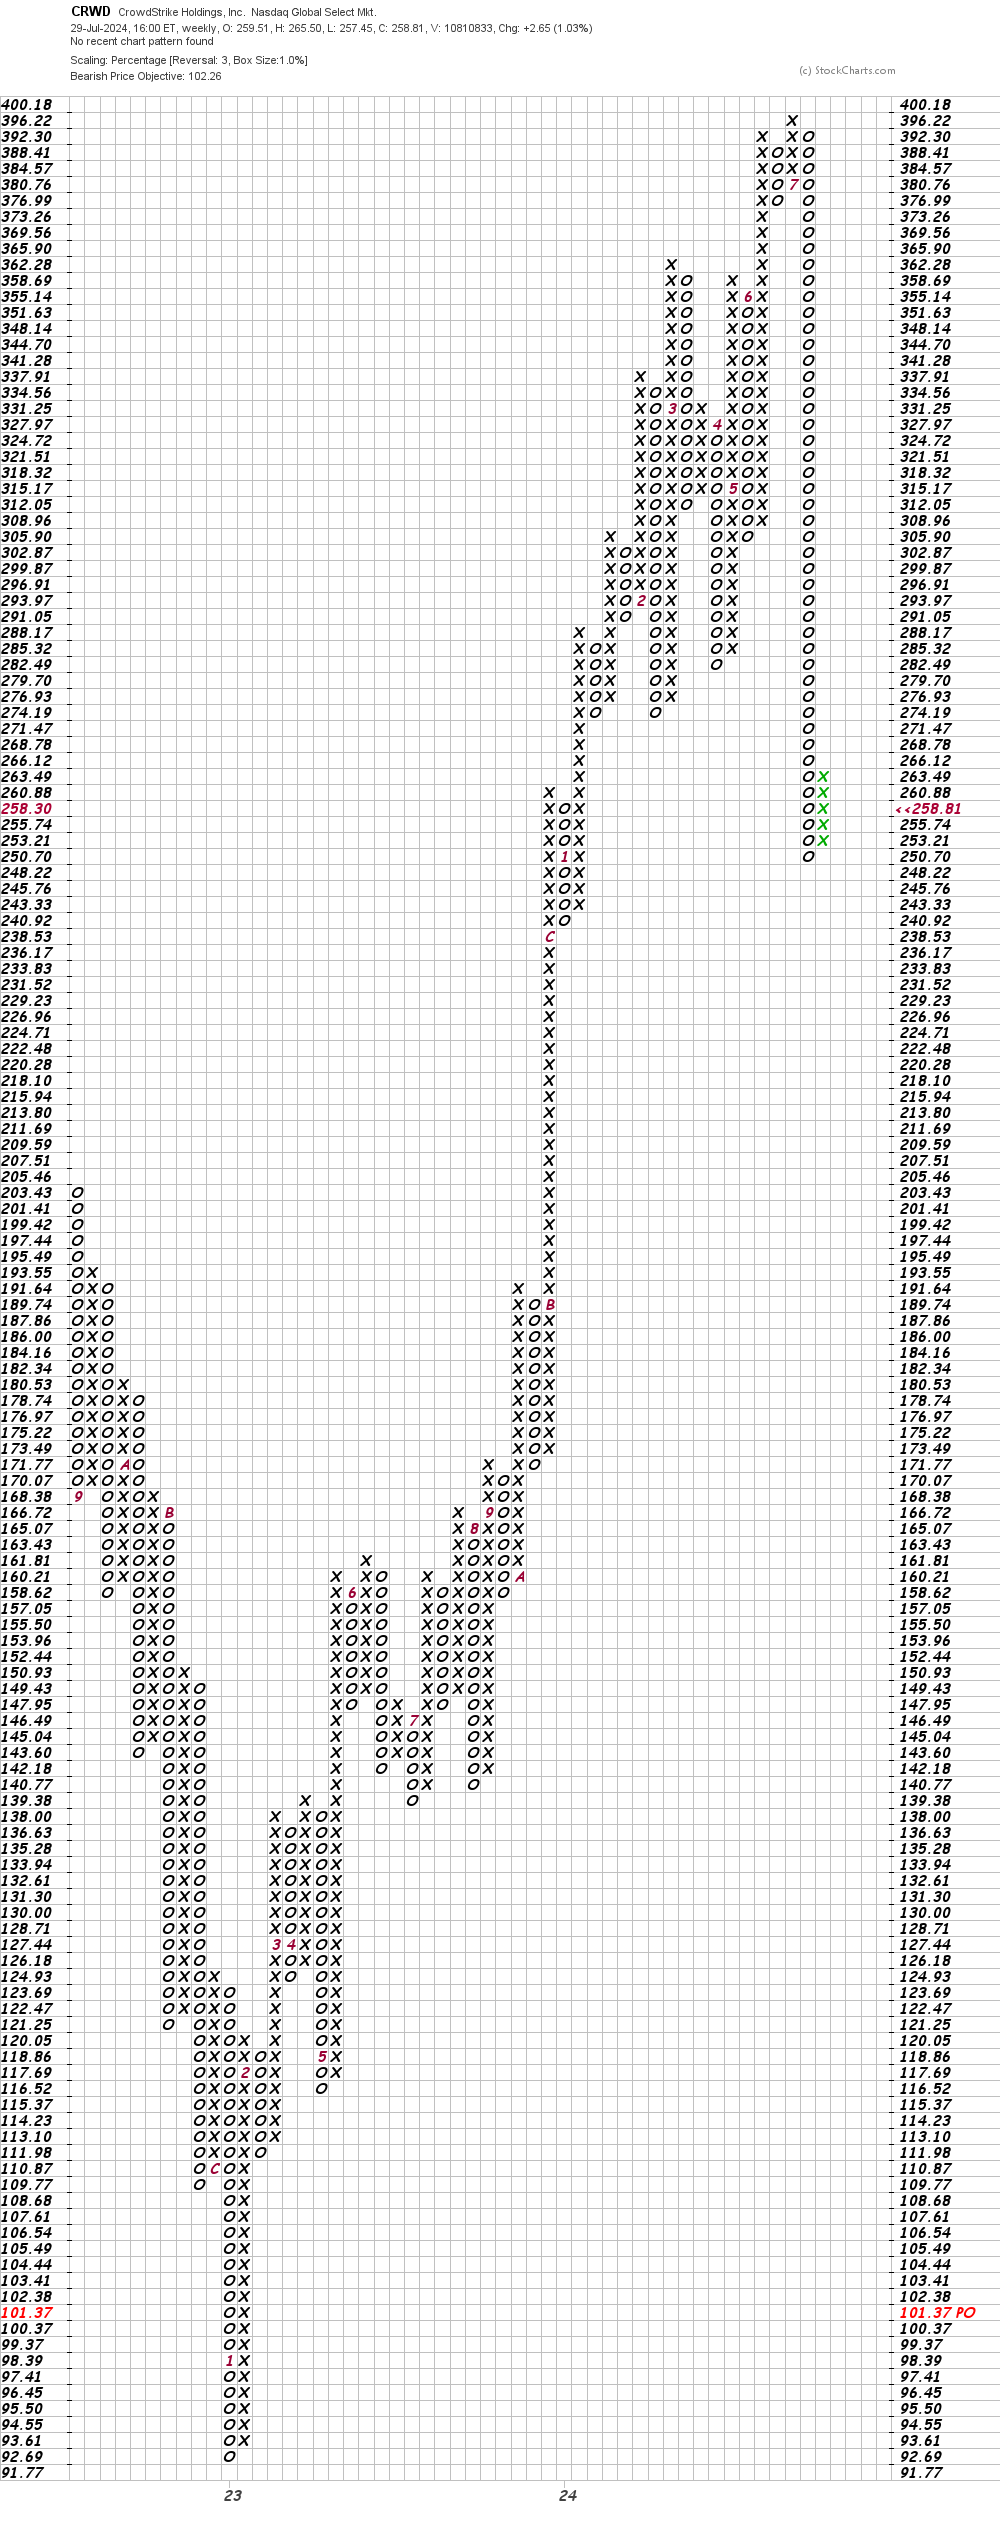
In this weekly Point and Figure chart of CRWD, below, the software is suggesting a downside price target in the $102. It sounds a bit extreme but that is what the Xs and O's measure to.
Bottom line strategy: Traders who followed our various recommendations on CRWD should have been stopped out at $360. I am still comfortable sitting on the sidelines.
Employees of TheStreet are prohibited from trading individual securities.