Honeywell's Charts Look Sticky to the Upside
Here are the prices to watch as this industrial goods giant climbs higher.
You've reached your free article limit
You've read 0 of 1 free Pro articles.
Honeywell International HON is an industrial goods and machinery company and its charts look ready to trade higher.
Let's check it out.
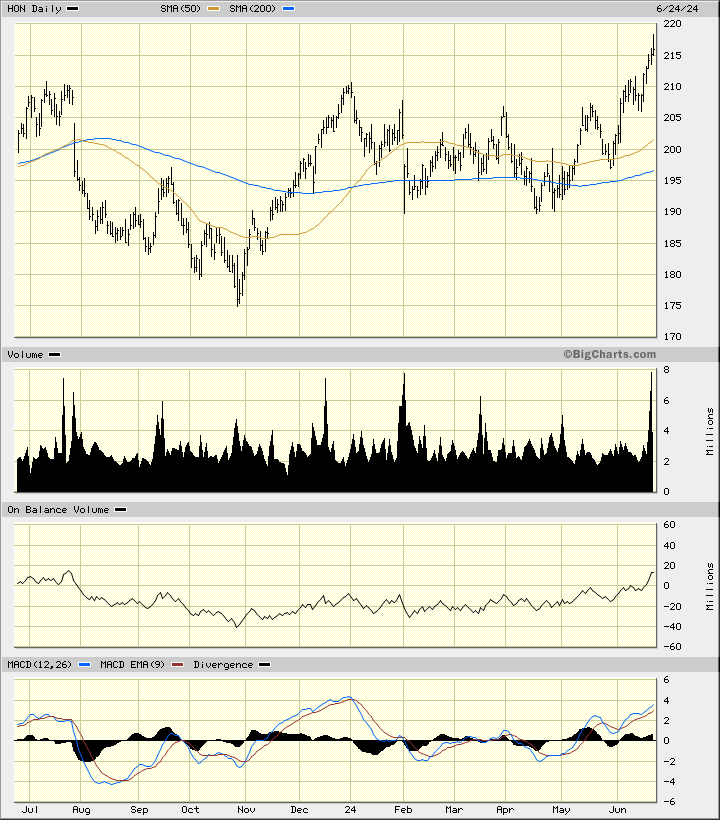
In this daily bar chart of HON, below, I can see that prices have clearly broken out to new highs, clearing resistance in the $210 area. Prices are trading firmly above the rising 50-day moving average line and above the rising 200-day line.
The trading volume has surged higher to confirm the upside breakout. The On-Balance-Volume (OBV) line has moved up to a new high and the Moving Average Convergence Divergence (MACD) oscillator is in a bullish alignment above the zero-line.
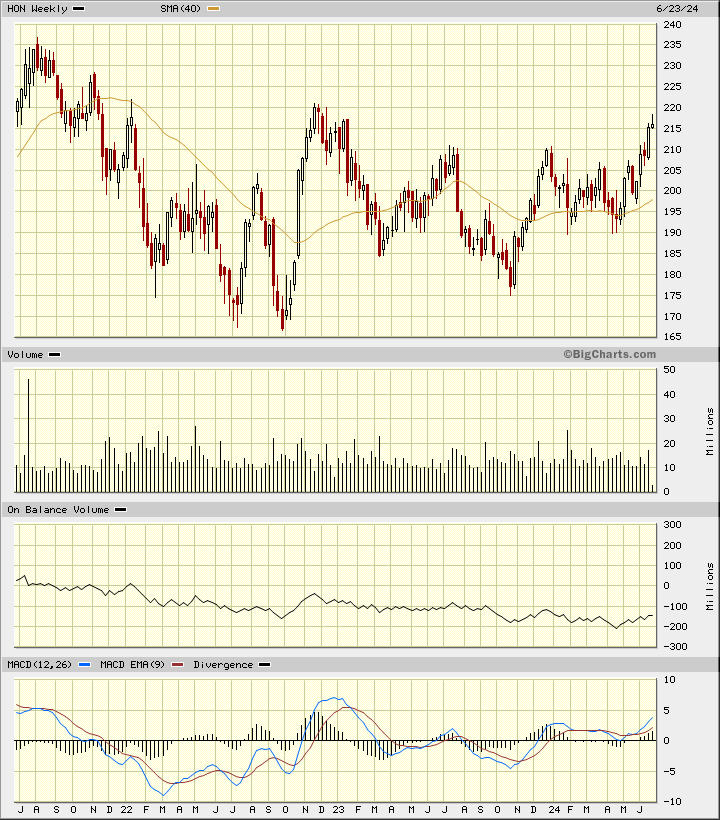
In this weekly Japanese candlestick chart of HON, below, I see a large base formation. Prices trade above the rising 40-week moving average line. A weekly close above $220 is an important breakout. The most recent candlestick bar has an upper shadow telling us that traders rejected the highs. A strong (white) candle this week will refresh the uptrend. Prices trade above the rising 40-week moving average line. The weekly OBV line is starting to improve. The MACD oscillator is above the zero-line and rising.
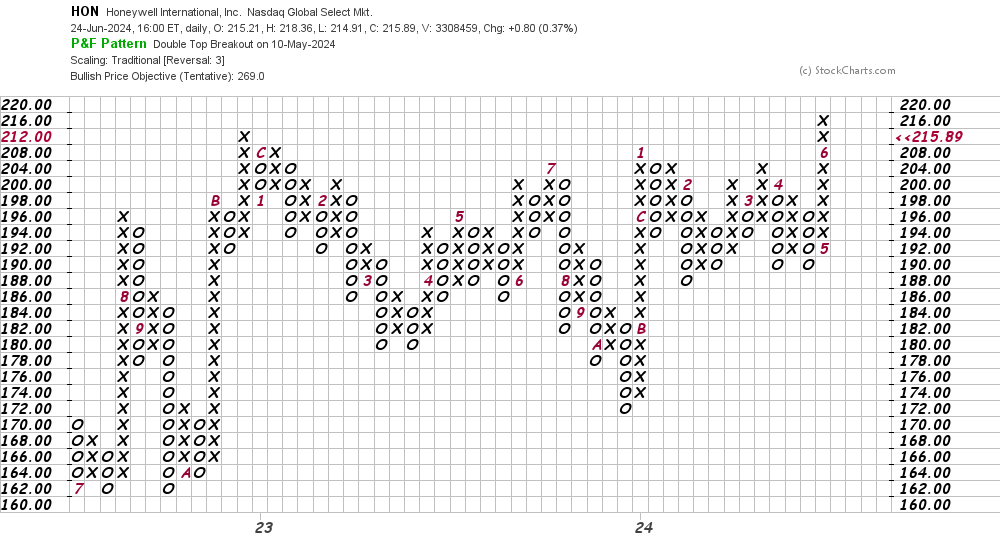
In this daily Point and Figure chart of HON, below, I can see that prices made an upside breakout. A price target in the $269 area is being projected.
In this weekly Point and Figure chart of HON, below, I can see a price target in the $265 area.
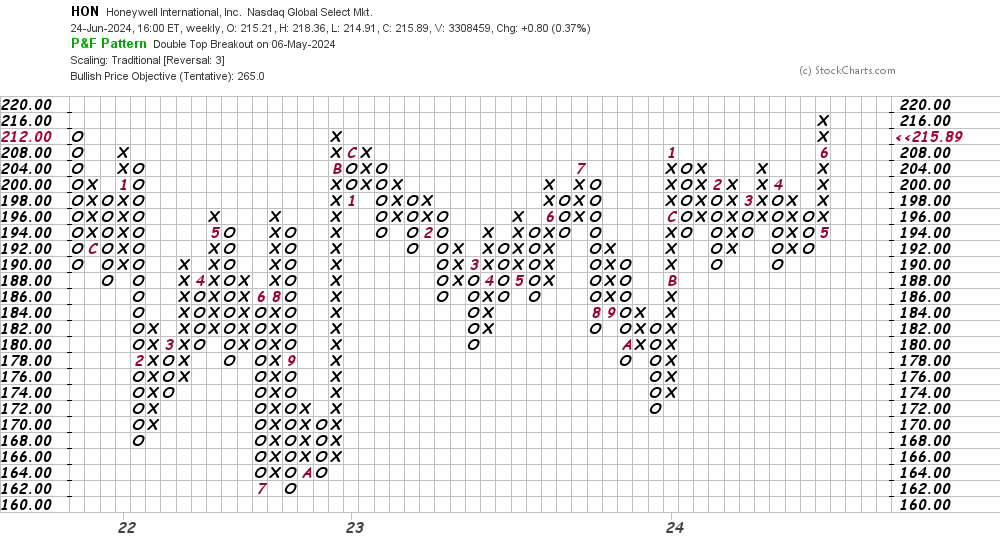
Bottom line strategy: Traders could go long HON at current levels and on a shallow dip. Risk to $205. The $265 area is my price target for now.
Employees of TheStreet are prohibited from trading individual securities.