Home Depot's Salad Days of Growth Are Over —And That's a Problem for Investors
Going out into the medium to long-term future, the balance sheet is quite sloppy and will have to be managed much more seriously than it has been.
You've reached your free article limit
You've read 0 of 1 free Pro articles.
They were once one of my longest held and largest long positions. That was a long time ago. I have done little more than trade the stock short-term for the past couple of years. Still, Home Depot HD is a name that I have always watched closely and quite honestly, rooted for. I have always enjoyed shopping there and even moonlighted at my local Home Depot back during the post-Great Financial Crisis when the economy was in shambles.
That's a story for another day that we won't go into today, but there were a couple of years there, after Main Street supposedly bailed out Wall Street, that most everyone on Wall Street was working multiple jobs just trying to keep their families in the middle class. That's not a complaint. The entire country went through it. I just always resented the politically convenient public perception that Wall Street was somehow immune.
On Tuesday morning, the Home Depot released the firm's first fiscal quarter financial results. For the three-month period ended April 28th, Home Depot posted a GAAP EPS of $3.63 on revenue of $36.418B. The top line print showed a contraction of 2.3% year over year and fell short of expectations by a small amount as the bottom-line number did beat Wall Street.
Firm wide comparable sales decreased 2.8% from the year ago comp, while comp sales decreased by 3.2% in the US. Wall Street had been expecting a firm-wide contraction of 2.2%. Overall, customer transactions were down 1% as the average ticket decreased 1.3% and sales per square foot decreased 3.4%.
The CEO
In the second paragraph of the press release, Chair, president and CEO Ted Decker dropped this bomb:
"The team executed at a high level in the quarter and we continued to grow market share, and while the quarter was impacted by a delayed start to spring and continued softness in certain larger discretionary projects, we feel great about our store readiness, our product assortment in stores and online and our associate engagement."
Whatever could have delayed the start to the firm's important spring season? Cold wet weather? Sure. I've been on Long Island since March. We're still struggling to see high temperatures above 50 degrees Fahrenheit on a regular basis. I would say that the warm weather is about three weeks to a month behind in this neck of the woods. That said, I see folks wearing tee-shirts on the news every night, so this late spring is not everywhere. Could it be that higher interest rates are indeed slowing down consumer demand for large, costly home improvement projects? Probably.
Operations
As revenue was contracting 2.3% to $36.418B, the cost of those sales contracted 2.9% to $23.985B. This left a gross profit of $12.433B (-1%), as gross margin improved from 33.7% to 34.1%. Total operating expenses increased 5% to $7.354B, which dropped operating income to $5.079B (-8.5%) as operating margin sunk to 14% from 14.9%.
After accounting for interest, taxes, net income dropped 7% to $3.6B. This works out, once diluted to a GAAP EPS of $3.63, down from $3.82 for the same period one year ago.
Guidance
Home Depot reaffirmed fiscal full year guidance, which will include 53 weeks of results. The guidance also does not include the still pending acquisition of SRS Distribution. The firm sees sales growth of 1% (53 weeks) compared to a sales contraction of 1% (52 weeks).
Home Depot sees gross margin of roughly 33.9%, and diluted EPS growth of about 1%. The 53rd week is expected to contribute approximately $0.30 to full year diluted EPS.
Fundamentals
For the quarter reported, Home Depot generated operating cash flow of $5.497B, out of which came capex spending of $847M. This left free cash flow of $4.65B. That was roughly in line with Q1 2023. Out of that number the firm repurchased $649M worth of common stock for its treasury and paid out $2.229B in cash dividends to shareholders. The balance moved to the balance sheet.
Looking at the balance sheet, we see a cash position of $4.264B, which is up more than three-fold over twelve months and inventories of $22.371B (-11.6%). This puts current assets at $32.622B. Current liabilities add up to $24.359B, including a small amount of short-term debt ($763M). This left HD with a current ratio of 1.34, which passes muster. We do not ding retailers on quick ratios given the inventory reliant nature of the business. The firm's quick ratio for those who need to know, stands at 0.42.
Total assets amount to $79.23B, including just $8.464M in goodwill and no other intangibles. At less than 11% of total assets, this is not an issue. Total liabilities less equity comes to $77.41B, which does include long-term debt of $42.06B. This bothers me. It's not a "this month or even this year" problem, but going forward, a debt-load ten times the cash position will create problems.
The firm will likely have to eventually refinance debt that was originally borrowed at very low interest rates at rates that are not so very low. It does look like from one year to the next, the Home Depot has sharply curtailed the share repurchase program. That was smart, as the firm, even if growth is a thing of the past, still drives robust free cash flow.
That free cash flow will have to be diverted towards the balance sheet in the near future to unscrew this problematic longer-term outlook for Home Depot's balance sheet health. I would not say that the dividend is in imminent trouble, but $9 per share per year for a yield of 2.64% may be a bit much for a firm bearing a balance sheet where the debt-load sits like an 800-pound gorilla in the room.
My Thoughts
This is a good business, still capable of driving healthy cash flows. The salad days of growth appear to be over for now, at least in this environment. So far, we only have six (it's early) highly rated (four stars+ at TipRanks) sell-side analysts that have opined on Home Depot since this morning's release.
Right now, we have three "buy" or buy-equivalent ratings and three "hold" or hold-equivalent ratings. We only have three target prices, with an average of $376.67. I see the stock trading with a $339 handle, down fractionally on the day.
The balance sheet is in very good shape in the present. Going out into the medium to long-term future, the balance sheet is quite sloppy and will have to be managed much more seriously than it has been. This is problematic for HD investors or those thinking about being HD investors, If one is not especially hands-on in managing their portfolios.
I do not feel that one can put HD in their basket and forget about it. My feeling is that this stock is for those who watch their portfolios closely so if that future imbalanced balance sheet does start to impact the firm's business or share price, the risk can be competently managed.
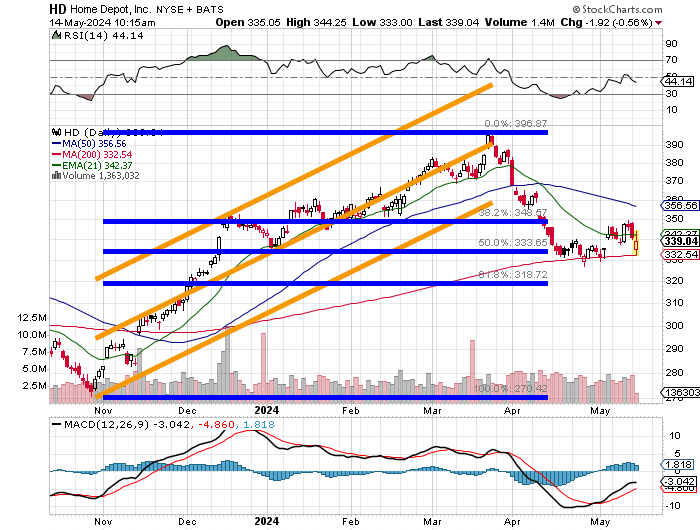
Readers will see that the late October through mid-March rally faltered and collapsed into April. It is there that we see support develop along the 200-day SMA (simple moving average), also close to the half-way back point. That thin red line has rescued HD many times over the past month and change including this morning. This is key.
Can the shares take back that 21-day EMA (exponential moving average)? The swing crowd is loving the action around that level.
That said, should HD lose the 200-day line, in my opinion, we could be talking about sub $300 prices. Relative strength is okay. The daily MACD (moving average convergence divergence) is definitely looking better than it had in weeks. Still, I don't think I could buy these shares for a trade, until they take and hold the 21-day line surviving at least one retest. The target would then be the 50-day SMA, which is not really that much of a move. Again, the risk right now is at the 200-day SMA, currently $332.
This morning, a $330 / $320 July 19th bear put spread will cost the bearish trader a net debit of $2.45. Not sure if it's worth the outlay. Might just be better off selling the July 19th puts for about $1.15 and buying the $285 puts for about $0.50 just so the trader does not lose his or her shirt in case those levels are indeed reached.
At the time of publication, Stephen Guilfoyle had no position in the securities mentioned.
