Home Depot Gets a Fundamental 'Buy' But Do the Charts Agree?
Share prices rallied sharply from late October into December and then the trend has shifted to a more gradual rise.
You've reached your free article limit
You've read 0 of 1 free Pro articles.
The Home Depot HD was rated a new fundamental "buy" at Mizuho Securities Tuesday with a $415 price target. Okay, but let's review the condition of the charts and indicators before potentially entering a buy order.
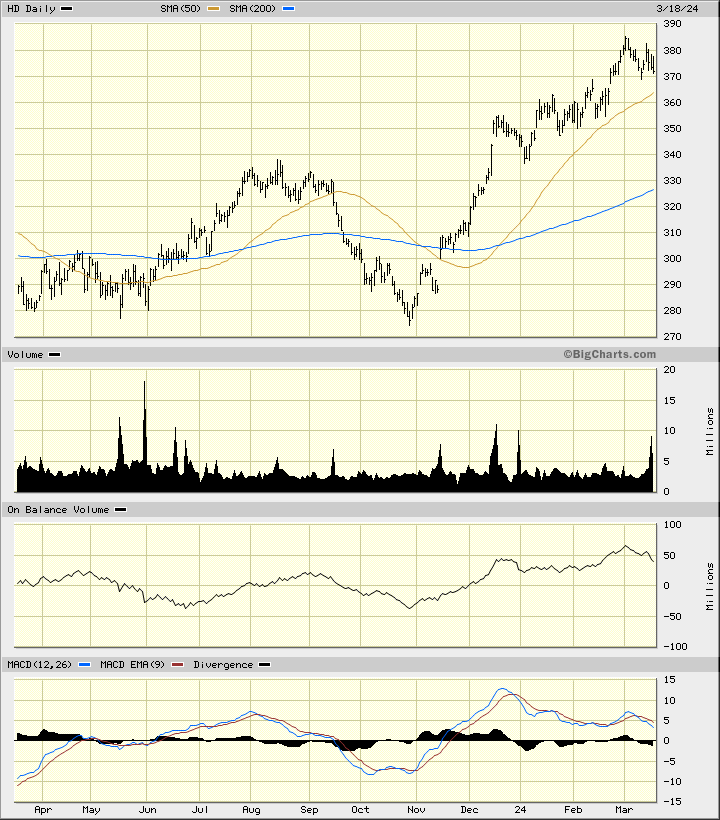
In the daily bar chart of HD, below, I can see that share prices rallied sharply from late October into December and then the trend has shifted to a more gradual rise. Then shares are still above the rising 50-day moving average line but closer than they were in December. HD also trades above the rising 200-day line but I would consider the stock extended on the upside when compared to the 200-day average.
The On-Balance-Volume (OBV) line has moved up since late October but it has weakened in March. The trend-following Moving Average Convergence Divergence (MACD) oscillator has been correcting lower since December and tells me that the trend-strength is weakening.
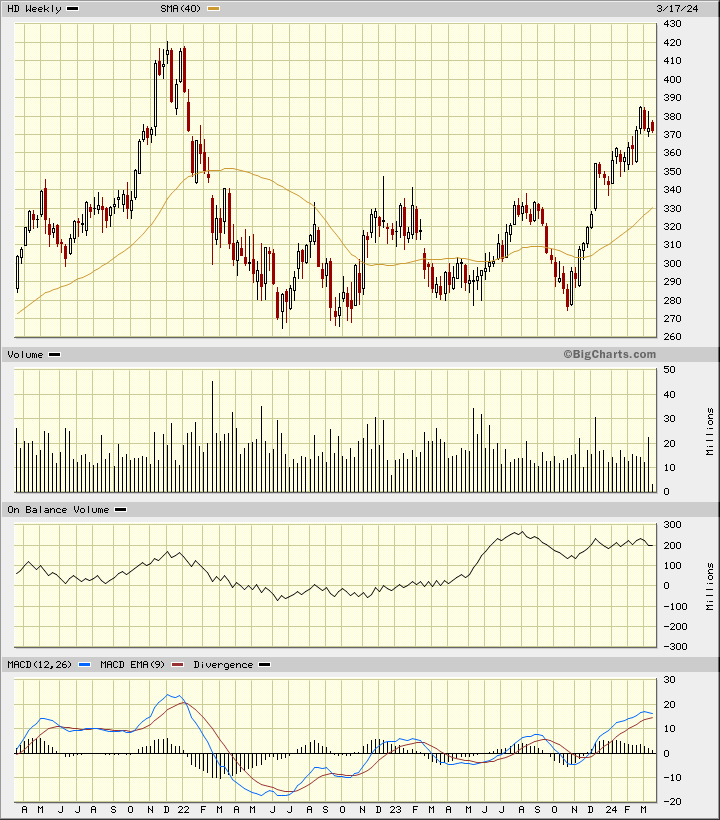
In the weekly Japanese candlestick chart of HD, below, I can see that the recent candles suggest a top reversal.
The weekly OBV line has been weakening since September and the MACD oscillator has been narrowing in recent weeks telling me that the strength of the advance is weakening.
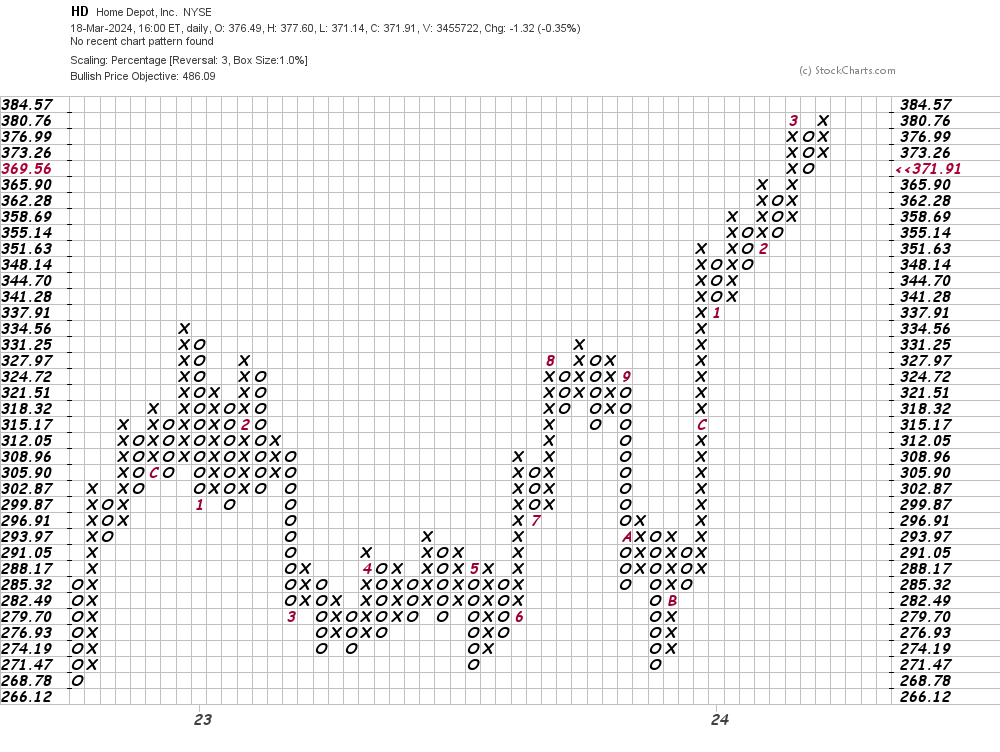
In this daily Point and Figure chart of HD, below, I can see a potential price target in the $486 area. A trade at $365.90 or lower may start to weaken this picture.
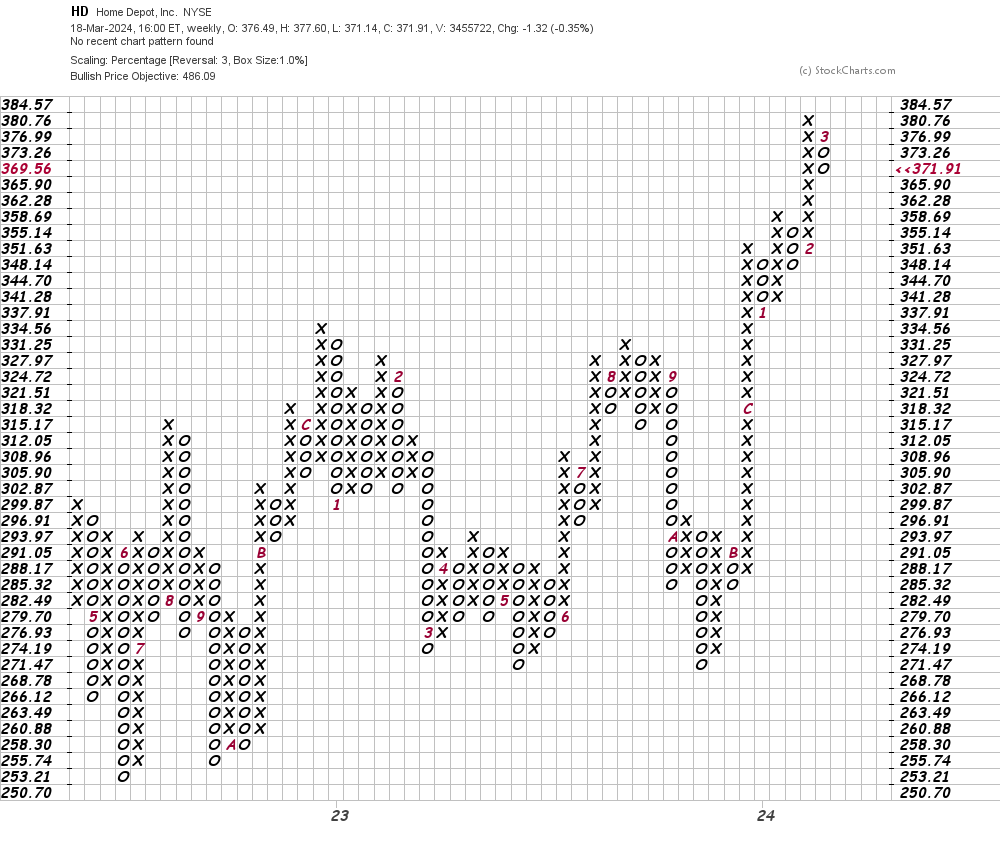
In this weekly Point and Figure chart of HD, below, I can see the same $486 price target.
Bottom-line strategy: Regular readers of my technical commentaries know that I listen to the fundamentals but I don't always agree with them. In the case of HD I would take a cautious approach to any new purchases. Existing longs should raise stop protection to $359.
Employees of TheStreet are prohibited from trading individual securities.