Here's How Traders Can Approach The Trade Desk
Let's go over the charts as Jefferies raises their price target.
You've reached your free article limit
You've read 0 of 1 free Pro articles.
Shares of The Trade Desk TTD were raised to a fundamental buy recommendation Thursday at Jefferies with a $105 price target. Trade Desk is a technology platform for advertisers to purchase and manage digital ad campaigns.
Let's check out the position of the charts and the condition of the indicators.
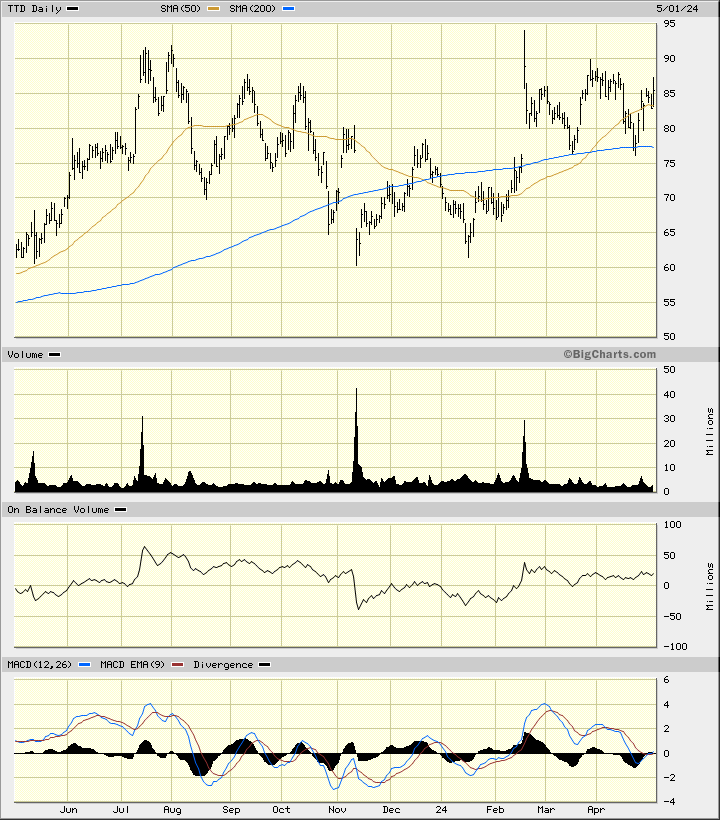
In this daily bar chart of TTD, below, I can see that prices have formed a large and potential saucer bottom pattern. A strong and sustained breakout over $90+ is needed to confirm this pattern. Prices trade above the 50-day moving average line and above the 200-day moving average line. Trading volume looks more active since November which fits in with the typical movement of saucers.
The On-Balance-Volume (OBV) line shows improvement since January. The Moving Average Convergence Divergence (MACD) oscillator has been fluctuating around the zero line the past year.
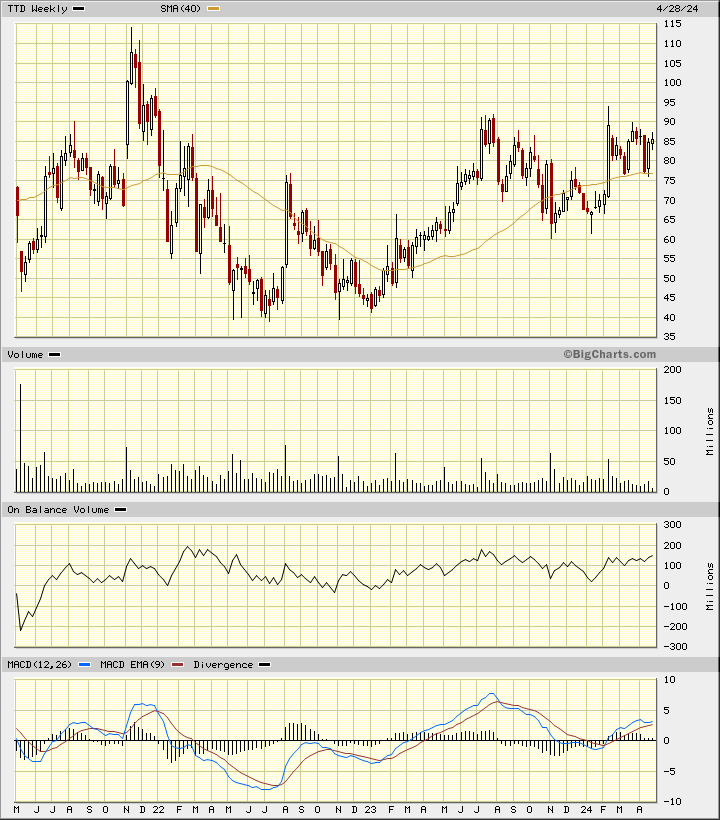
In this weekly Japanese candlestick chart of TTD, below, I can see a much larger potential bottom pattern. Prices trade above the rising 40-week moving average line. The OBV line has been slowly improving since the fourth quarter of 2022. The MACD oscillator is above the zero line but has narrowed in recent weeks.
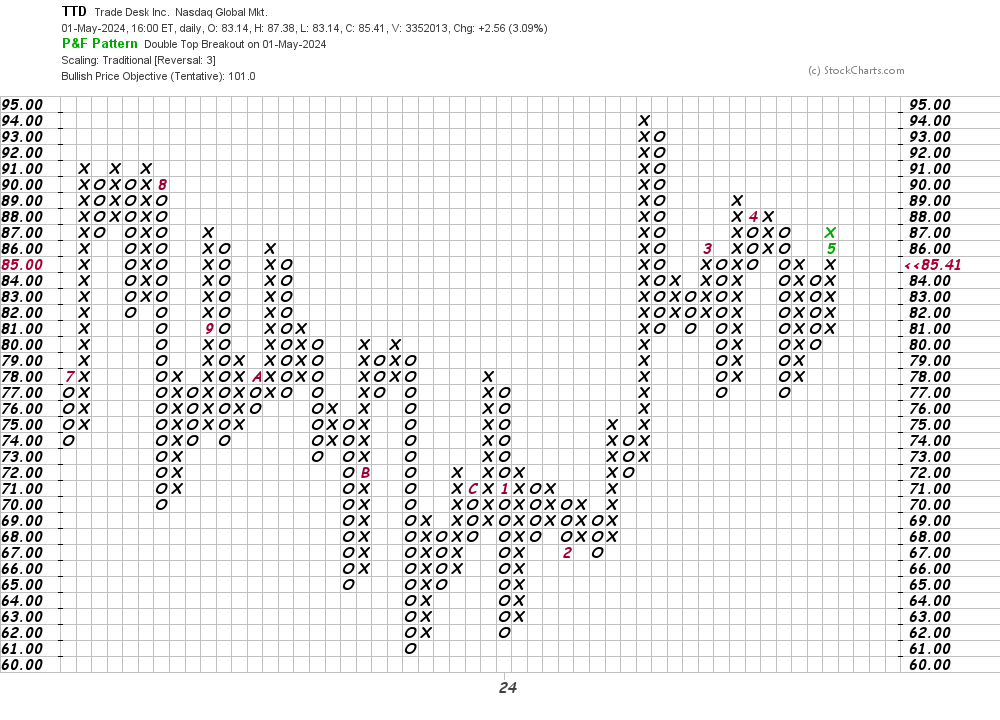
In this daily Point and Figure chart of TTD, below, I can see an upside price target in the $101 area.
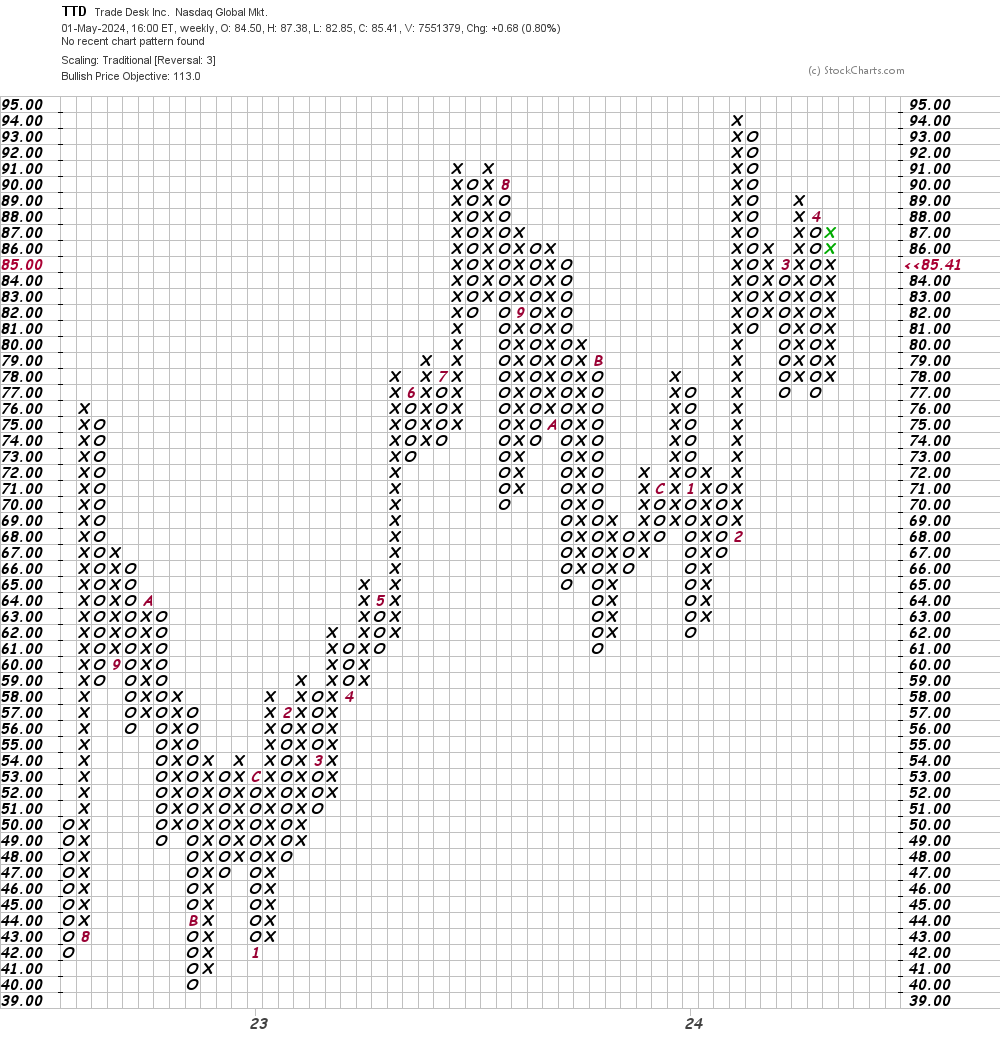
In this weekly Point and Figure chart of TTD, below, I can see a price target in the $113 area.
Bottom line strategy: Traders could go long TTD on strength above $90 and above $95. Risk to $80 for now. The $113 area is my price target for now.
Employees of TheStreet are prohibited from trading individual securities.