Gold Is Trading at All-Time Highs. Here's Why It Can Go Higher.
Let's connect the dots between the yellow metal, the U.S. dollar, and interest rates.
You've reached your free article limit
You've read 0 of 1 free Pro articles.
After four months of consolidation, the price of gold is on the move again. Gold reached an all time high of $2,531 last week, and is on the verge of breaking that record high.
Why is gold breaking out? This time, the culprit is the U.S. dollar.
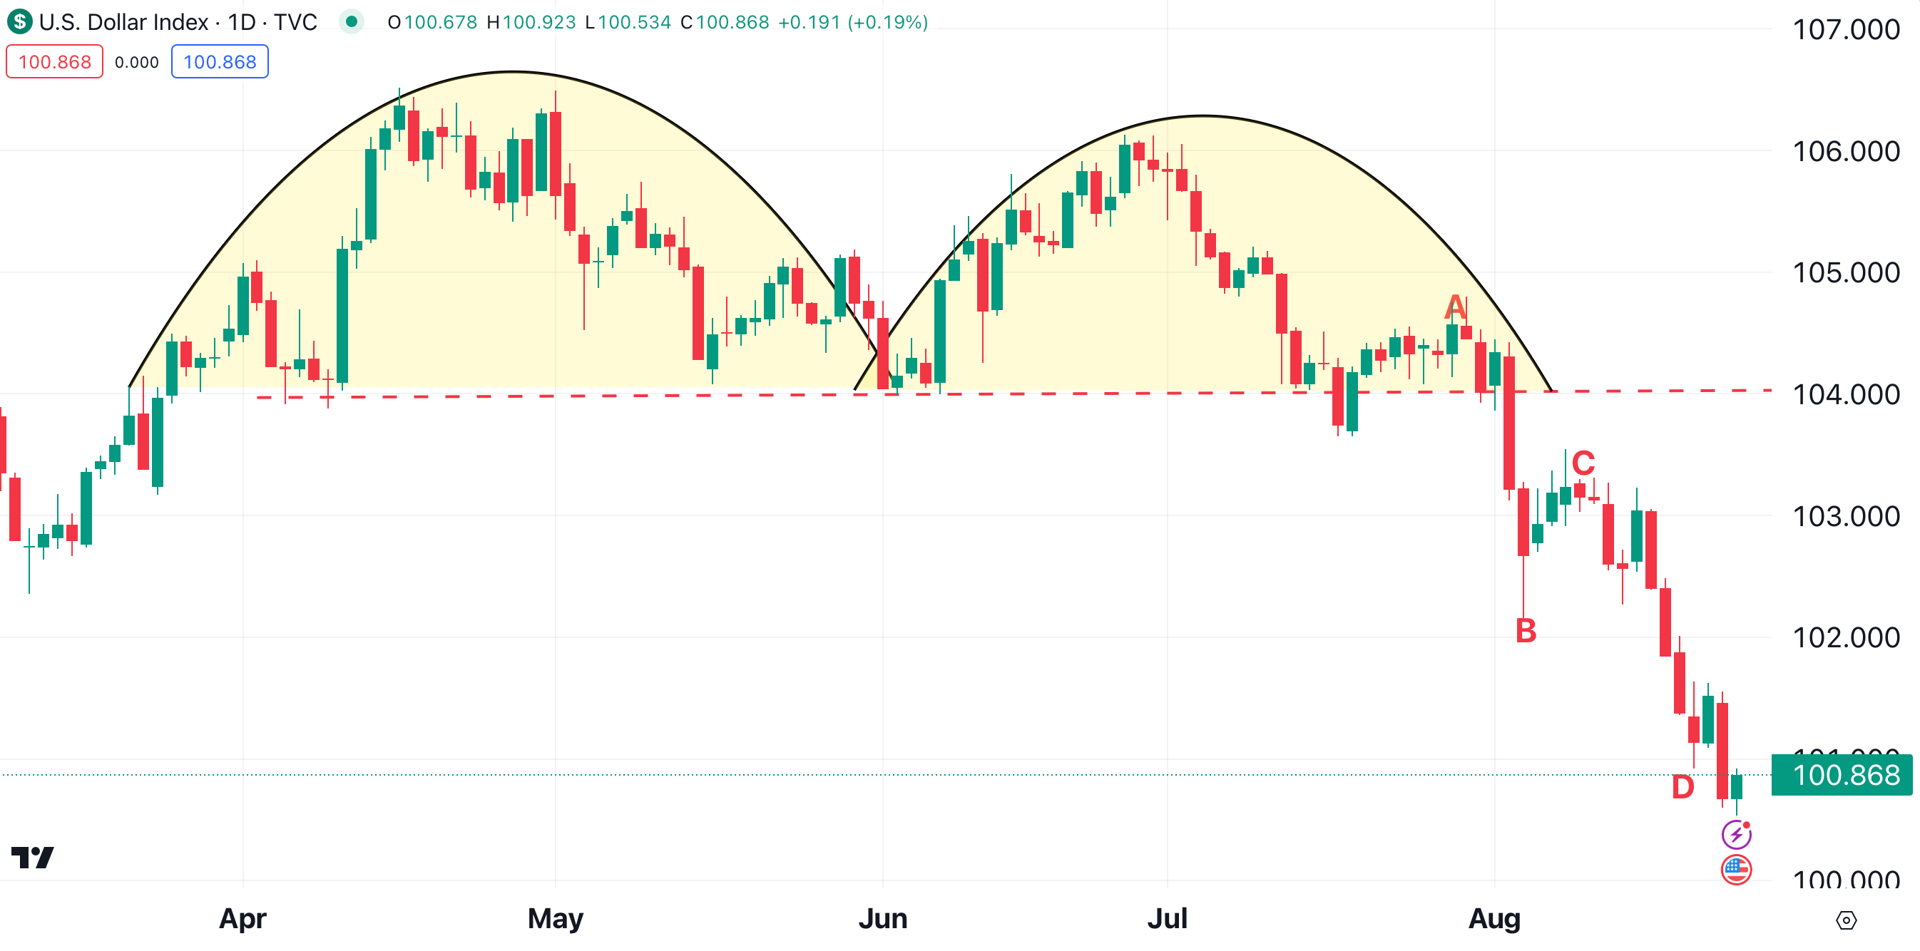
The greenback formed a double top pattern in late spring/early summer (shaded yellow). When the U.S. Dollar Index broke downward from the bearish pattern, it formed a classic A-B-C-D pattern (red letters).
Could the U.S. Dollar Index continue to lose ground? If we look at the dollar’s weekly chart, a clear pattern has formed over the past two years. That bearish pattern, known as a descending triangle (red lines), suggests a weaker dollar in the future.
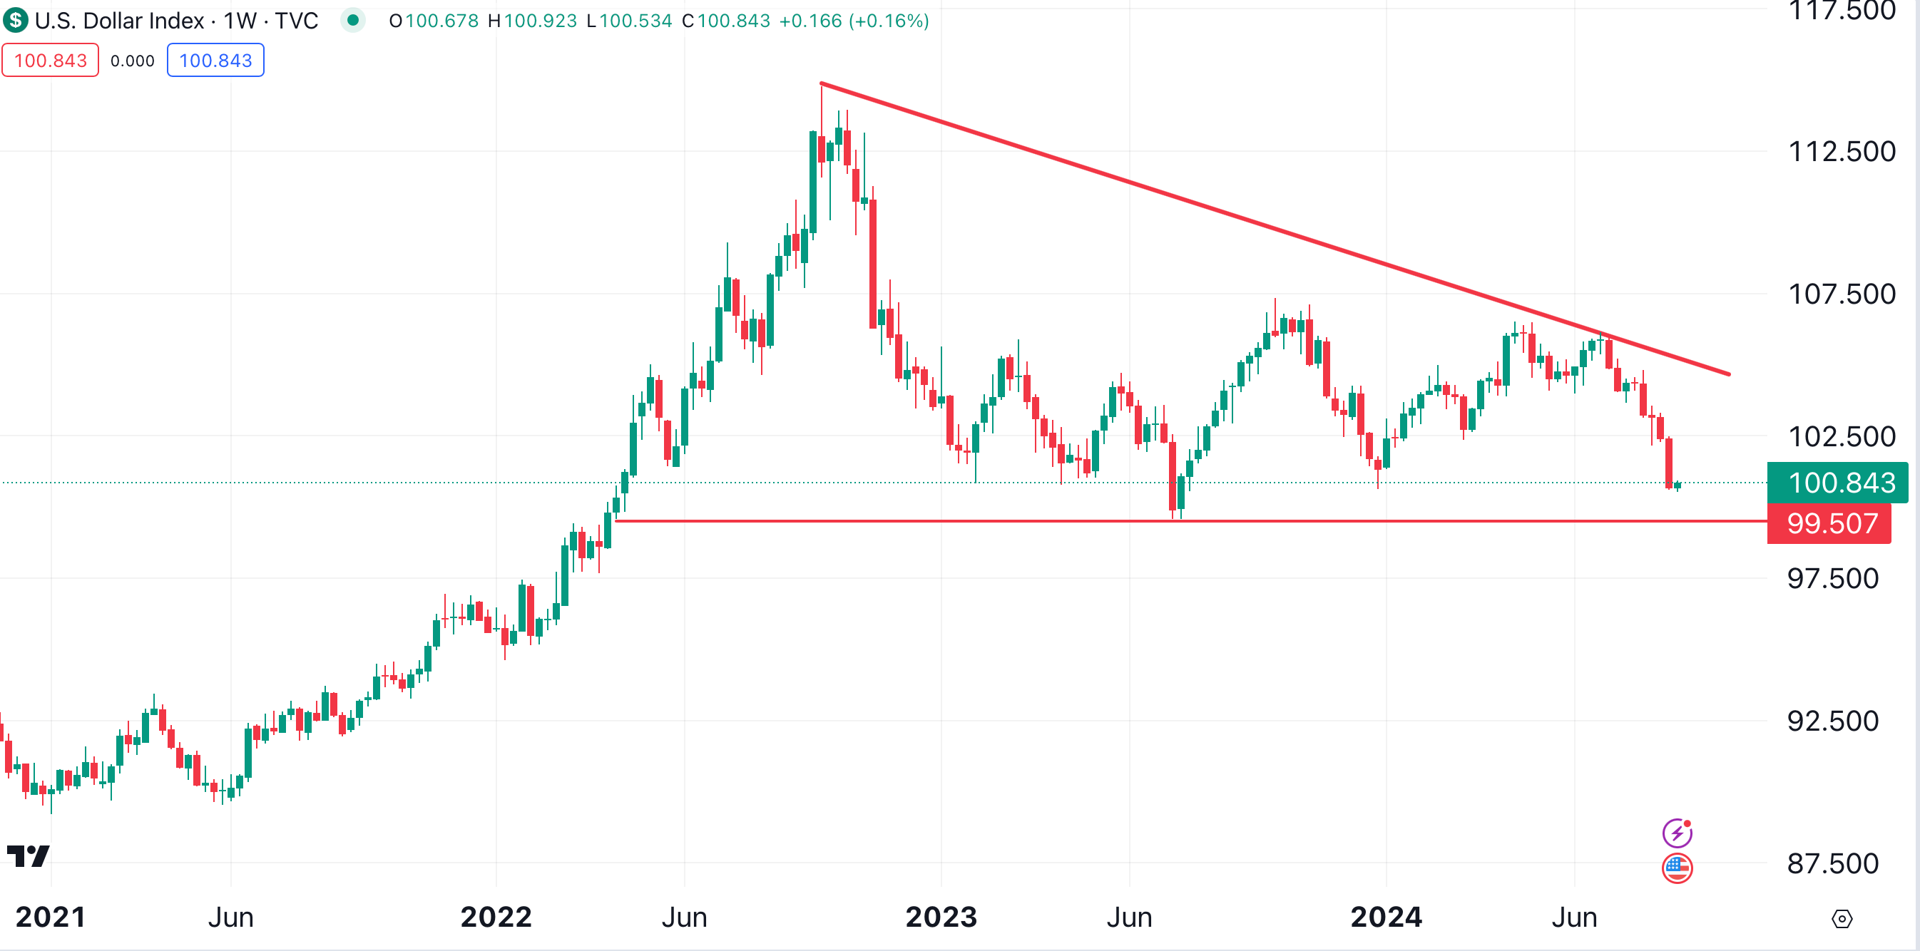
Why does the above chart matter? If the dollar continues to fall, gold will catch a tailwind. That's because a falling dollar places upward pressure on commodities that are valued in dollars.
Why is the dollar falling? Because U.S. interest rates are about to decline.
At last week’s conference in Jackson Hole, Fed Chair Jerome Powell made his intentions clear:
"The time has come for policy to adjust”, said Powell. “The direction of travel is clear, and the timing and pace of rate cuts will depend on incoming data, the evolving outlook, and the balance of risks."
Why would rate cuts result in a weaker dollar?
Currencies rise and fall due to many factors, but one of the most important is capital flows. The flow of capital entering or leaving a country is one of the biggest fundamental factors influencing the currency market — and the U.S. dollar is a key component of that market.
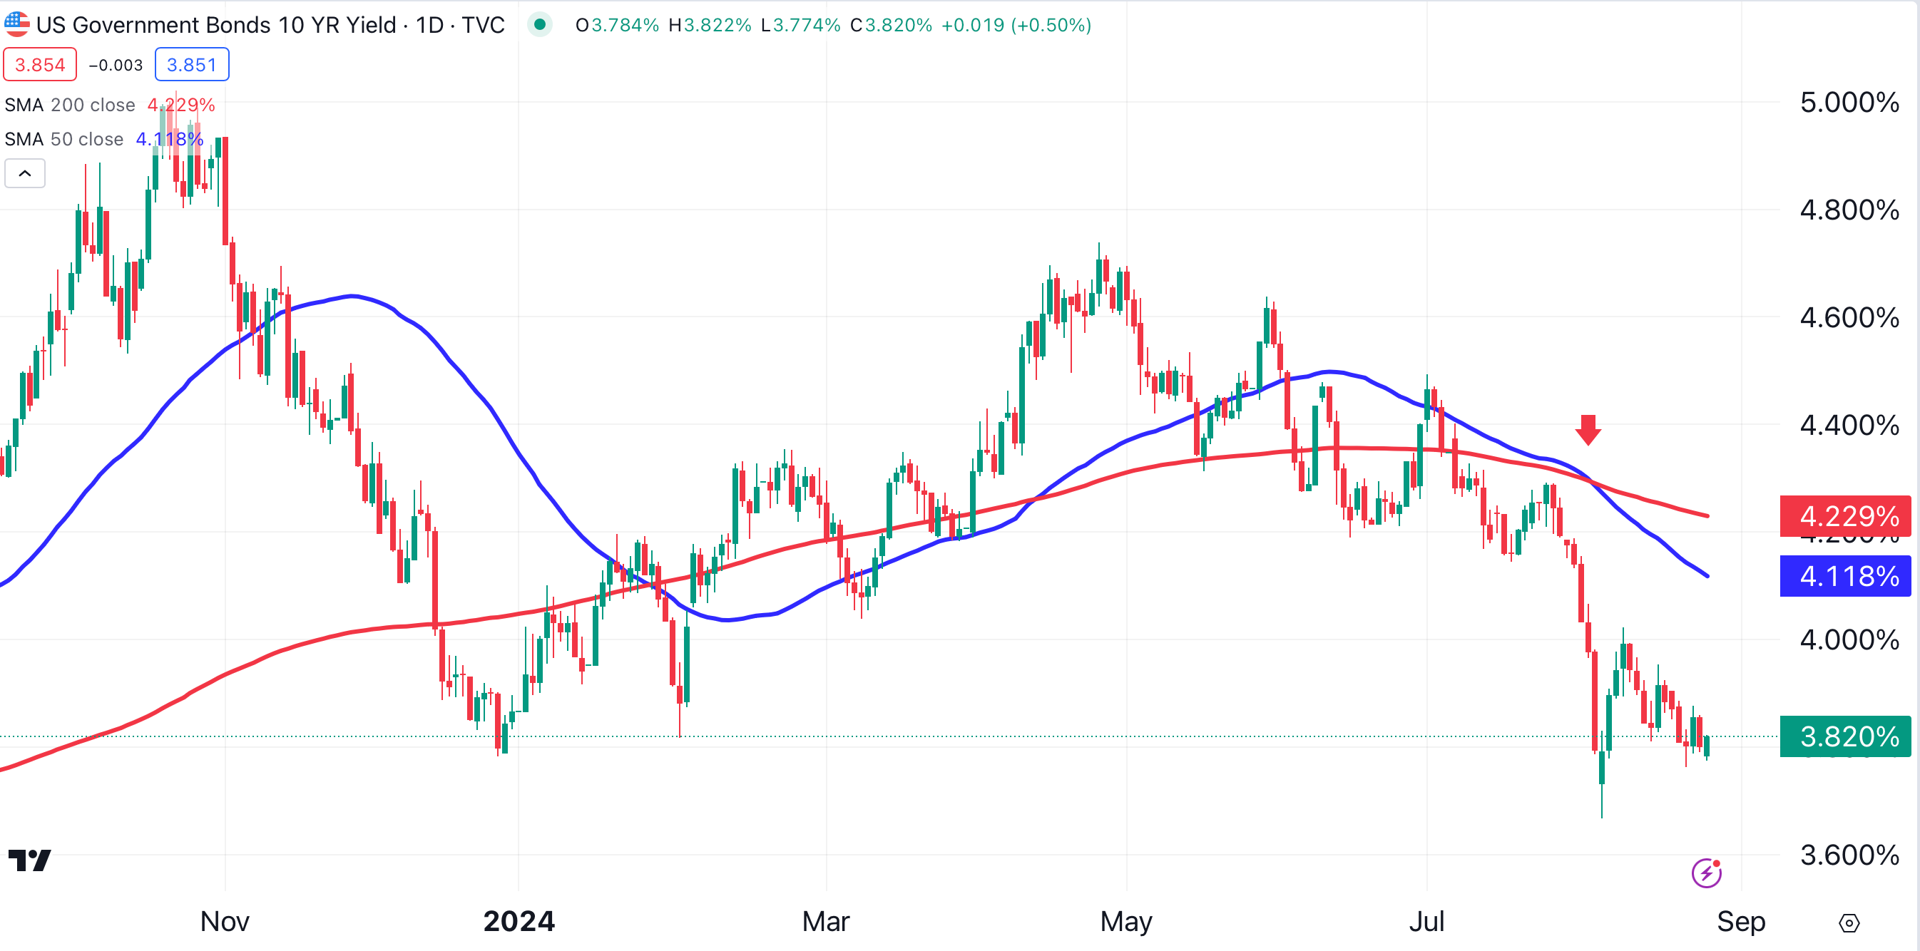
We’ve already seen a dramatic slide in the yield of the 10-year U.S. Treasury note. In April, that yield climbed as high as 4.73%. On Monday, the 10-year’s yield touched 3.77% — a decline of nearly 100 basis points.
The 10-year’s yield has dropped below its 50-day (blue) and 200-day (red) moving averages. Those two moving averages are falling. When they crossed, the result was a so-called death cross (red arrow). This bearish momentum indicator suggests that the 10-year’s yield has further room to fall.
When U.S. rates are high relative to other developed countries, money is attracted from overseas. The resulting capital flow from Europe, Japan, and elsewhere strengthens the greenback.
When U.S. interest rates decline, moving money from overseas to the U.S. becomes a less attractive proposition. Capital remains outside the U.S., because the narrowing interest rate differential lessens the advantage of moving that capital.
As the flow of capital into the U.S. starts to wane, the dollar begins to fall. As the dollar falls, gold and other dollar-based commodities catch a tailwind. With gold already trading near its all-time high, this bullish scenario for gold should continue to unfold.
At the time of publication, Ponsi was long gold.
