DraftKings Looks Like a Losing Bet
Shares of sports betting company appear set to correct to the downside.
You've reached your free article limit
You've read 0 of 1 free Pro articles.
Wagering site DraftKings DKNG is trading lower Tuesday morning in reaction to tax legislation in Illinois. The Illinois Senate passed a bill that that would hike taxes on sports betting.
Let's check out the charts and indicators.
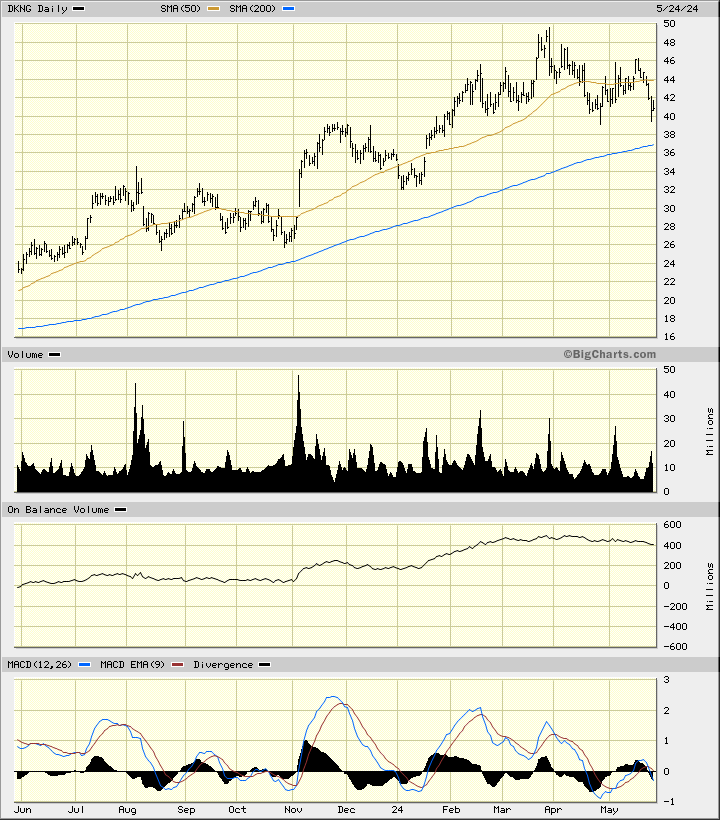
In this daily bar chart of DKNG, below, I can see that the shares turned lower in late March. DKNG is trading below the declining 50-day moving average line. The slower-to-react 200-day moving average line intersects around $37 and could soon be tested or even broken in the days ahead.
The On-Balance-Volume (OBV) line has been on a downward path the past two months telling me that sellers of DKNG have been more aggressive than buyers. The Moving Average Convergence Divergence (MACD) oscillator is below the zero line.
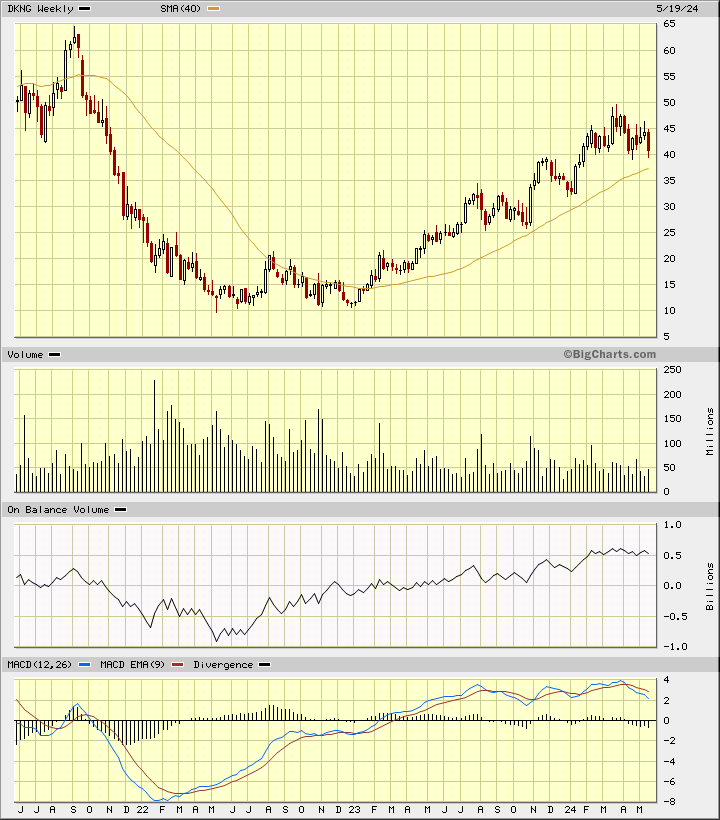
In this weekly Japanese candlestick chart of DKNG, below, I see a mixed picture. The shares have rallied over the past two years but that advance is looking tired. DKNG trades above the rising 40-week moving average line but that line could be tested in the days ahead.
The trading volume histogram shows a pattern of declining volume the past two years. The weekly OBV line has been stalled the past three months or so. The MACD oscillator has crossed to the downside and is a correction.
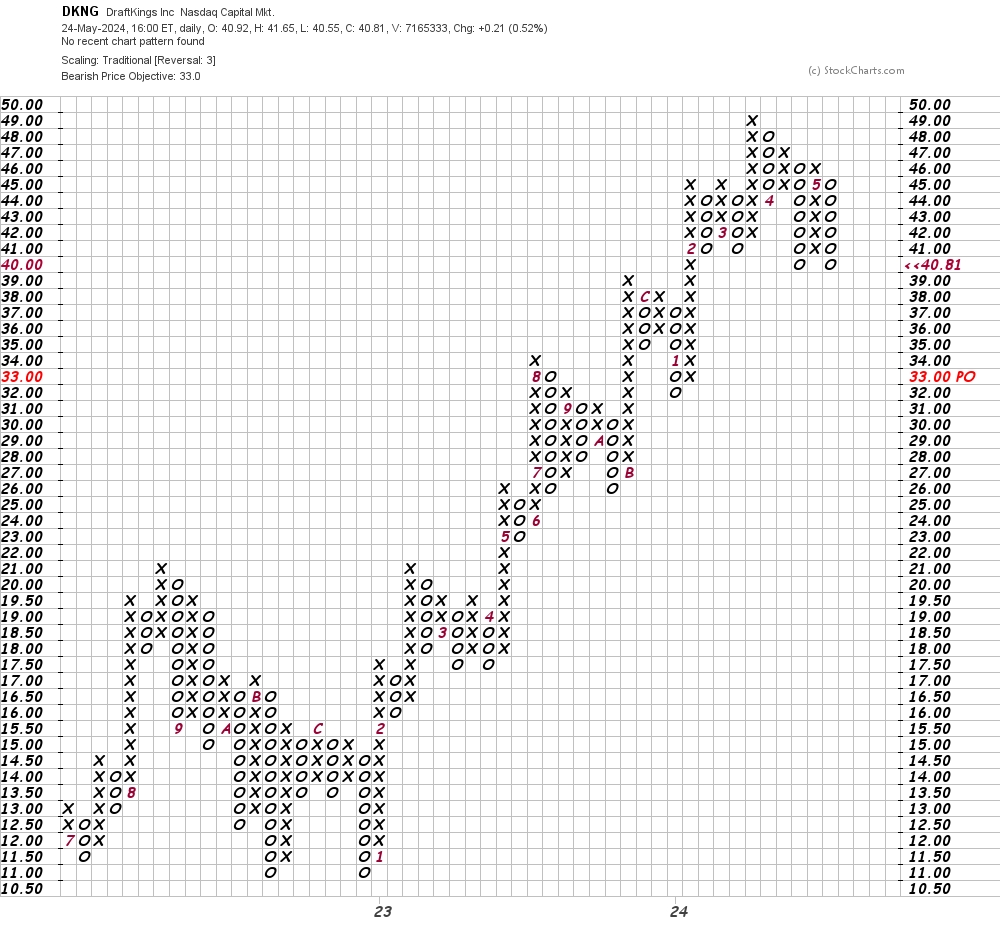
In this daily Point and Figure chart of DKNG, below, I can see a downside price target in the $33 area.
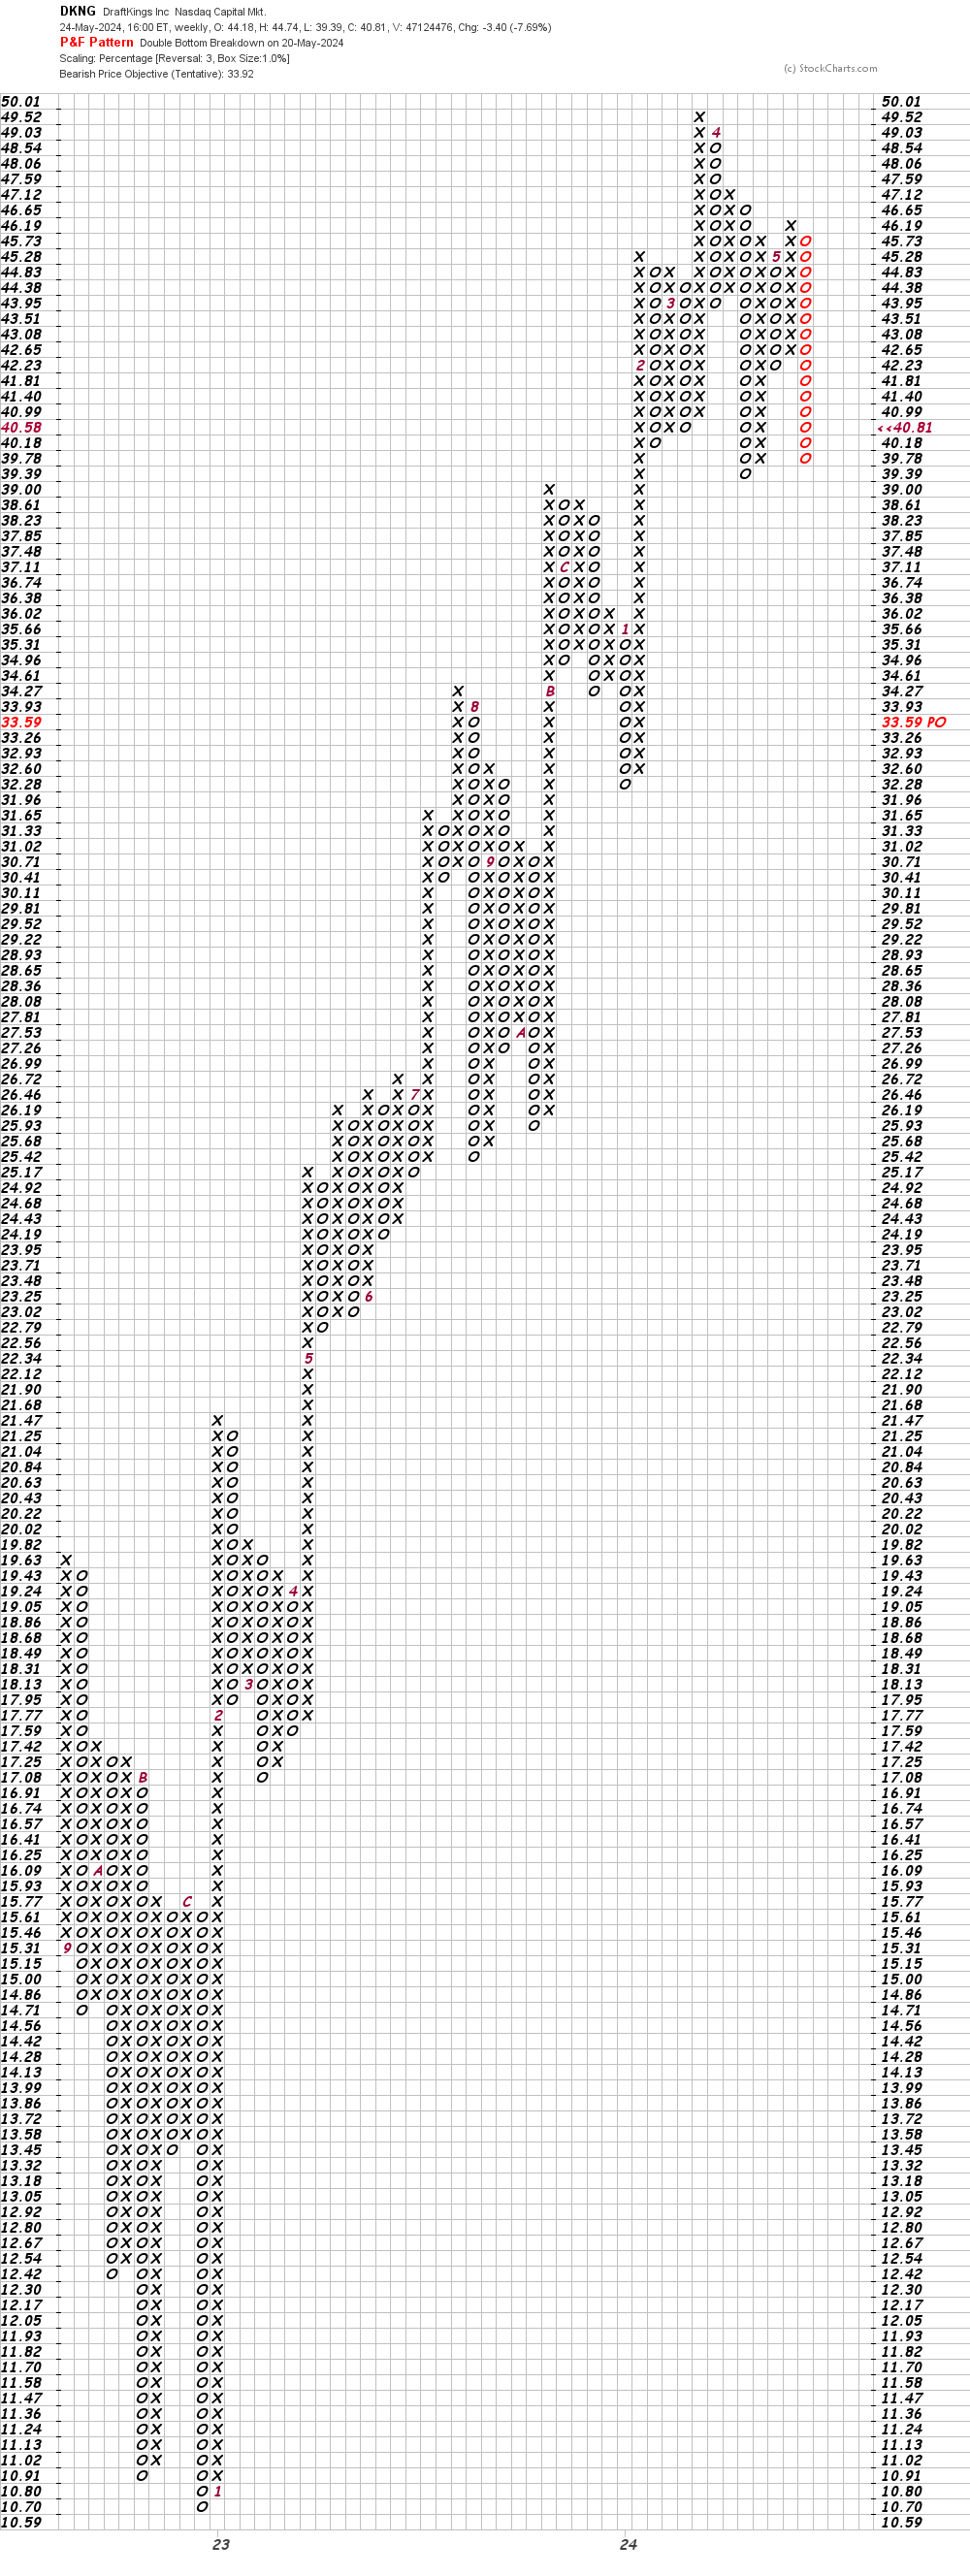
In this weekly Point and Figure chart of DKNG, below, I can see a price target in the $34 area.
Bottom-line strategy: It looks like DKNG is going to correct to the downside. Sometimes corrections are shallow and short-lived and sometimes they extend for longer and deeper. Traders should be prepared for a correction and take appropriate action (selling, buying puts, writing calls).
Employees of TheStreet are prohibited from trading individual securities.