Don't Hang Up on AT&T Just Yet
News of a major hack may not derail this telecom's rally.
You've reached your free article limit
You've read 0 of 1 free Pro articles.
Shares of AT&T T are sliding Friday morning after the communications giant disclosed that there was a hack of calls and texts in April. Let's go back to our charts and indicators. In my June 25 review, I was positive on the shares.
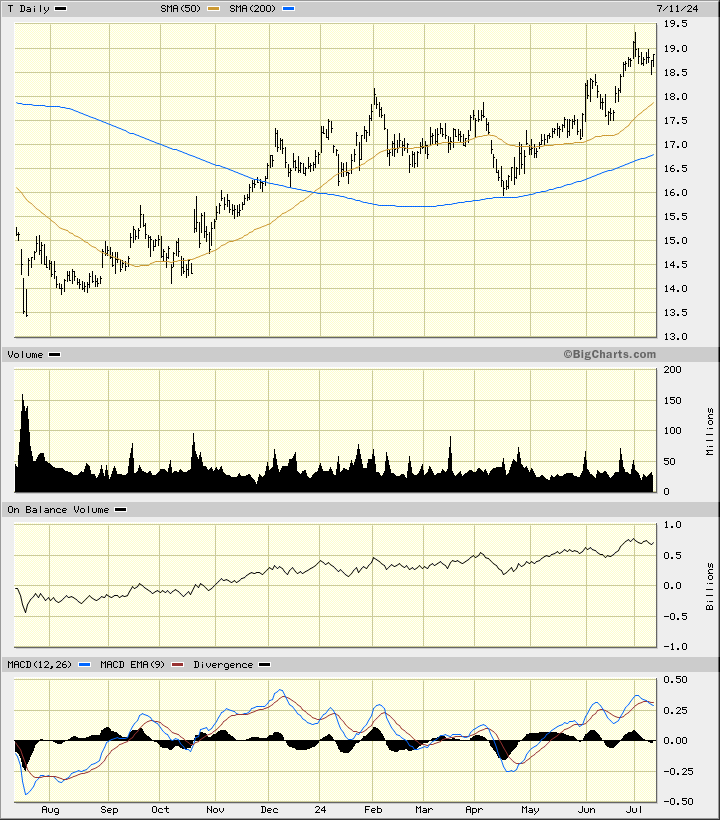
In this daily bar chart of T, below, I can see that prices are trading above the rising 50-day moving average line and above the rising 200-day moving average line. Using my imagination to visualize where T is trading in the premarket about 3% lower, prices could test the 50-day moving average line and the top of a support-zone, but I don't expect that to be lasting damage.
The On-Balance-Volume (OBV) line is on an upward path. The Moving Average Convergence Divergence (MACD) oscillator is still above the zero-line, but I would expect it to narrow further in the short-term.
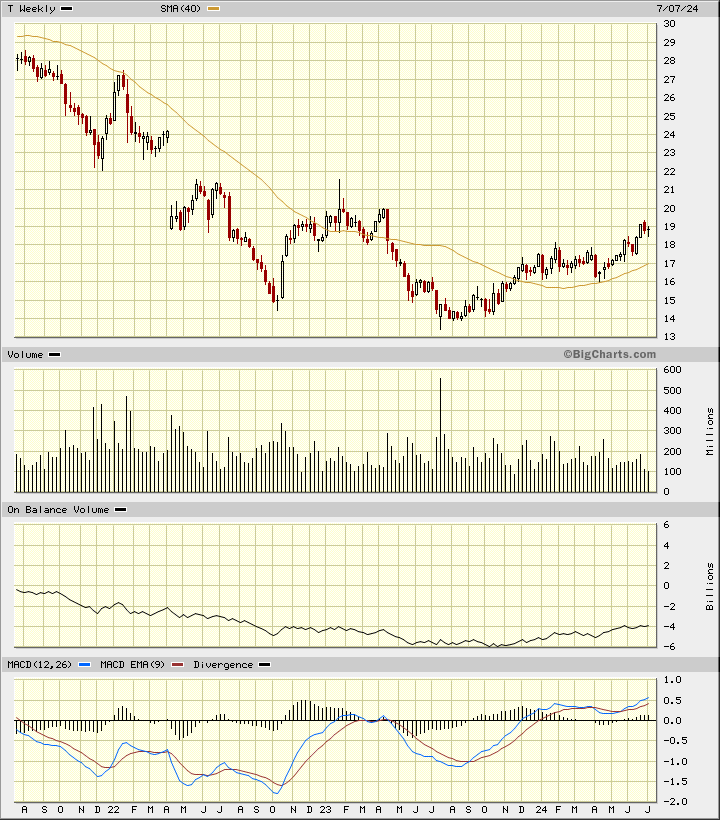
In this weekly Japanese candlestick chart of T, below, I still see a promising chart layout. Prices are trading above the rising 40-week moving average line. The $18-$16 area is anticipated to provide buying interest (support). The weekly OBV line is moving in the right direction and the MACD oscillator is bullish.
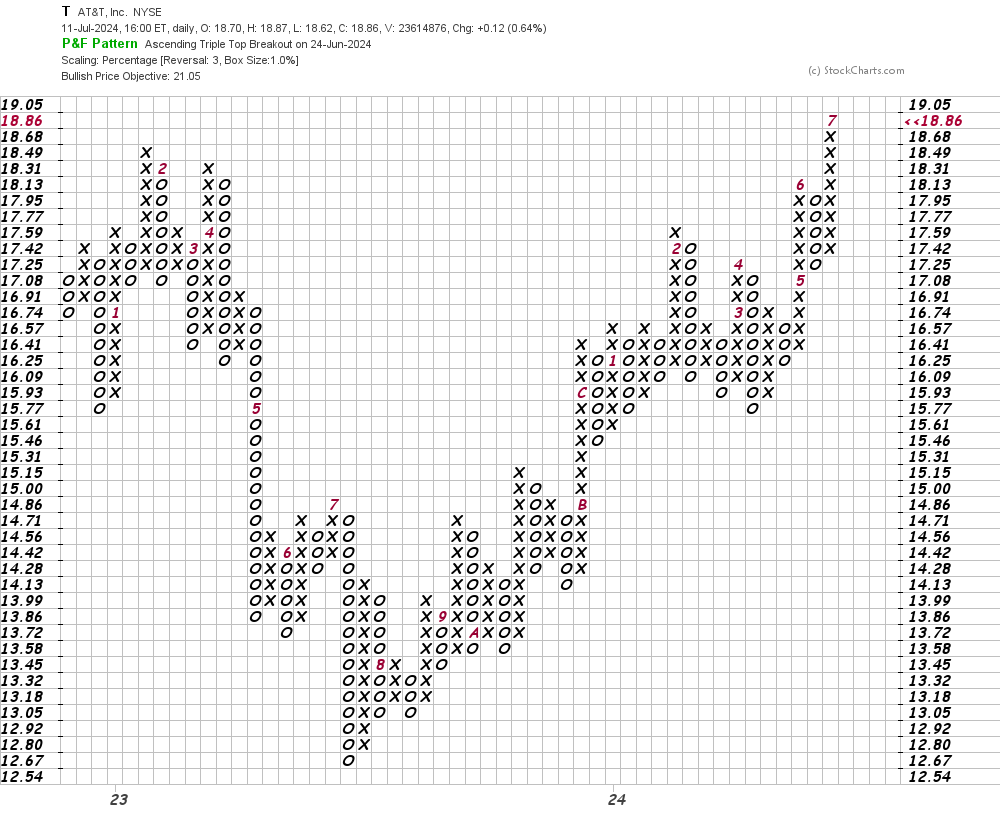
In this daily Point and Figure chart of T, below, I can see a price target in the $21 area. A trade at $17.08 is needed to turn this chart to the downside.
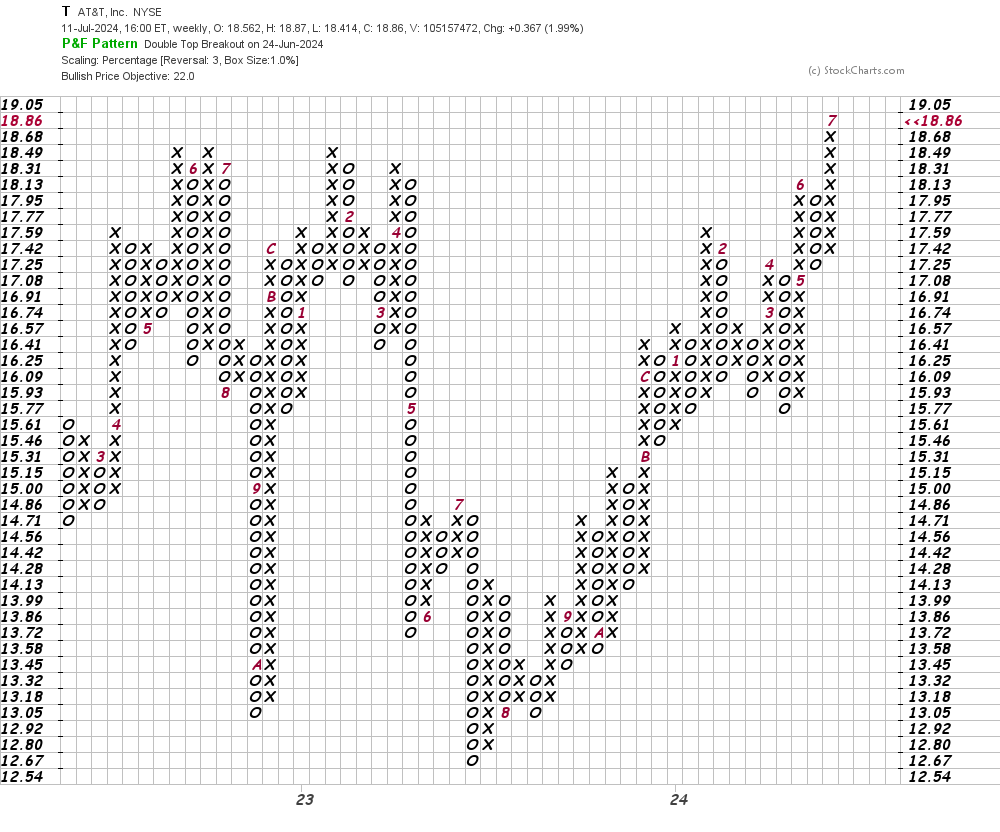
In this weekly Point and Figure chart of T, below, I can see a price target of $22.
Bottom line strategy: I have no idea where T will close today but my unscientific "gut feel" is that some investors may look to be buyers on this early weakness.
Employees of TheStreet are prohibited from trading individual securities.