Deckers Jumps on Earnings, but Traders Shouldn't Race Into the Stock Yet
The apparel name sprinted past quarterly estimates with gains in HOKA and UGG, so let's track the charts.
You've reached your free article limit
You've read 0 of 1 free Pro articles.
Deckers Outdoor DECK reported unadjusted earnings per share of $4.52 Thursday evening, which beat by a huge $1.01 and revenue of $825 million, which beat by $18.82 million. Deckers also raised guidance.
Share prices have jumped by around $100 in the pre-market at the time of writing this.
Let's lace up our colorful Hokas and check out the charts and indicators.
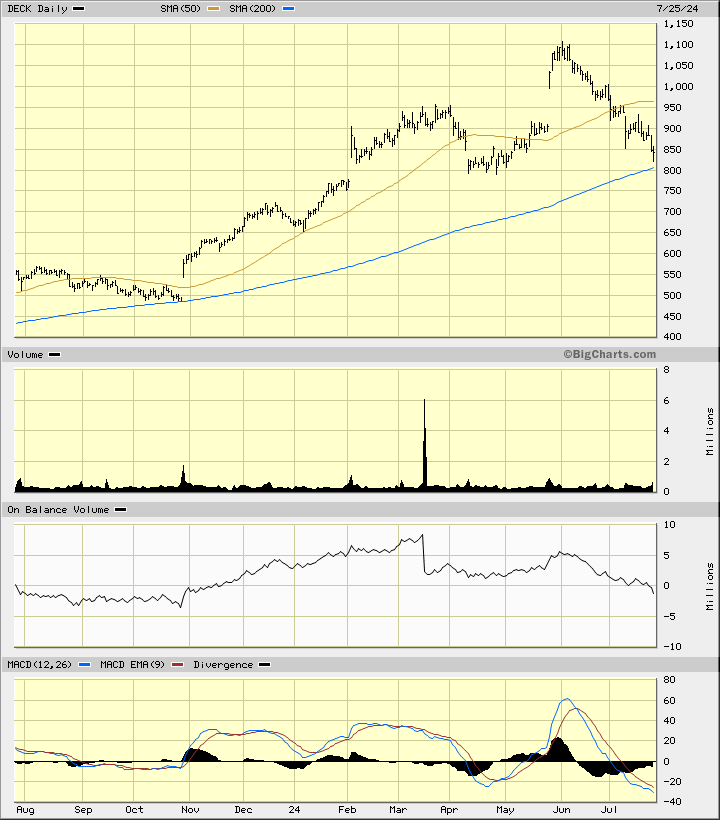
In this daily bar chart of DECK, below, I can see that prices corrected lower the past seven weeks to break the 50-day moving average line and come very close to the rising 200-day line.
We need to imagine prices trading some $90 higher this Friday morning. Prices would still be below the declining 50-day moving average line, but the gains are still very impressive. The On-Balance-Volume (OBV) line has shown us weakness since back in March telling me that sellers of DECK have been more aggressive than buyers.
The Moving Average Convergence Divergence (MACD) oscillator is in a bearish alignment below the zero-line but we could soon see a cover shorts buy signal in the days ahead.
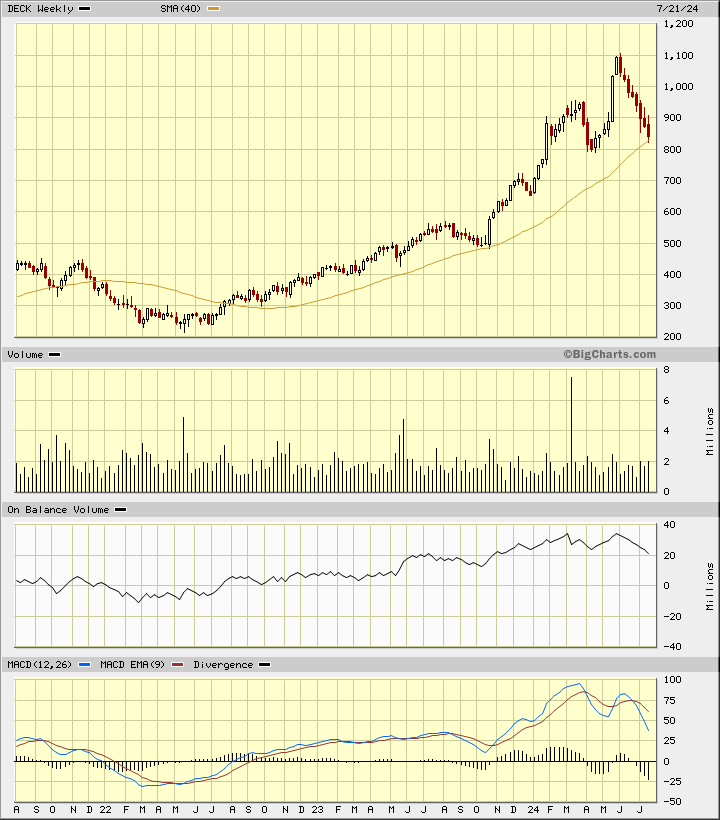
In this weekly Japanese candlestick chart of DECK, below, I can see a tremendous rally over the past few years that has generously rewarded patient investors. Prices have stayed above the rising 40-week moving average line and a dip to the line in 2023 was a buying opportunity.
This week we tested the line again. The weekly OBV line shows us a long bullish rise but weakness since early June. The MACD oscillator has been correcting lower the past few months suggesting that traders should take profits on longs.
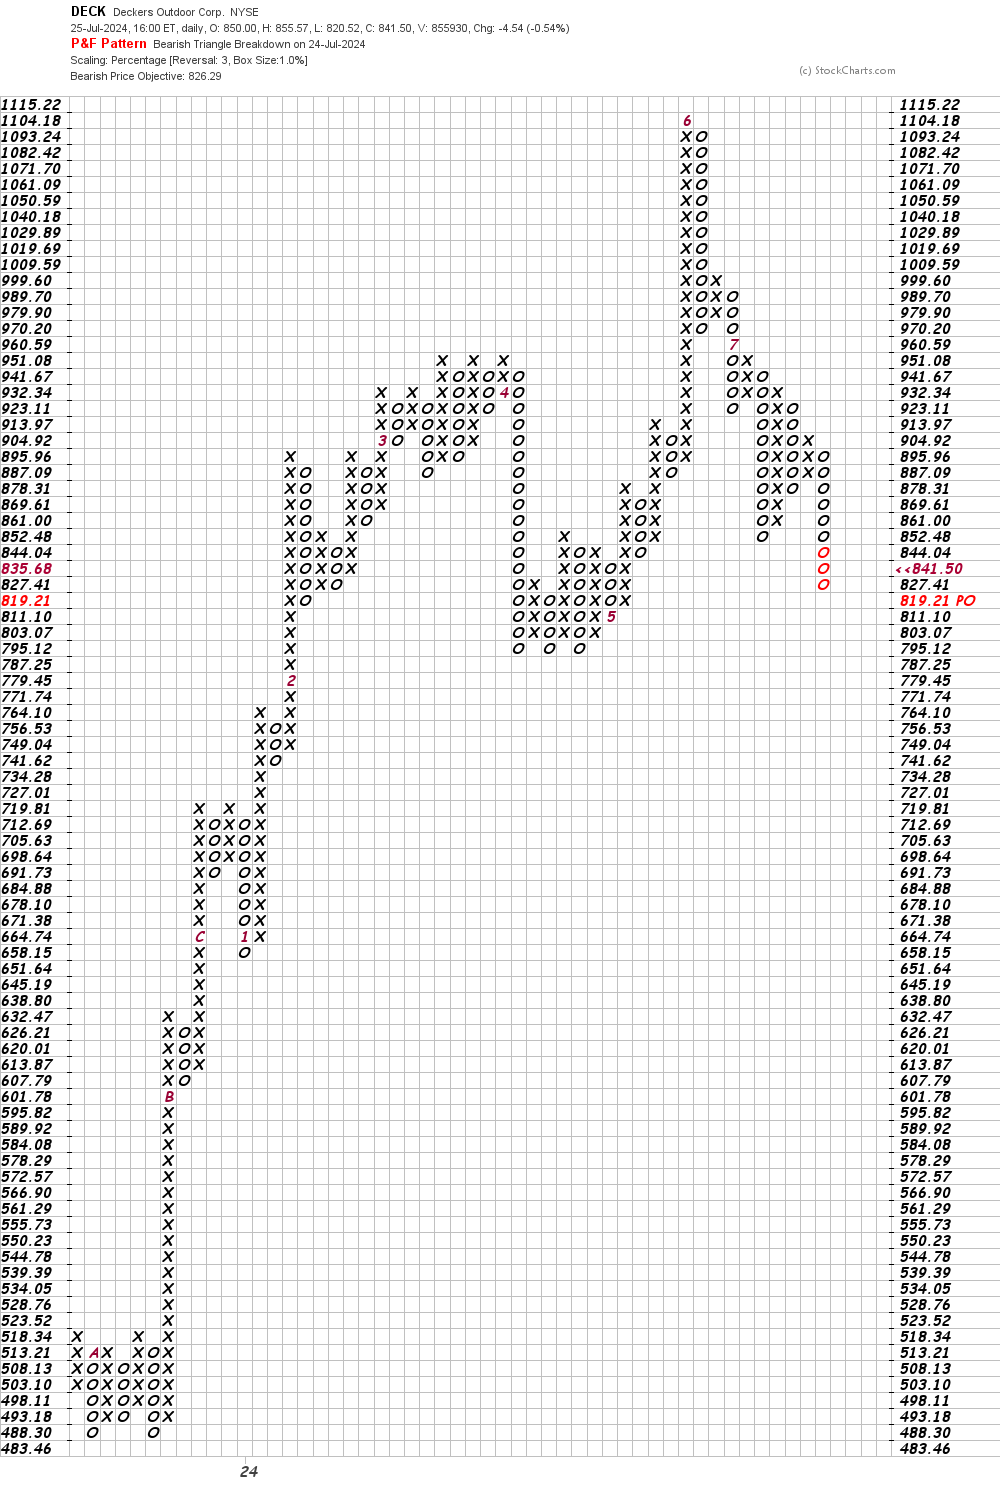
In this daily Point and Figure chart of DECK, below, I can see the price action through Thursday's close. Prices reached a downside price target in the $826 area. It may take a trade above $914 to turn this chart more positive.
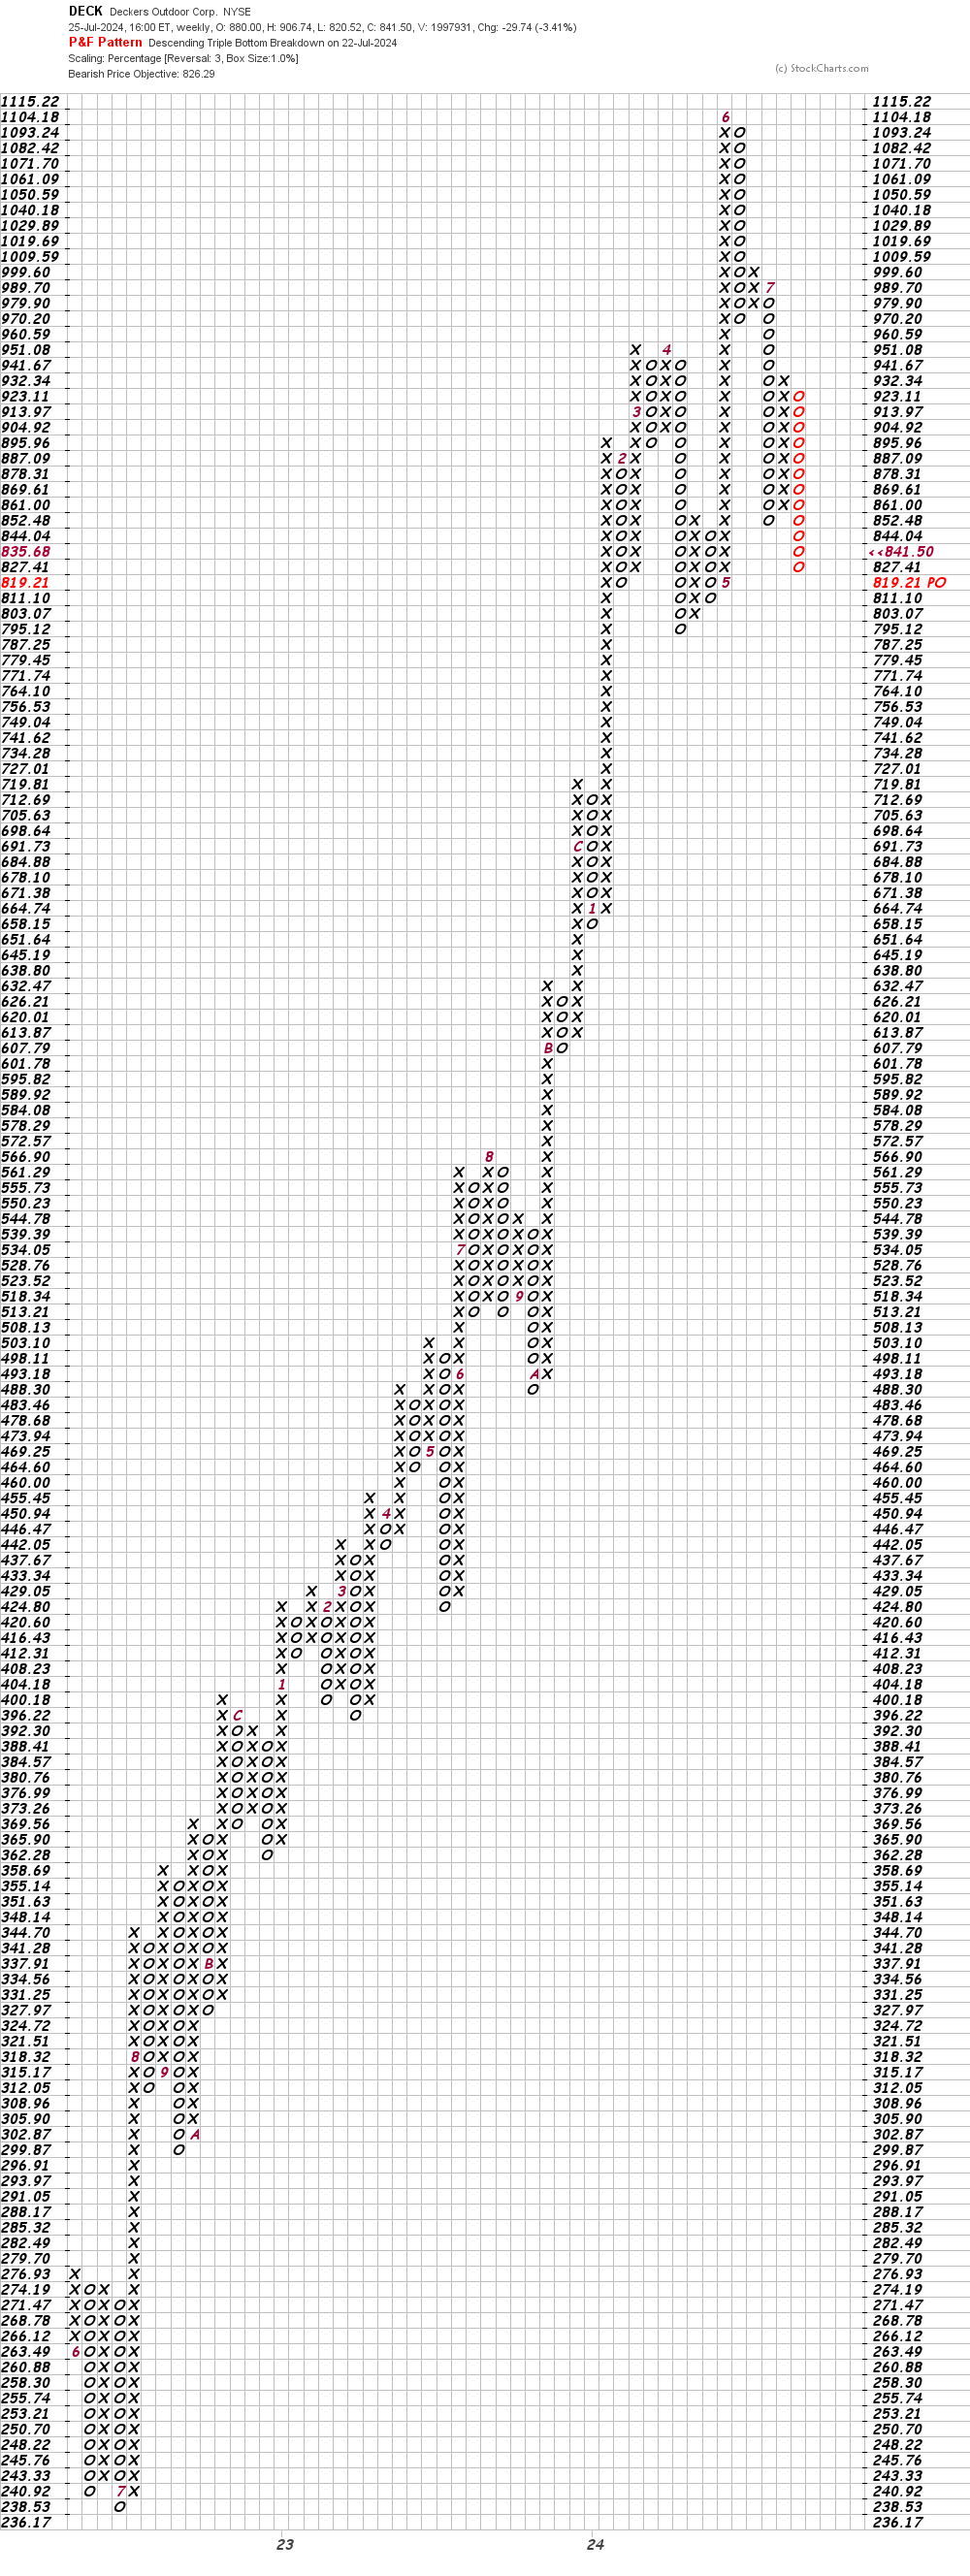
In this weekly Point and Figure chart of DECK, below, I can see the same $826 price target. I am not sure what price needs to be reached to turn this chart bullish again.
Bottom line strategy: It is amazing how the 200-day moving average line and the 40-week moving average line can identify turning points in the markets. Traders should not rush into buying DECK as the risk/reward ratio is not attractive with a sharply higher opening.
Employees of TheStreet are prohibited from trading individual securities.