Charting the Markets: Five Sectors to Watch
Taking a look at tech, REITs, utilities, semiconductors and more.
You've reached your free article limit
You've read 0 of 1 free Pro articles.
It’s mid-October, and earnings season is kicking into high gear. Financial stocks went for a wild ride on Tuesday after some of the biggest names in the business released their quarterly results.
As the days grow shorter and the leaves fall, let’s take another chart-filled road trip around the markets.
S&P 500 vs. Nasdaq 100
Both major indexes took a beating on Tuesday. The bullish gaps that occurred on Monday morning were filled, and then some.
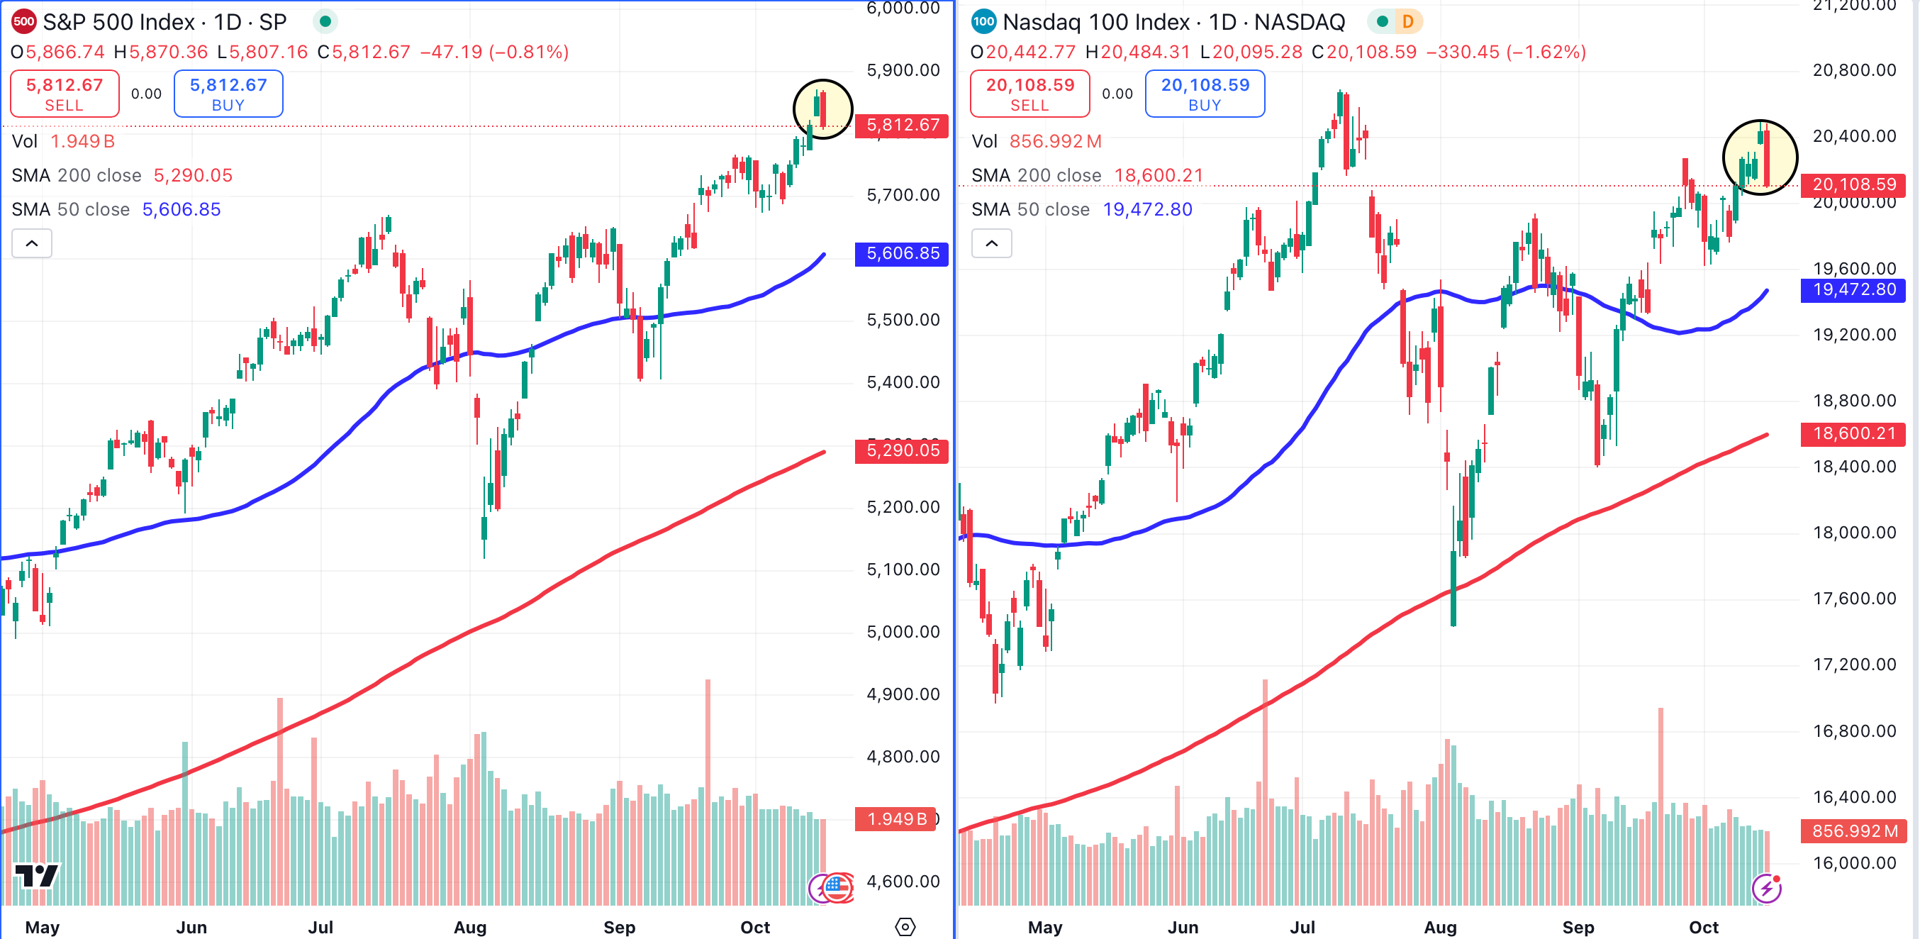
There would be no third consecutive all-time high for the S&P 500 (left), as a large bearish candlestick formed on the S&P’s daily chart (shaded yellow).
The Nasdaq 100 (right), which closed at a two-month high on Monday, gave back a week’s worth of gains, Tuesday’s monstrous red candle nearly engulfed the three prior candles (circled).
Dow Jones Industrial Average vs. Russell 2000
The Dow Jones Industrial Average (left) formed a dramatic bearish engulfing pattern (circled) after making two consecutive all-time highs. The DJIA was the best-performing index during the just-ended third quarter.
Ironically, only the woeful Russell 2000 (right) escaped Tuesday’s carnage. However, the Russell still lacks muscle.
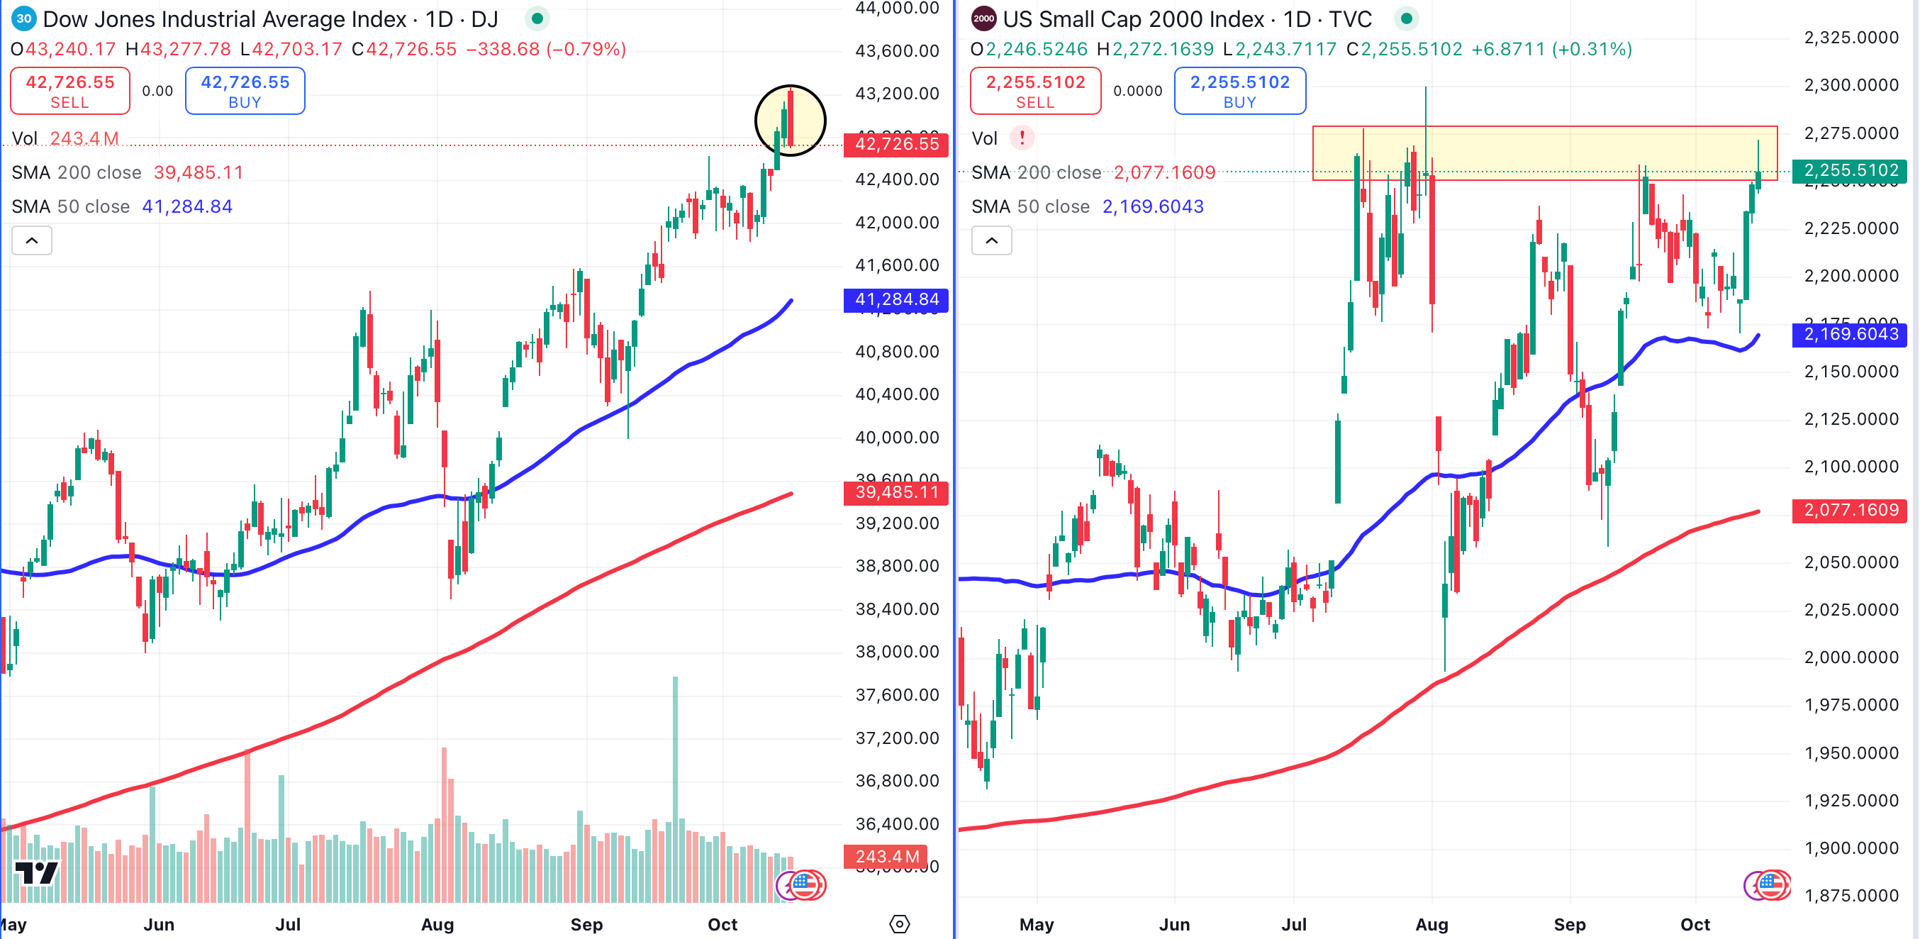
Tuesday’s green candle places the R2K in a thicket of resistance (shaded yellow), stretching from approximately 2,250 to 2,275.
The recent trend of investors rushing to buy the dip didn’t materialize on Tuesday, but all four key indexes remain above their key 50-day (blue) and 200-day (red) moving averages.
Sectors to Watch
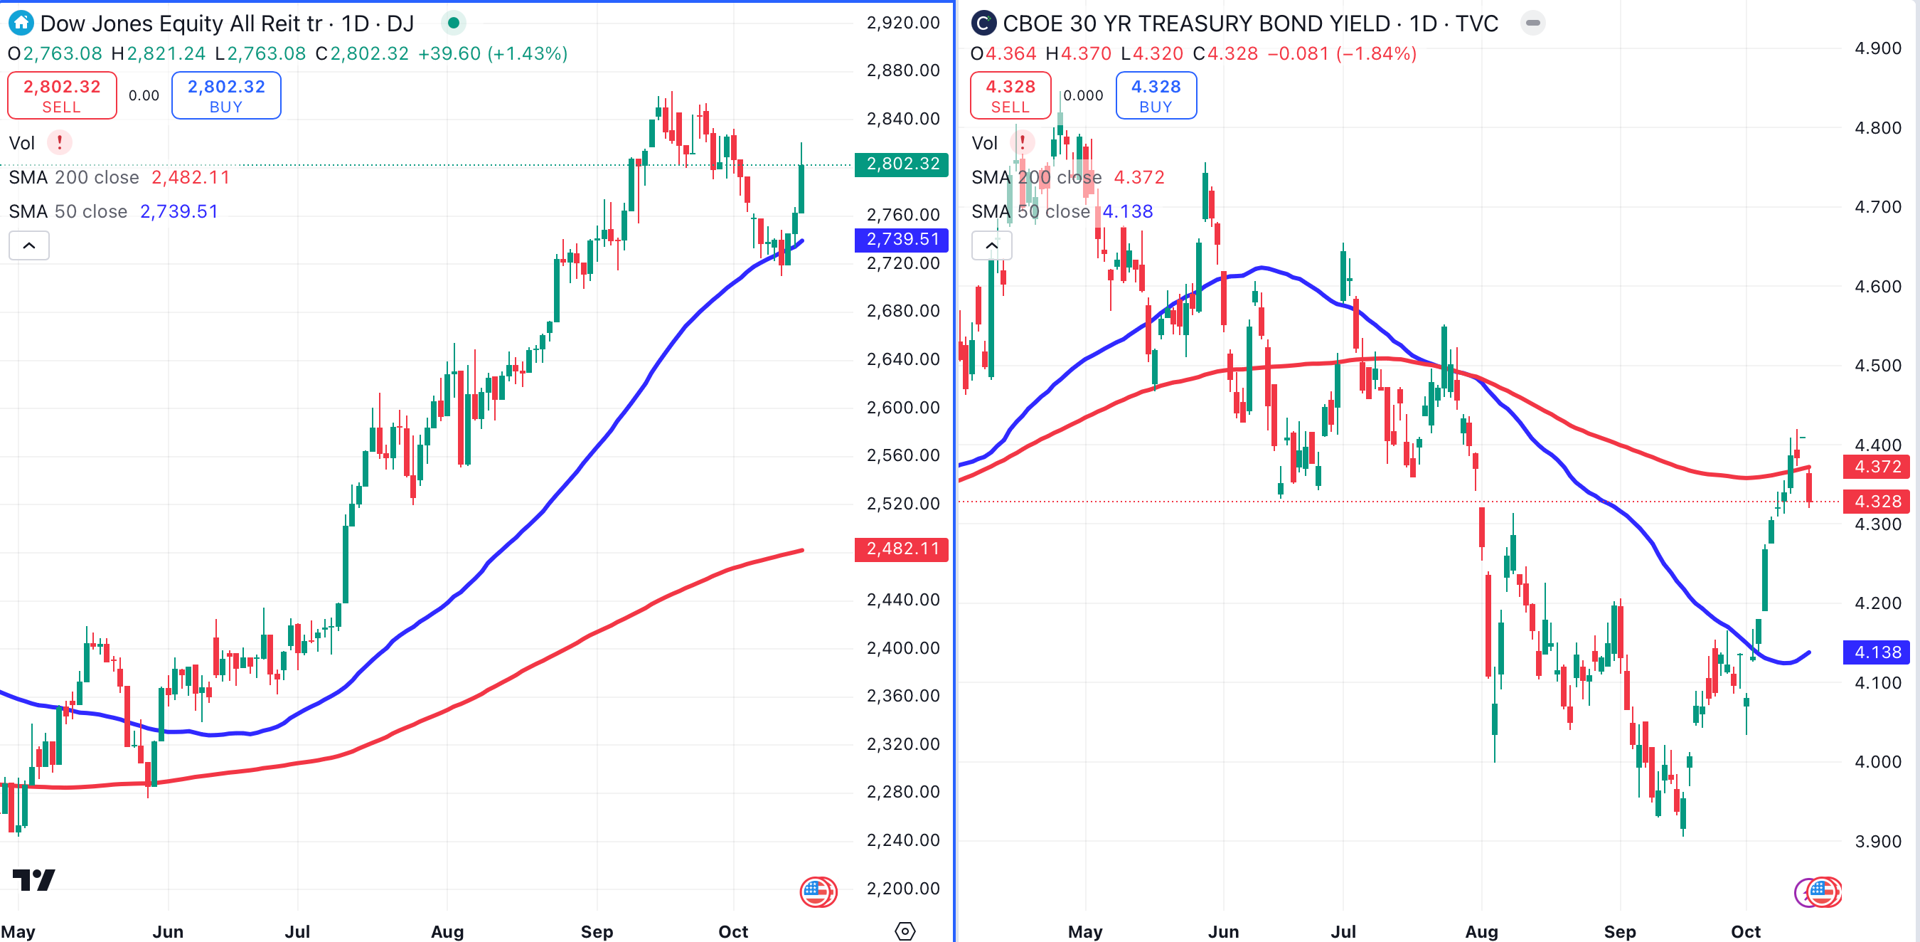
REIT Sector
Real estate investment trusts, or REITS, were loving the action on Tuesday. The Dow Jones Equity All REIT Trust (symbol REIT, left chart) enjoyed a 1.4% increase and is trending higher.
After a two-week rally, U.S. treasury yields dropped on Tuesday. making higher-yielding investments like REITs more attractive. The 10-year treasury note saw its yield drop 6 basis points, while the yield on the 30-year T-bond fell by 8 basis points (right chart).
Keep an eye on Treasury yields to see if this pullback becomes a trend.
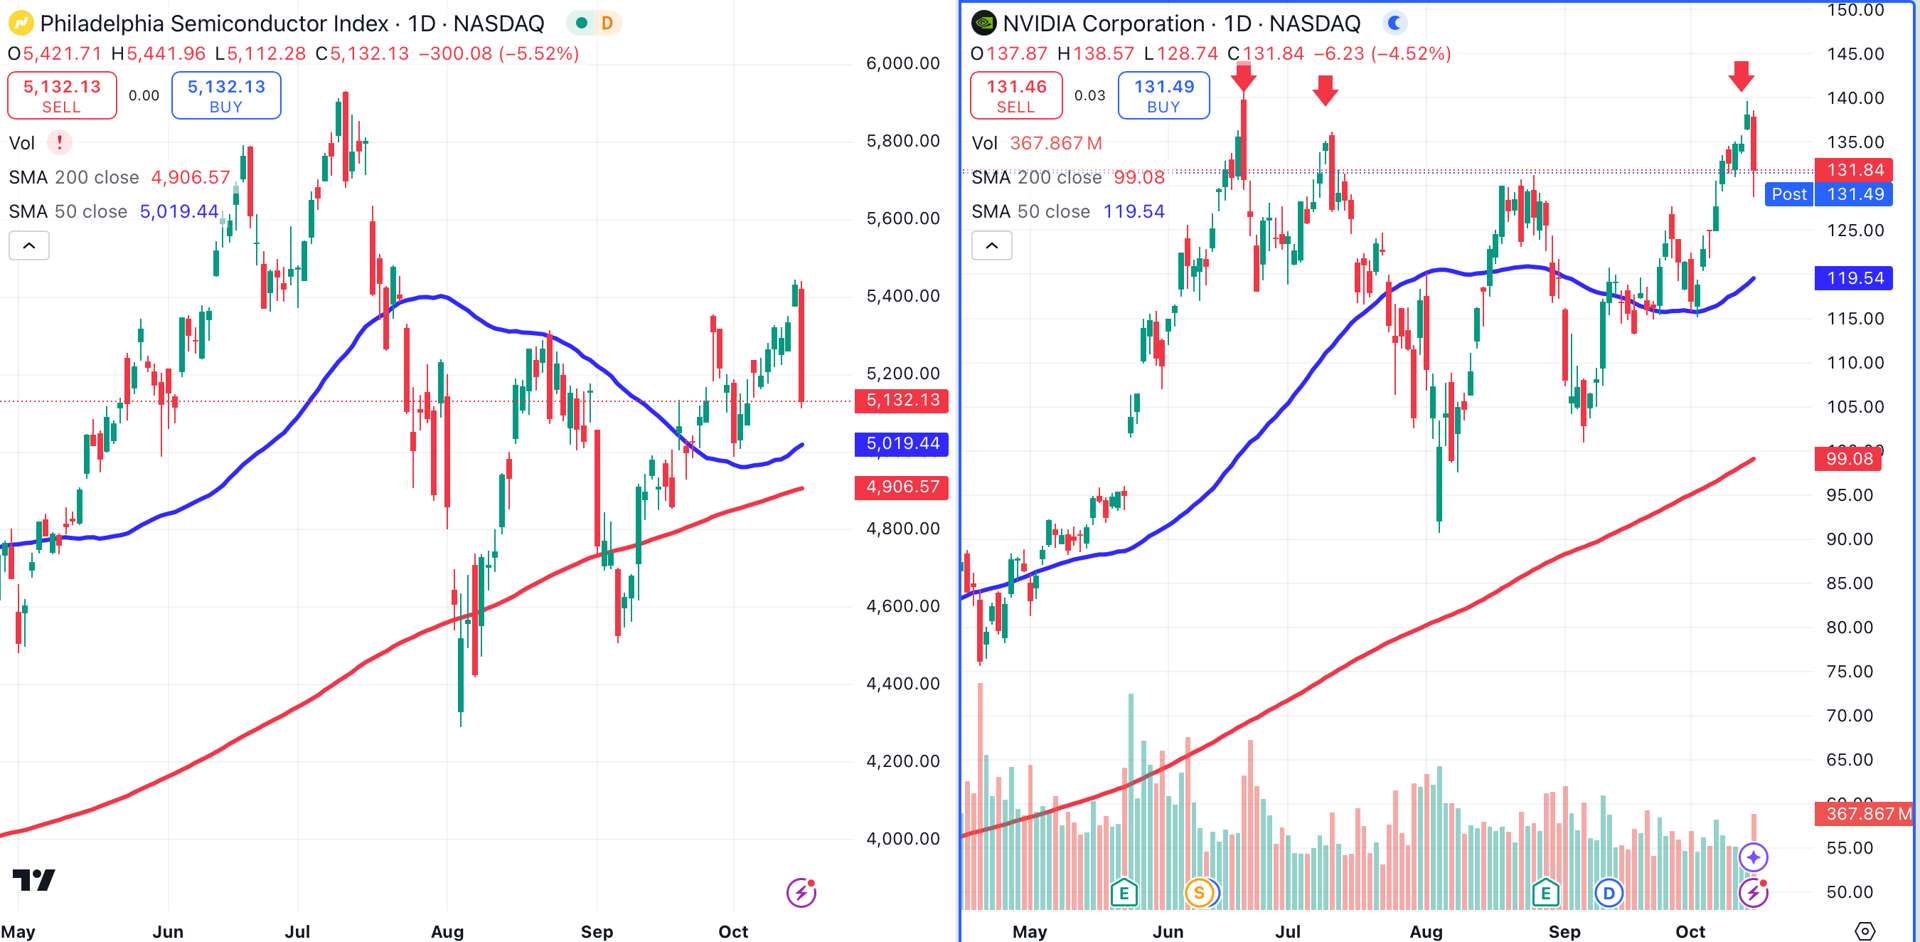
Semiconductor Sector
The Philadelphia Semiconductor Index (SOX) got knocked right out of its socks on Tuesday, losing 5.5%. The SOX (left) surrendered two weeks worth of gains in one ugly session.
Bull market poster child Nvidia NVDA (right), coming off of an all-time closing high on Monday, was pounded for a 4.5% loss. It was the third time since June (arrows) that Nvidia experienced a hard fall from the 130s.
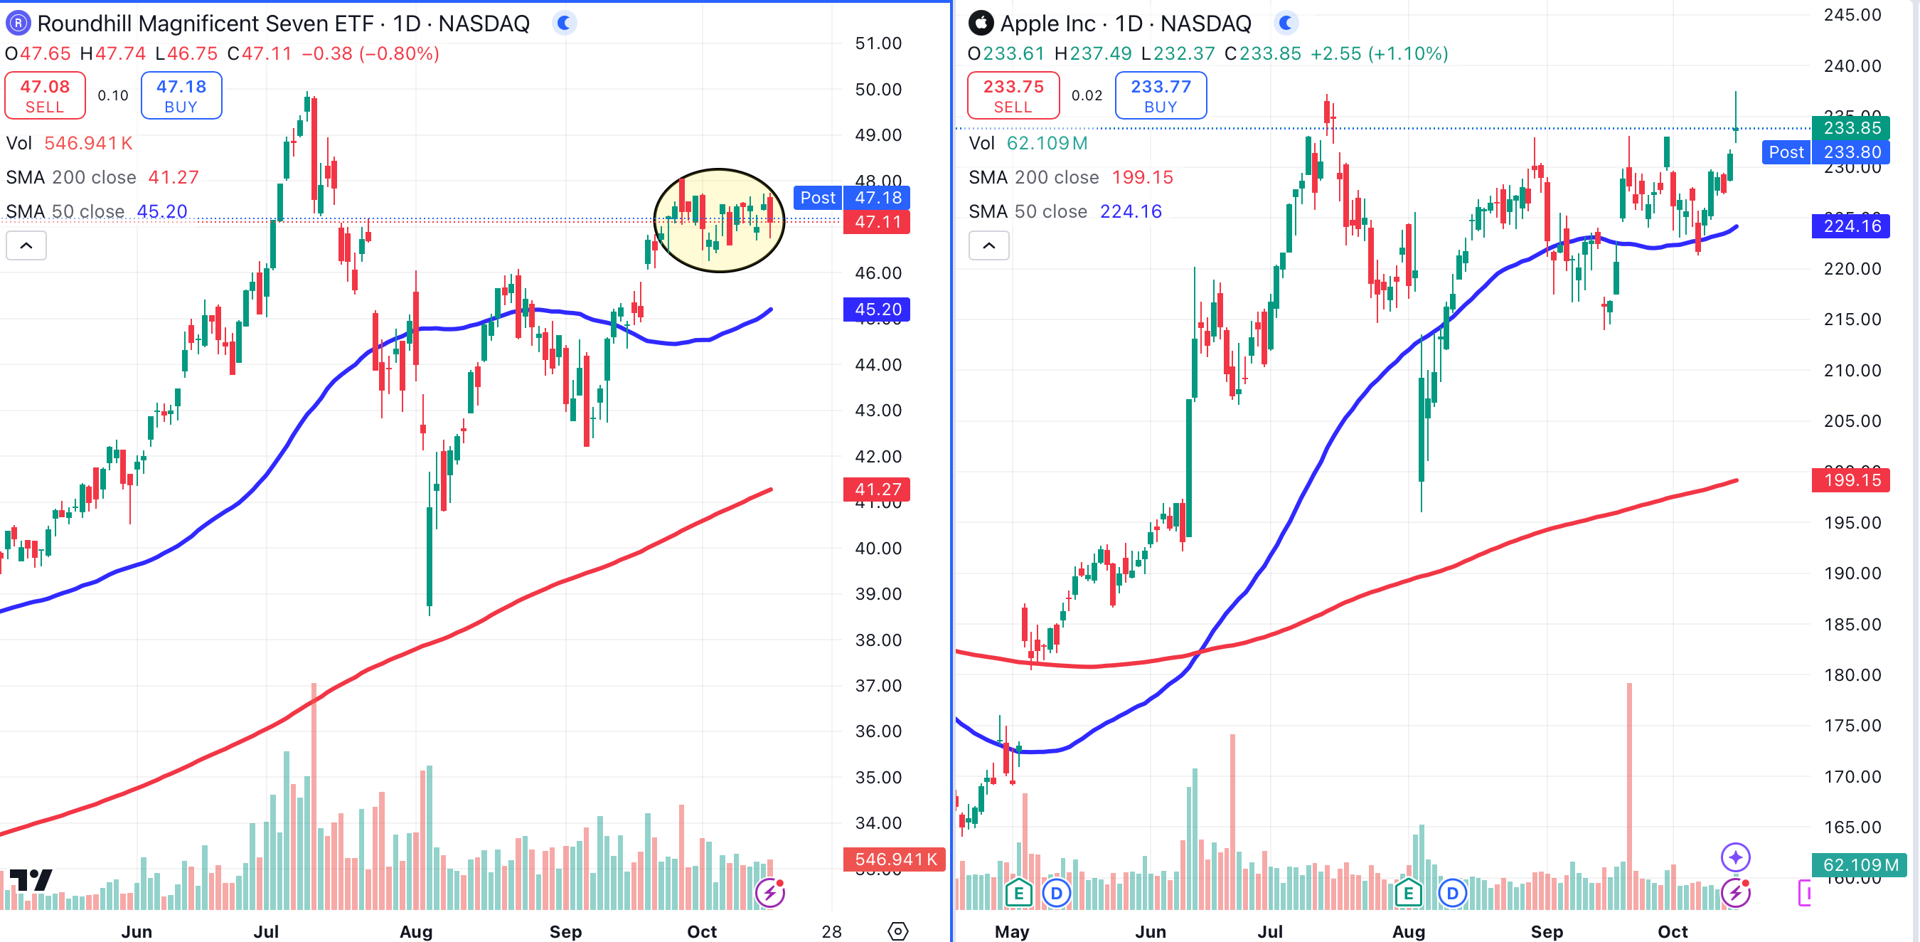
Large-Cap Tech Sector
Despite the carnage in the Nasdaq. the Roundhill Magnificent 7 (symbol MAGS, left chart) held up well. This focused ETF has been stuck in a sideways range for the past three weeks (shaded yellow).
Perhaps we can attribute some of this strength to Apple AAPL (right chart). Despite Tuesday’s carnage, Apple finished the day just $1 below its all-time high. Apple reports earnings on October 31.
Utilities Sector
After a steep decline last week, the utilities sector, represented by the Utilities SPDR Select Sector Fund XLU (left), is on the rise. Between falling treasury yields and tech companies seeking power for AI projects, this sector continues to show resilience.
Venerable utility provider Consolidated Edison (ED, right) closed Tuesday at a 52-week high. Citigroup raised the stock from a neutral to a buy, and raised Con Ed’s price target to $116.

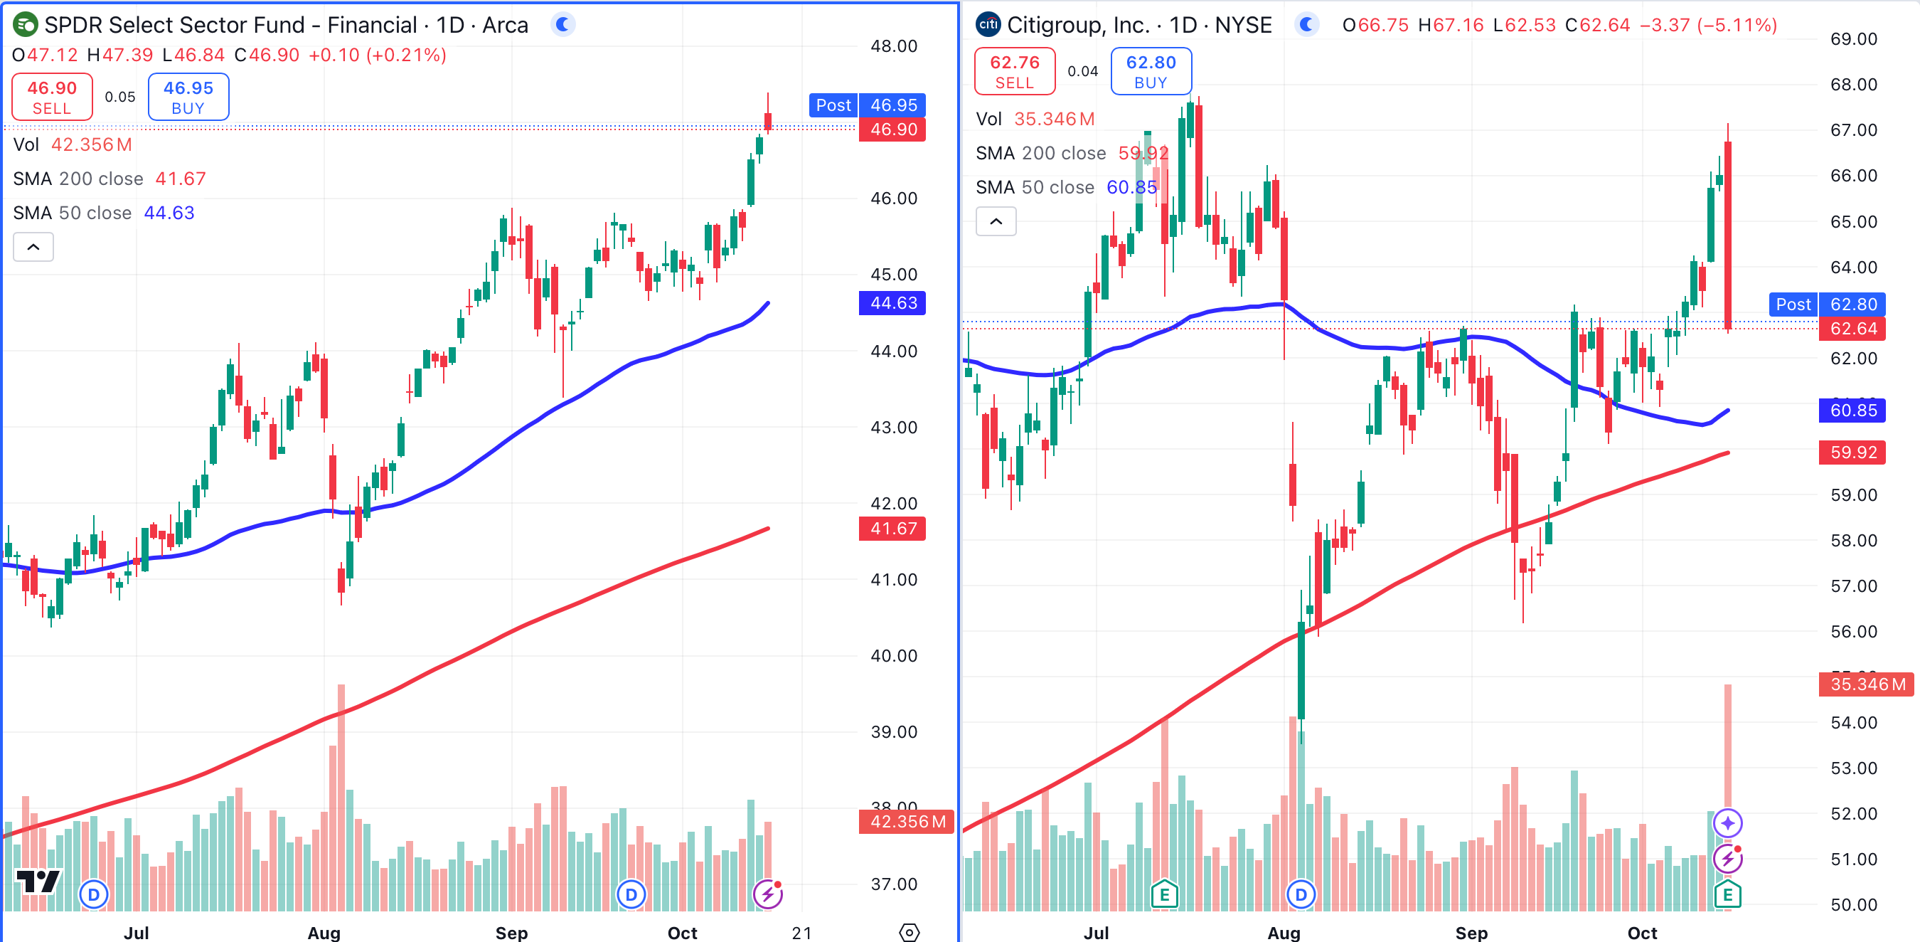
Financial Sector
Speaking of Citigroup C (right chart), the New York-based financial services provider was slammed for a 5.1% loss on Tuesday. The massive reversal occurred after the bank topped earnings and revenue expectations, and opened Tuesday’s trading day at a multi-month high.
However, Citi's decline couldn't stop the financial services sector, represented here by the SPDR Select Financial Sector Fund (XLF, left). XLF gained 0.2% on Tuesday to close at an all-time high.
Thank you for reading. If you have any sectors you’d like to see charted, drop a comment below.
At the time of publication, Ponsi was long AAPL.
