As Home Depot Leads the Dow Lower, Is There Something to Build On?
Let's check out the charts and indicators as spending fears rise.
You've reached your free article limit
You've read 0 of 1 free Pro articles.
The DIY and more store, Home Depot HD, is down 4% Tuesday as fears rise over reduced spending on remodeling and other home projects.
Let's check out the charts and indicators.
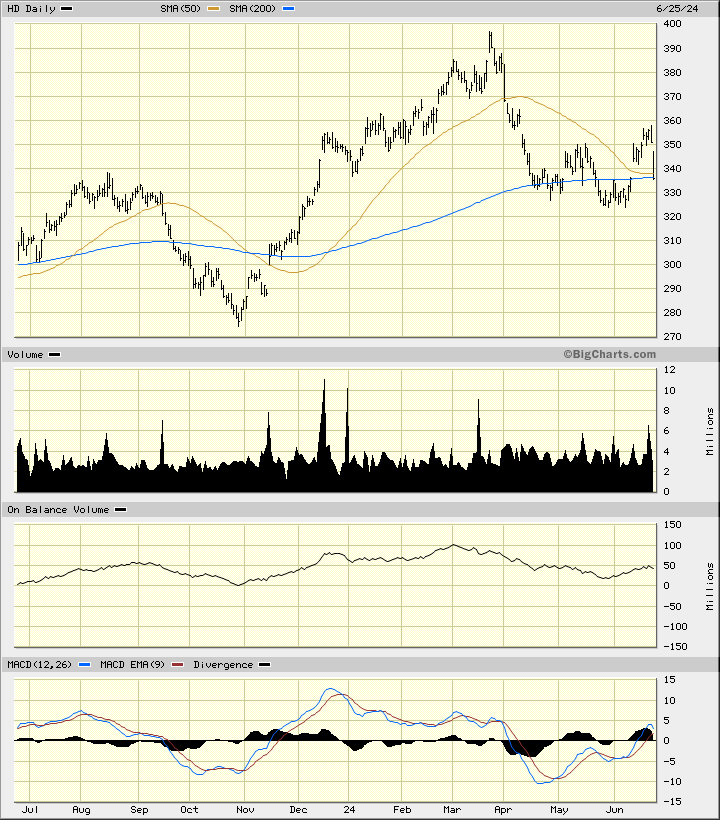
In the daily bar chart of HD, below, I can see that the shares gapped lower Tuesday and are testing/breaking the 50-day and the 200-day moving average lines. HD made a peak in late March and the price action looks like we have made a secondary peak in late June. A new low for the move down is needed to confirm that conclusion.
The trading volume looks a little move active the past three months as prices declined. The On-Balance-Volume (OBV) line made a high in early March and could be making a lower high in June. The Moving Average Convergence Divergence (MACD) oscillator is just slightly above the zero line but already poised to cross to the downside.
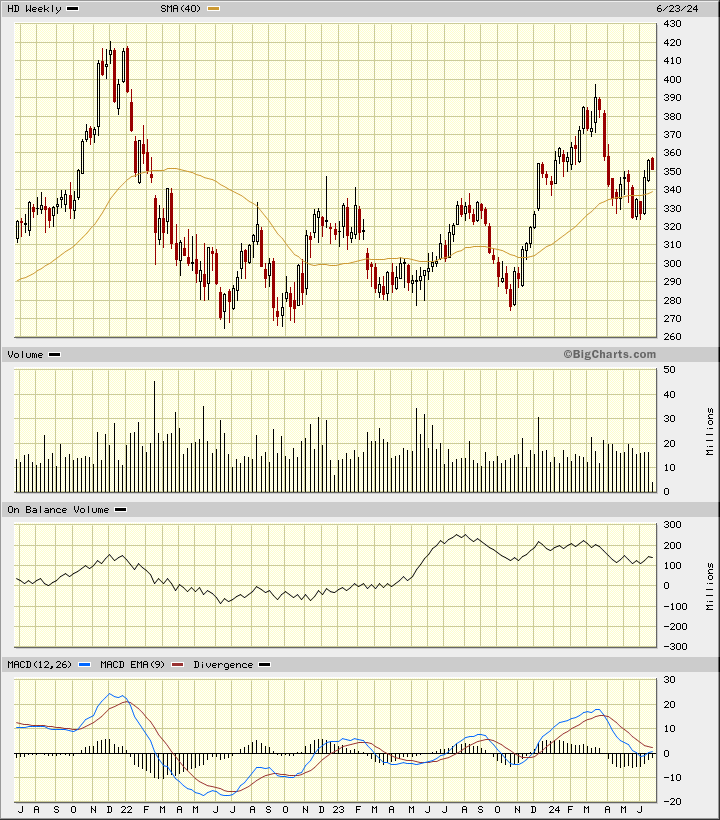
In the weekly Japanese candlestick chart of HD, below, I see a mixed picture. The shares are testing the rising 40-week moving average line.
The weekly OBV line has been weakening since last August. The MACD oscillator is close to the zero line.
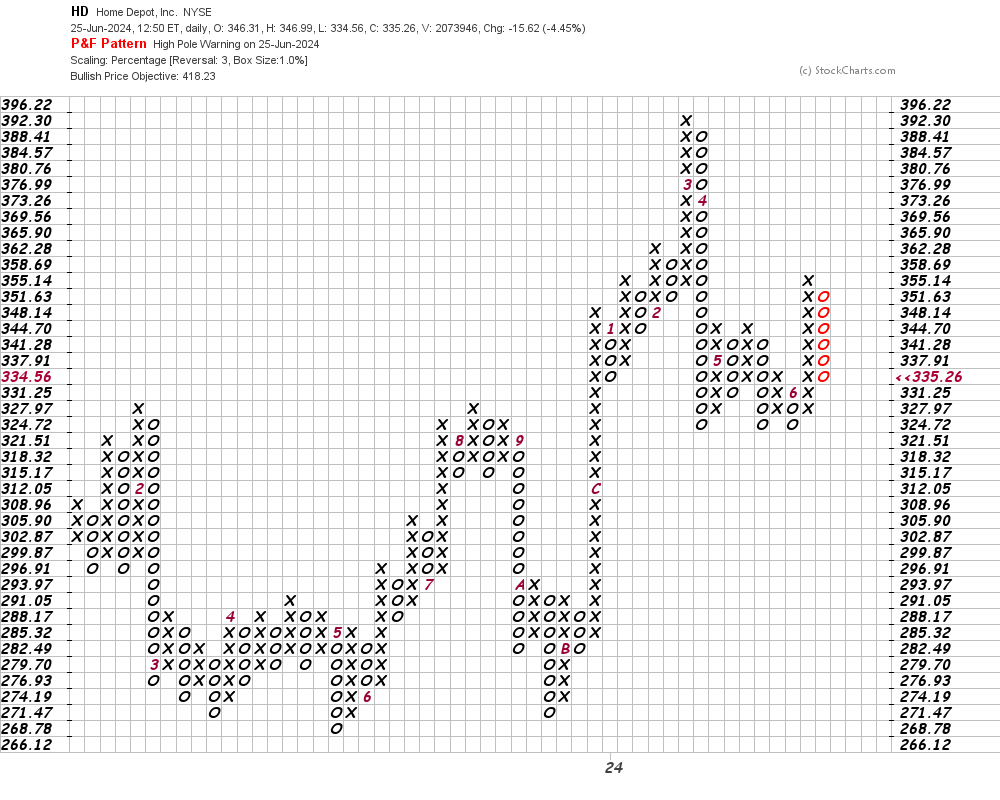
In this daily Point and Figure chart of HD, below, I can see that the software is currently showing us an upside price target in the $418 area. A trade at $312.51 could turn the chart bearish.
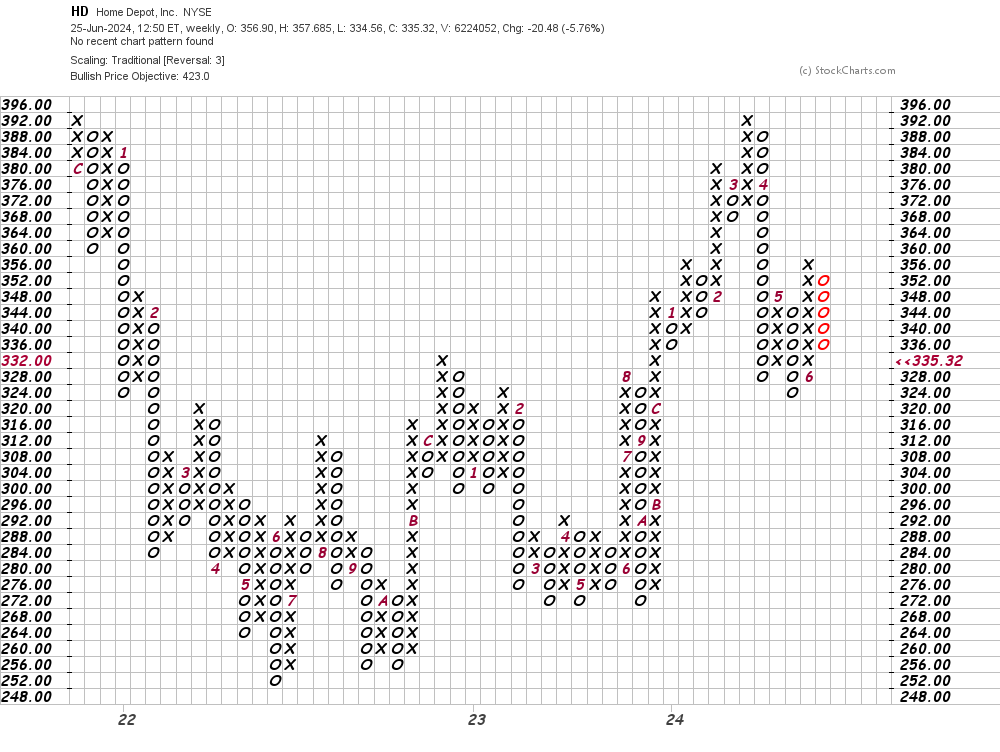
In this weekly Point and Figure chart of HD, below, I can see an upside price target of $423 but a trade at $320 refreshes the downtrend.
Bottom-line strategy: If HD breaks its May/June lows it will likely precipitate further declines. Avoid the long side of HD unless you have a "honey do" project that must get done.
Employees of TheStreet are prohibited from trading individual securities.