Alphabet Googles 'Selloff'
Should investors view Wednesday's weakness as a buying opportunity? We'll let the charts and indicators decide.
You've reached your free article limit
You've read 0 of 1 free Pro articles.
Alphabet GOOGL reported their second-quarter results Tuesday night and they beat on earnings and revenue. However, the stock is sinking Wednesday because the company indicated that operating margins would be hurt in Q3.
Let's check out the condition of the charts and the indicators.
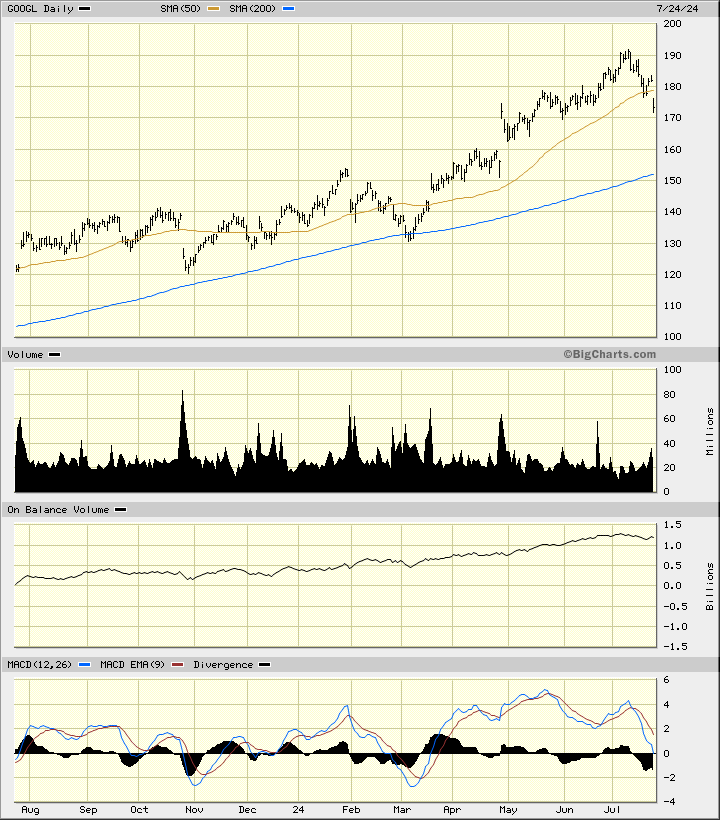
In the daily bar chart of GOOGL, below, I see a setup that suggests more weakness ahead. The shares have gapped below the rising 50-day moving average line. Trading volume is active and if it maintains the early pace it will tell me that some traders are voting with their feet.
The daily On-Balance-Volume (OBV) line shows me weakness since early July. The Moving Average Convergence Divergence (MACD) oscillator turned lower in late May and is nearly down to the zero line.
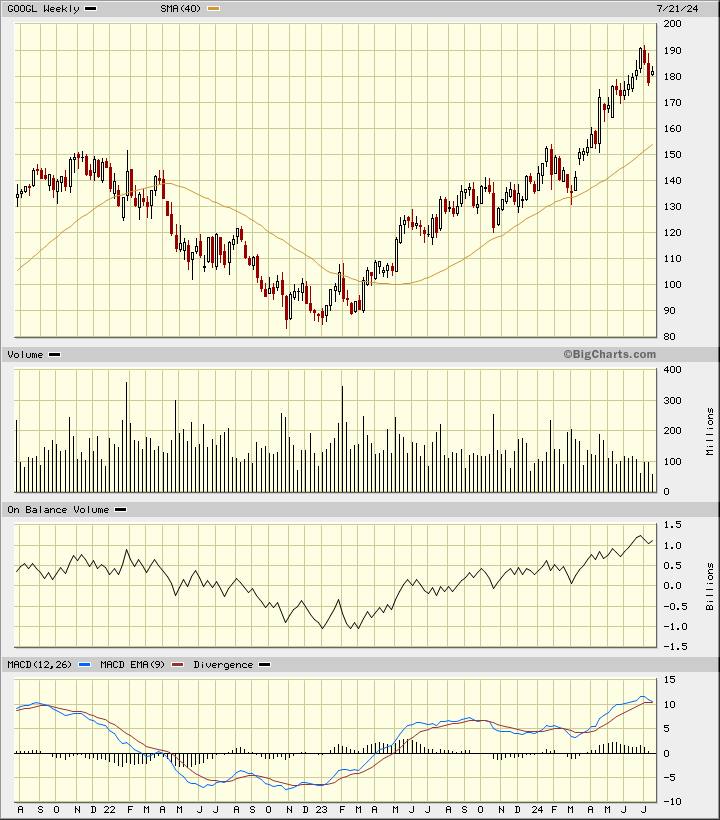
In the weekly Japanese candlestick chart of GOOGL, below, I only see the early start of weakness. The shares are above the rising 40-week moving average line.
The weekly trading volume was declining into the price high and that suggests that investors were losing their interest in the stock. The OBV line has started to turn lower. The MACD oscillator has narrowed and is close to a downside crossover and take profit sell signal.
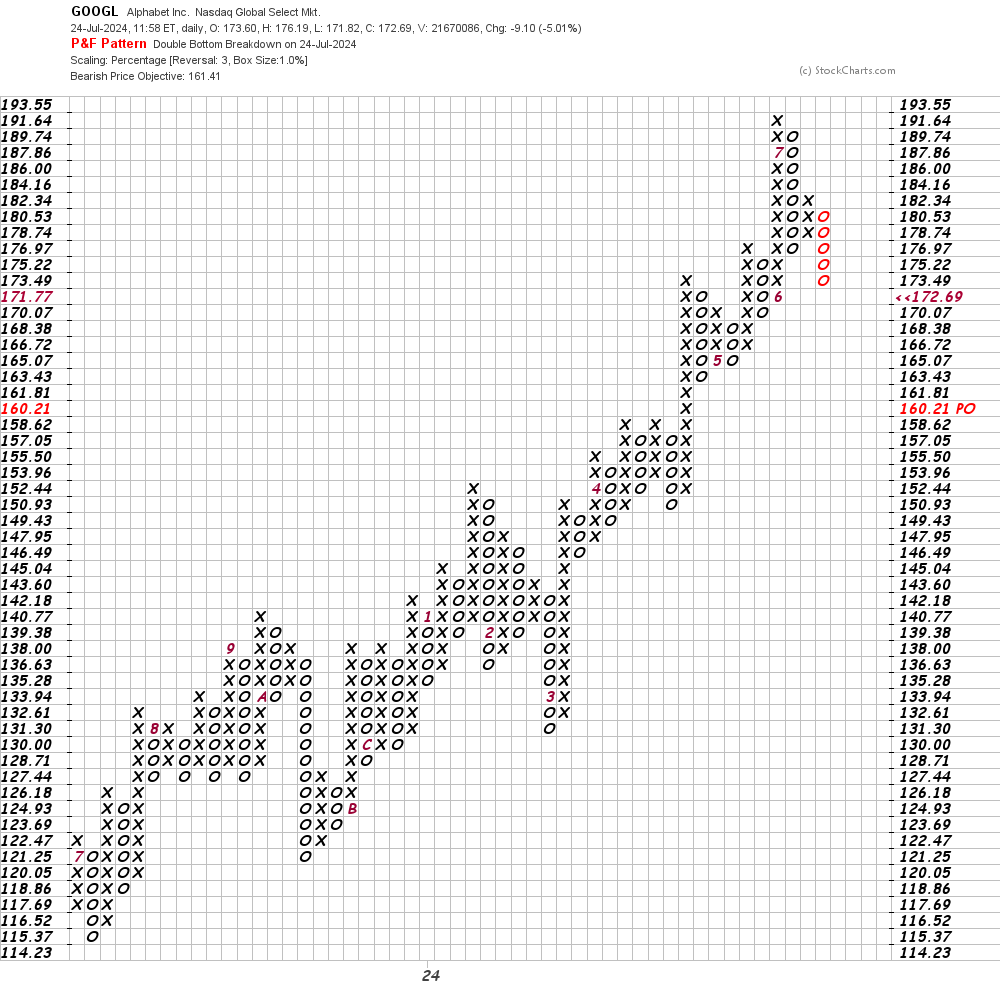
In this daily Point and Figure chart of GOOGL, below, I can see a potential downside price target in the $161 area.
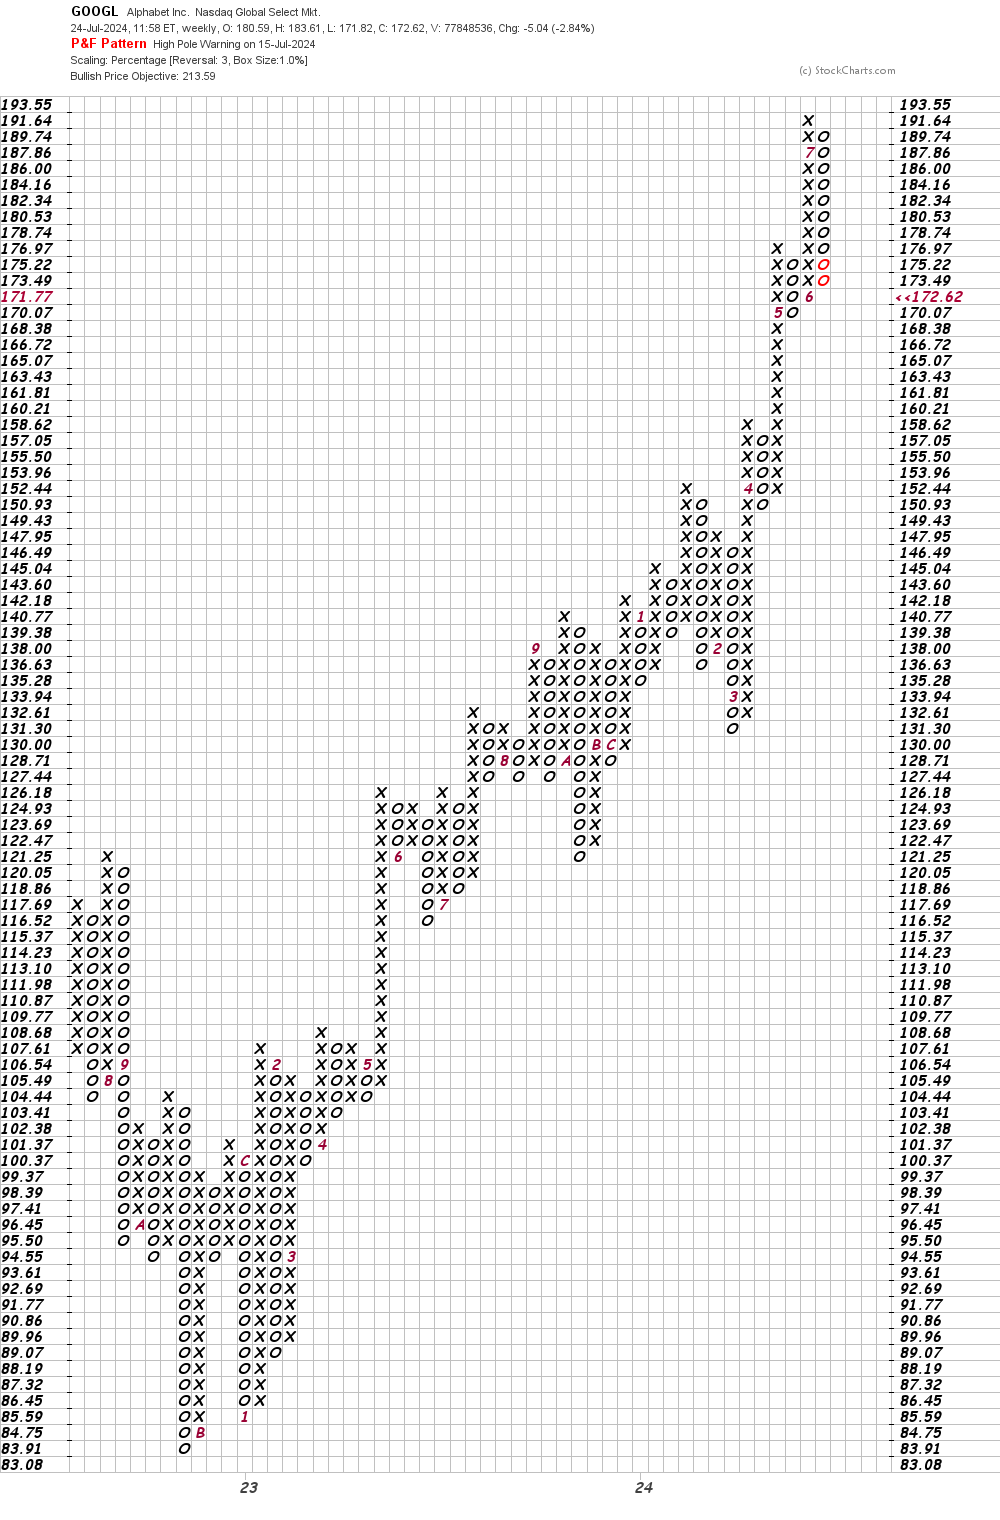
In this weekly Point and Figure chart of GOOGL, below, shows us an upside price target but a trade at $168.38 or lower could turn this chart bearish.
Bottom-line strategy: Some investors and analysts may be viewing today's weakness in GOOGL as a buying opportunity. I don't. Further declines are possible.
Employees of TheStreet are prohibited from trading individual securities.