After Wednesday's Fall, We Can't Be Sure That Santa Will Choose to Call
Did the Fed play Grinch today? Let's look at some important statistics before answering your questions.
You've reached your free article limit
You've read 0 of 1 free Pro articles.
The Market
Now, that was a whack. And we had some serious selling. Sit back because I have a lot of statistics to throw your way.
First, 90% of the volume on the NYSE was on the downside. This is typically short-term bullish because it means folks panicked and sold. Nasdaq didn’t even come close to that sort of panic, though. However, the QQQs traded 50 million shares, the highest in three months. I wouldn’t call it panic but I would say ‘some concern’.
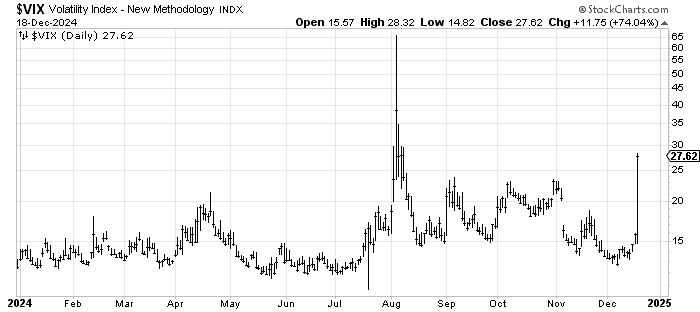
Next, did you see the VIX? Wow. I know I have said before that jumpy is a subjective situation, but to me, a jumpy VIX should look like it is breaking out, and that’s what this looks like.
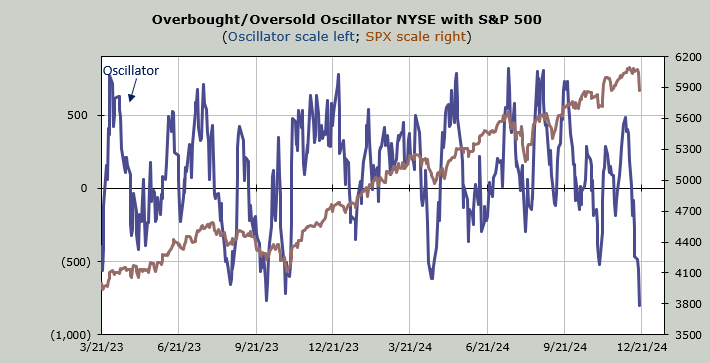
Next up, we are oversold. My own Oscillator hasn’t been this oversold since the fall of last year. In fact, it’s a bit lower than that (it is closer to where it was in March of 2023). My first comment is: yes, oversold. The second is that this has made a lower low, which tends to mean we’d have to bounce and come back down—notice the three oversold lows in the summer/fall of 2023.
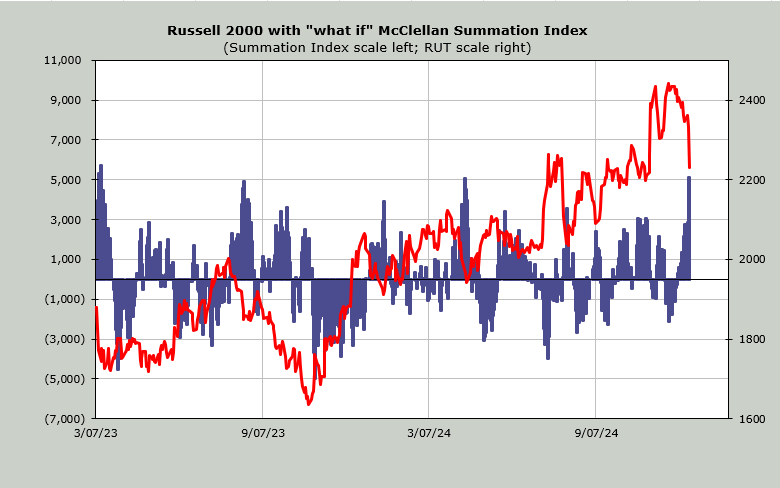
The McClellan Summation Index fell under the zero line. On its own, that is not important except that it tells us how truly weak most of the market has been. But it will now take a net differential of +5200 advancers minus decliners on the NYSE to halt the slide. That’s extreme and should lead to an oversold rally.
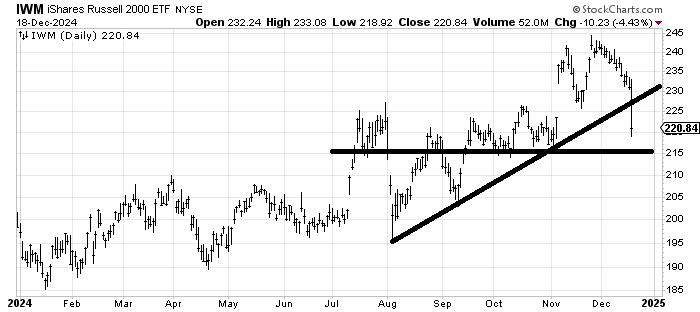
We’ve had a lot of gaps filled or close to it today. IWM more than filled the election gap. The DJIA is mere points away.
Next up is the DSI for bonds is 10. The US Dollar finally got a spotlight as almost everyone said look at the buck (and now thinks it is going higher). The DSI is 87. The New Zealand Dollar is at 9, the Aussie Dollar is at 9, and the Canadian Dollar is at 9. The Euro is at 10. The bonds and currencies are extreme or just about there.
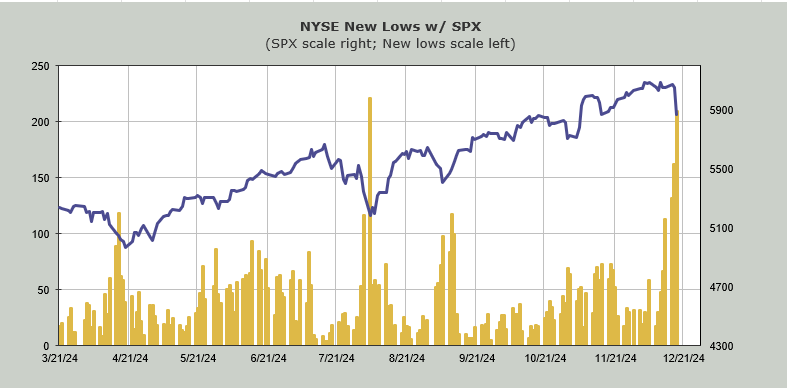
That doesn’t mean it’s all sunshine—it isn’t. The new lows exploded upward, with the NYSE at the same number it saw in August. Nasdaq is not that far along yet.
In terms of the Hi-Lo Indicator, which I haven’t discussed much lately because it has sat there, the NYSE is at .50, and Nasdaq is at .51, so they are not yet oversold (under .20) but they are on their way.
There are other issues as well. The main one being that sentiment is still far too complacent. Even if we see the shorter-term surveys show a move toward bearishness in the coming days, it is going to take time to wear down those indicators. Folks rarely go from such an extreme to the other extreme. For example the put/call ratio was .85 today, a big nothing burger.
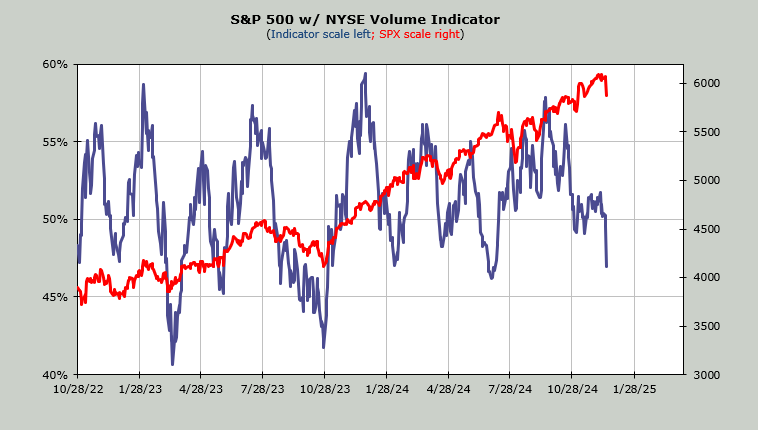
Finally, do look at the Volume Indicator below because it is now at .47.
New Ideas
I don’t know if we can have an oversold rally before the weekend. As a reminder the Santa Rally is supposed to begin a few days before Christmas, which is still a week away. I still think we get that rally. But I also think we’re going to need to see sentiment change to get anything long lasting.
IWM broke that line I have been drawing in but it is the most oversold index. Resistance should start at 225-ish
Today’s Indicator
The Volume Indicator is now 47% which is oversold. The math says it probably goes lower though. But finally we one intermediate term indicator that is in oversold territory. But that’s because it is based on what the majority of stocks are doing not the S&P.
Q&A/Reader’s Feedback
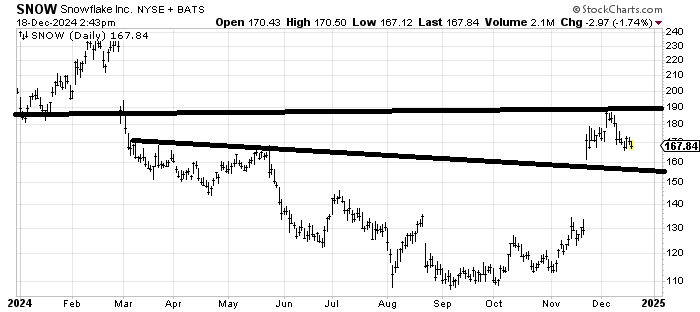
Snowflake SNOW got to resistance and should now make its way down to that lower line (at least) with a possibility that it fills the gap. First I’d look for that lower line though.
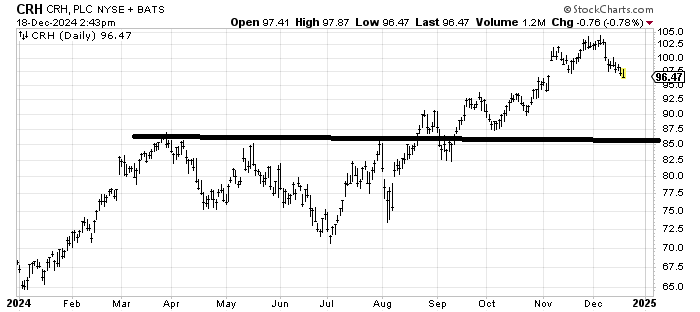
CRH completed its 90/100 objective when it tagged 100 after the election. It is now close to filling the gap from that post election jump. So sure it ought to bounce but it’s been a weak stock so I’m not interested in bottom fishing it. If it does rally and can’t get over 100 I’d get concerned that it will head down to the upper 80s/low 90s.
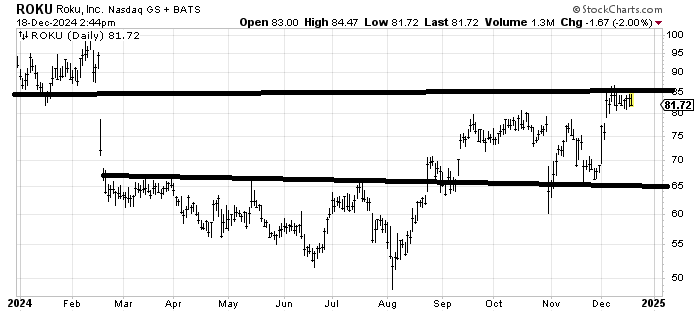
Roku ROKU met its objective from the base (over 65) when it tagged 80. It also filled the gap (from February). If the stock can mill around in the 75-80 area for several more weeks then I might be interested in buying it again but for now I’m inclined to be a profit taker.