I've Got a $200 Long-Term Price Target for Surging Software Company
One software company helping to automate back-office processes has seen a stock price uptrend for the past year.
You've reached your free article limit
You've read 0 of 1 free Pro articles.
Guidewire Software Inc. GWRE helps companies to automate their back-office processes and provides various financial products and services. Let's check on the condition of the charts and indicators.
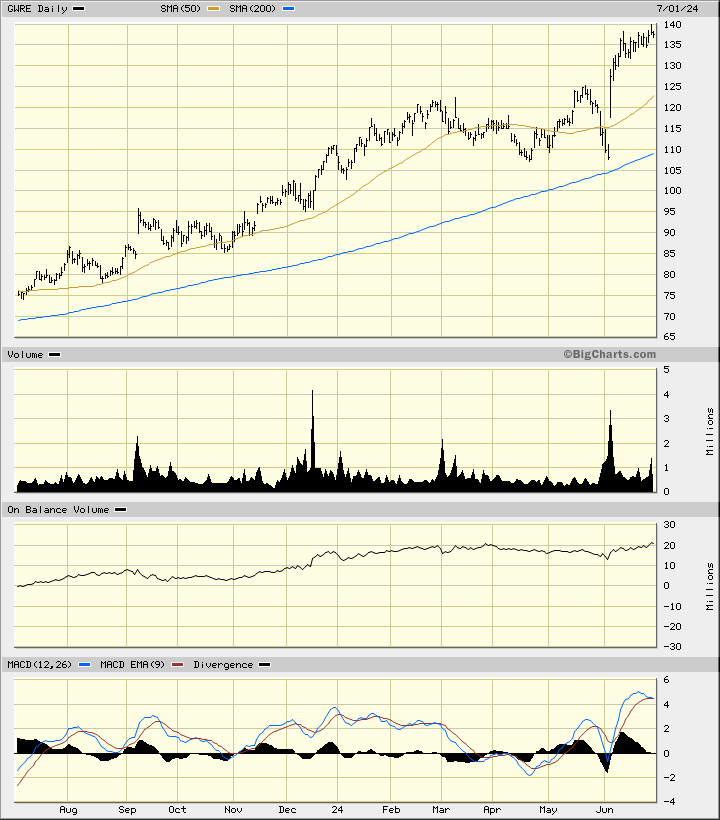
In this daily bar chart of GWRE below, I can see that prices have been in an uptrend the past year. Prices dipped down toward the rising 200-day moving average line in early June and with hindsight that looks like a buying opportunity. The daily trading volume is on the light side but the On-Balance-Volume (OBV) line has been steadily rising the past year. The Moving Average Convergence Divergence (MACD) oscillator is above the zero line but has narrowed sharply in recent days.
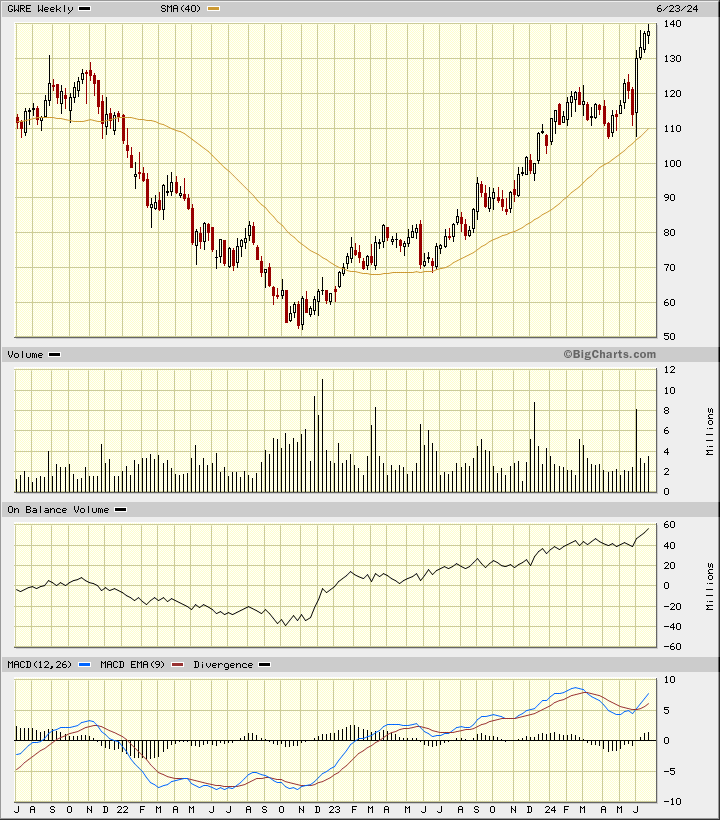
In this weekly Japanese candlestick chart of GWRE below, I see a positive picture. Prices are in a longer-term advance and trade above the rising 40-week moving average line. The trading volume has been active the past two years. The weekly OBV line shows strength since late 2022 and confirms the price gains we have seen. The MACD oscillator is in a bullish alignment above the zero line.
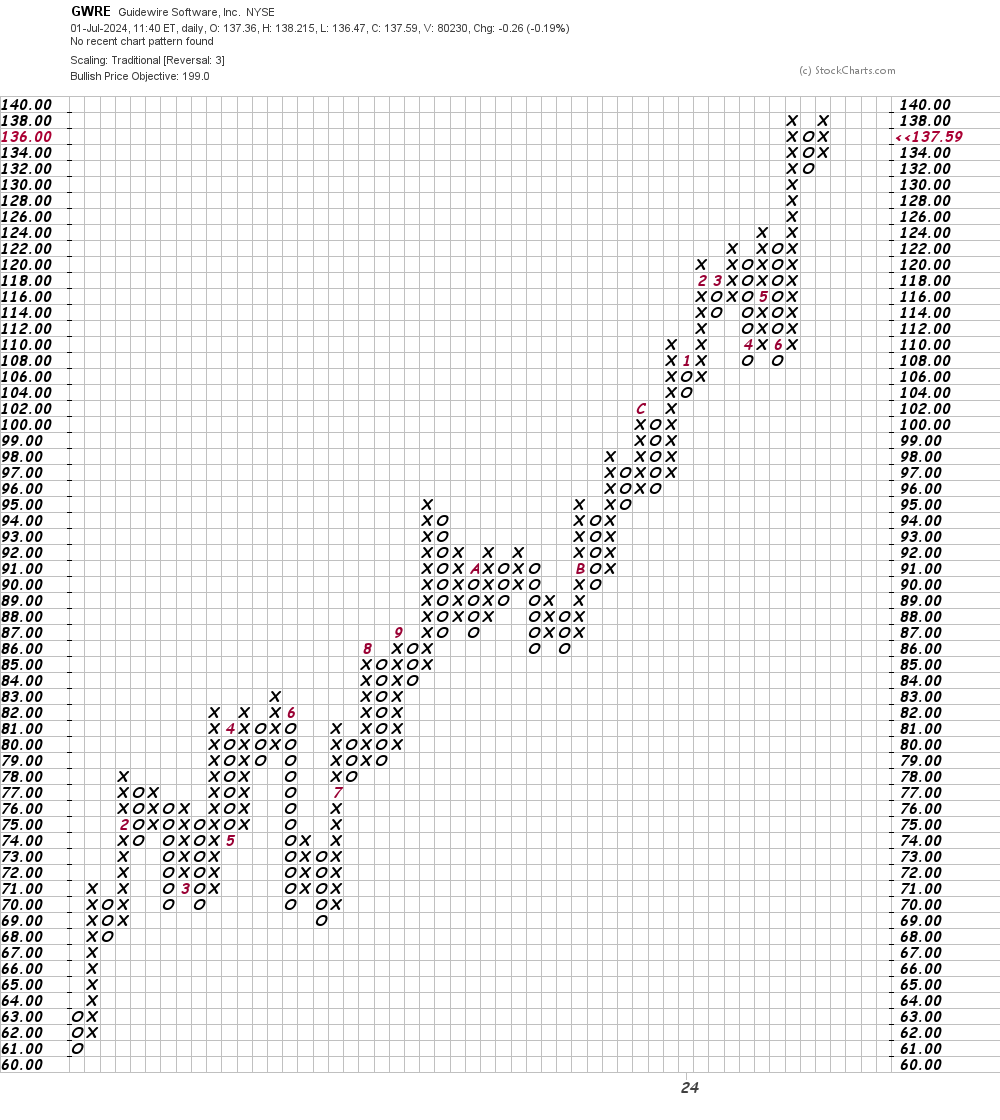
In this daily Point and Figure chart of GWRE below, I can see an upside price target in the $199 area. A trade at $140 should refresh the uptrend.
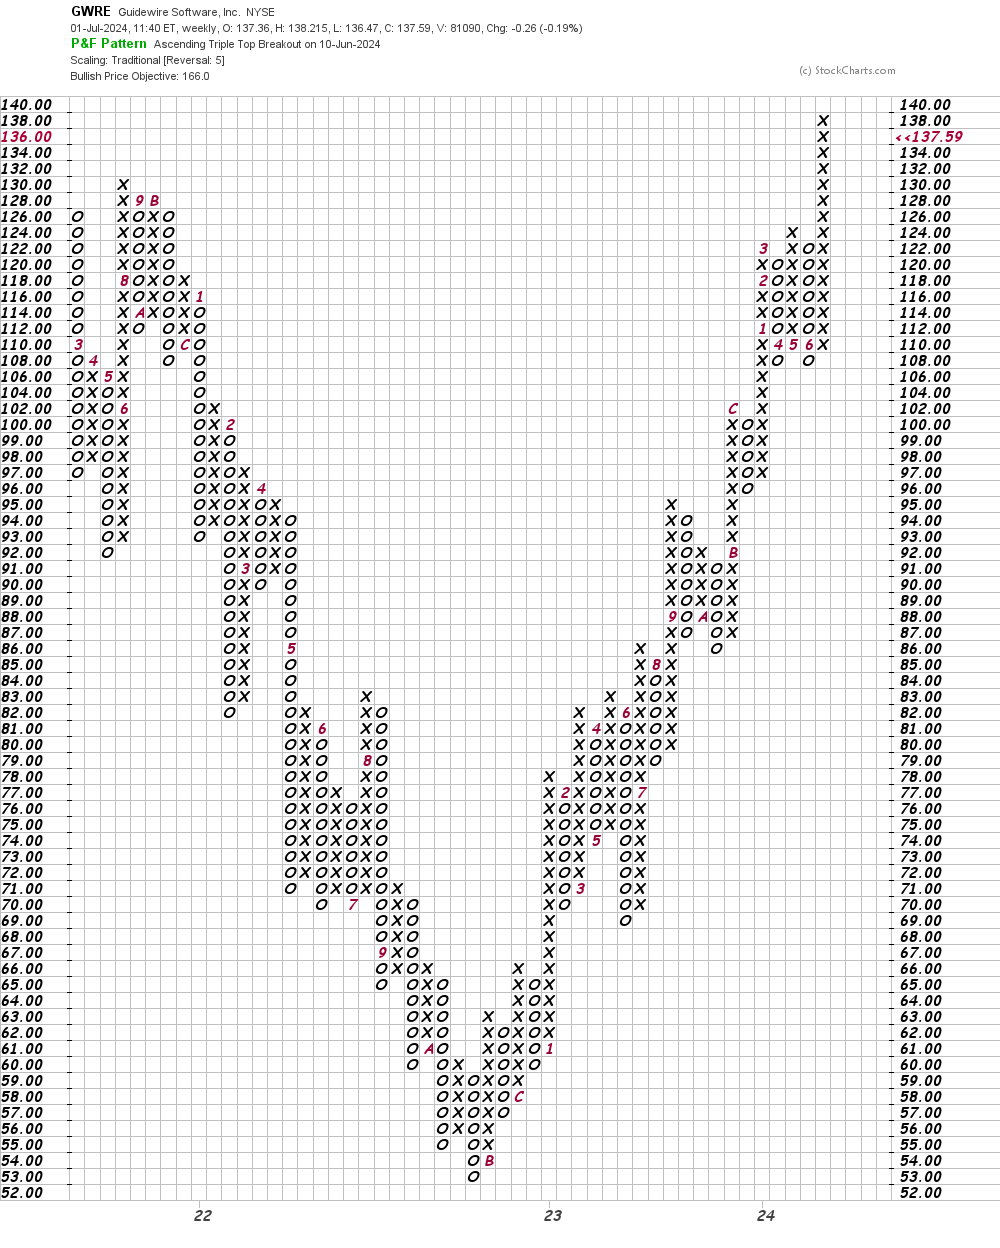
In this weekly Point and Figure chart of GWRE below, I used a five-box reversal filter. Here the software only projects a price target in the $166 area.
Bottom line strategy: GWRE may need some further sideways price action in the next week or two to correct the rally shares saw in early June. Patient traders should try to go long GWRE closer to $130. Risk to $120. The $200 area is my longer-term price target.
Employees of TheStreet are prohibited from trading individual securities.