Keeping an Eye on the Nasdaq
It's where all of the action has been. So, let's look at the indicators.
You've reached your free article limit
You've read 0 of 1 free Pro articles.

On March 26th, the Nasdaq McClellan Summation Index stopped going down. The next day it turned upward. It has been on a torrid run ever since. Heck, Nasdaq barely had a down day for the first few weeks.
But in the last seven trading days, Nasdaq has been red for four of them. While that doesn’t seem like much (it isn’t), it does tell us there has been a lot of stalling out over the last week or so. And on Tuesday, the Nasdaq McClellan Summation Index stopped going up.
It hasn’t rolled over yet. We’ll have to see how it fares in the next week, especially with all those tech earnings. Typically, the first halt in the upward movement is a stall, and then another attempt upward. Take a look at the chart, and you can see that it was quite unusual when the Summation Index turned south last summer, but the Nasdaq kept rocking upward. They typically move in tandem.
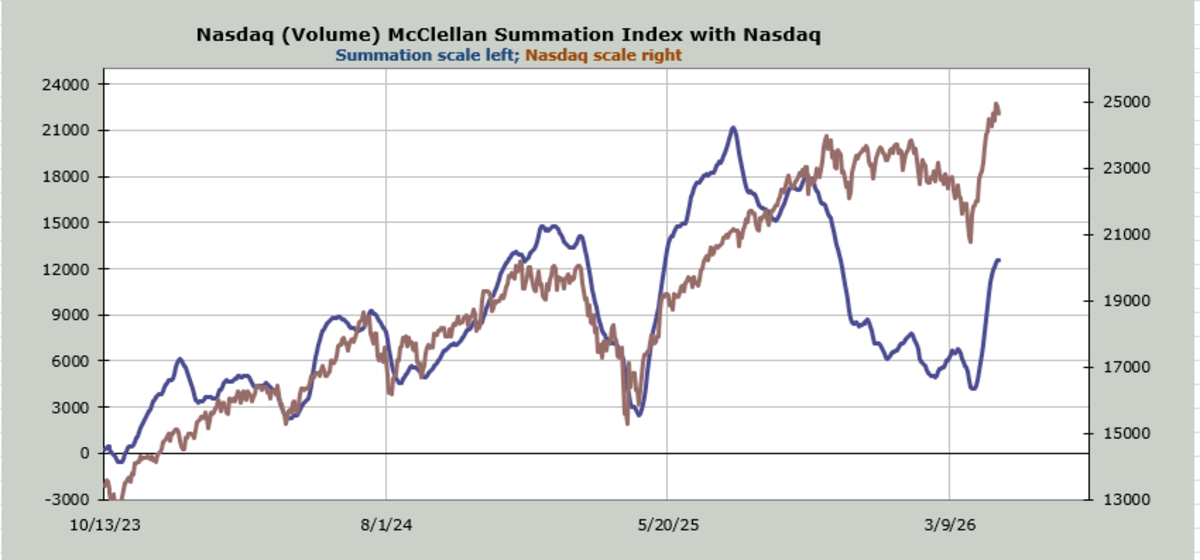
I bring all this up to you because the Nasdaq Summation Index I use is with volume (not the advance/decline line), and it will now require a net differential of +1.9 billion shares (up minus down volume) to turn this back up. It’s certainly doable, but as I have explained so often lately, the window for the market to rally is open, but if the indicators roll over, that becomes a problem.
The NYSE Summation Index still needs a net differential of -300 advancers minus decliners on the NYSE to halt its rise. So it continues upward for now.
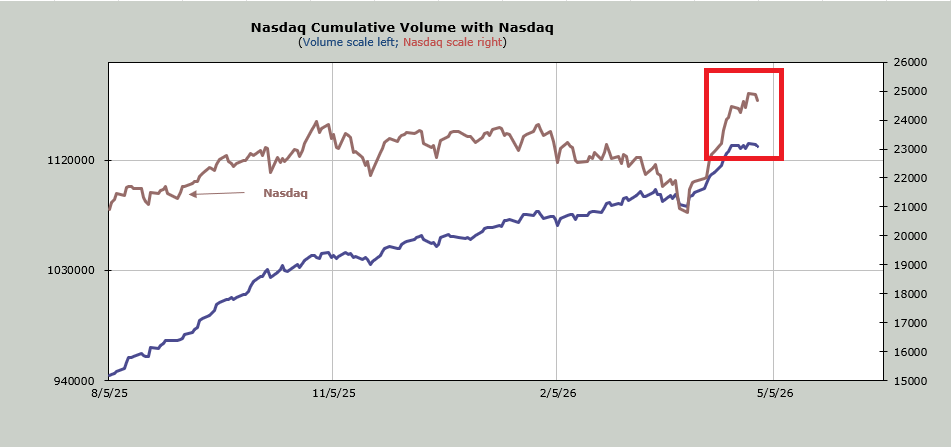
But back to Nasdaq. I track the ‘breadth’ of Nasdaq using up/down volume (not the advance/decline line as I do for the NYSE). Notice that the cumulative volume (breadth) did not take off the months between October and March (blue line), but rather it kept notching upward.
Since April 17th, the cumulative volume has stalled out while Nasdaq kept on going. It might be hard to see on the chart, but this is atypical. What is more typical is that Nasdaq goes down while the indicator keeps cranking higher. I thought of this on Tuesday because Nasdaq had its lowest volume since Christmas week on Tuesday.
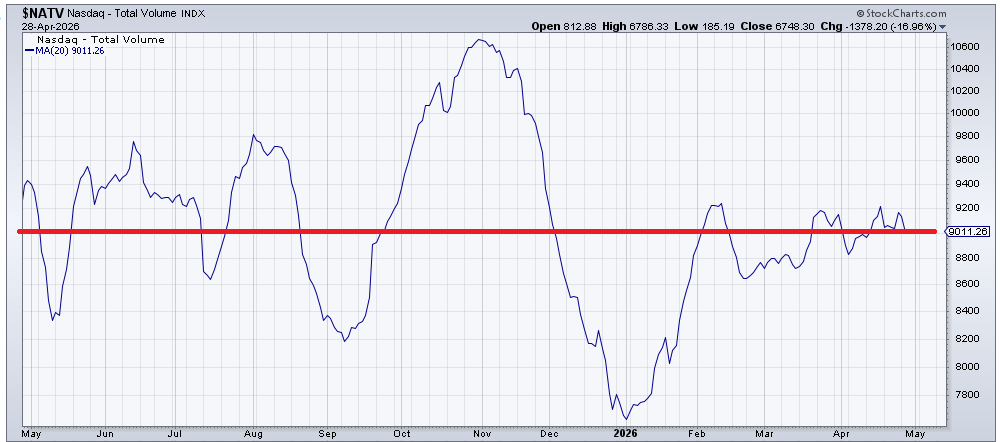
Here’s the chart of the 20-day moving average of Nasdaq volume. Notice that, unlike the rally off the lows last year, where the 20-day moving average of volume rose and stayed high, averaging well over 9 billion shares a day, this time the average volume is barely over 9 billion and still under where it was in February.
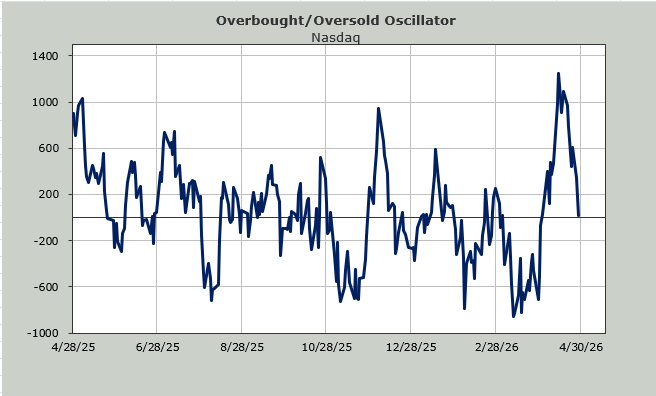
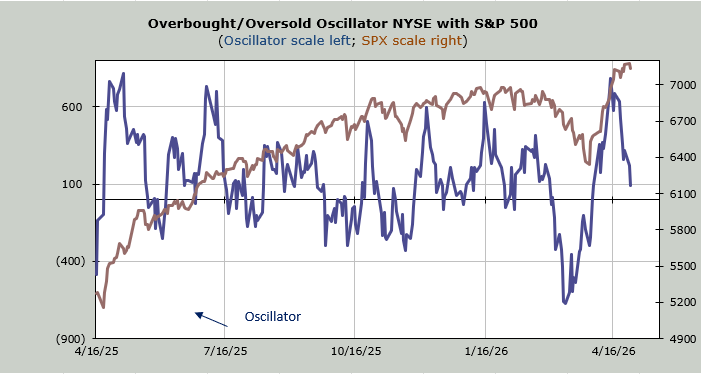
I am going to keep Nasdaq volume on my radar now because, as you can see, Nasdaq’s Overbought/Oversold Oscillator has come down to the zero line, while barely even seeing a drop in the underlying index. It still ought to rally again, but I am now quite interested to see if there is an underlying change in Nasdaq’s volume because so far it appears there might be.
And I would find that of interest because Nasdaq has been where all the action has been.
Related: Good Earnings Are Already Being Sold. Will the Mag 7 Reports Be Next?
