Weekly Roundup: Multiple Points of Confirmation for Our Portfolio Positioning
Ahead of the election and the November Fed meeting, we’ll stick to the prudent path.
You've reached your free article limit
You've read 0 of 1 free Pro articles.
Equity markets were mixed this week, juggling renewed concerns over rate cuts as the 10-year Treasury yield and the dollar moved higher as well as a greater volume of quarterly earnings reports. Economic data out this week did little to change the rolling GDP forecast tabulated by the Atlanta Fed which shows a vibrant economy. Meanwhile, Flash PMI data showed that strength likely accelerated in October with new orders hitting the highest level in almost one and half years, suggesting we’re not likely to see the economy roll over near-term.
Those developments led the 10-year Treasury yield and the dollar to strengthen this week, adding to the thinking the Fed could deliver fewer rate cuts than the market expects over the next 6-8 months. We’ve talked about this quite a bit in recent weeks, but our thinking is upcoming October data ahead of the Fed’s November policy meeting could be the set of catalysts the market needs to recalibrate its rate-cut thinking.
Because next week brings that October data and a sizable increase in quarterly earnings reports, including those from several Big Tech or “Mag 7” companies, it could be a volatile one. Recognizing a few weeks ago that is how the calendar fell, we’ve been careful in deploying cash of late, keeping somewhat higher than usual portfolio cash levels, and maintaining our position in the ProShares Inverse S&P500 ETF SH.
Heading into the weekend, while the S&P 500’s relative strength index (RSI) level retreated this week to less than 58, at more than 24x expected 2024 EPS, its valuation remains stretched. That means expectations are running high and there is room for disappointment. To that we can add the fact that the 2024 presidential race is extremely close. The final nationwide CNN poll conducted by SSRS, finds 47% of likely voters support Vice President Kamala Harris, and an equal 47% support former President Donald Trump.
While we received several batches of positive data points for our holdings this week, we have to be mindful of the market backdrop. Given the above, we’ll continue to walk the prudent path in the near term and look for new as well as existing opportunities for the portfolio to come to us.
Catching Up on the Portfolio This Week
While the S&P 500 lost some ground this week, the portfolio fared better, giving up far less than that market barometer. We were impacted by declines at more interest rate-sensitive positions, including Builders FirstSource BLDR and United Rentals URI, but the brunt of those moves were offset by gains in Labcorp LH, ServiceNow NOW, Marvell MRVL, Nvidia NVDA, and Dutch Bros BROS.
We made very few moves with the portfolio this week, opting instead to collect comments and data points from customers, competitors, and suppliers of our holdings where we could. Those nuggets proved insightful and constructive for our construction-related holdings as well as our data center and AI chip ones, but also hinted that we could see another round of capex increases from Big Tech next week. We discussed that in greater detail with Friday’s video as well as laid out our plan for Apple AAPL given their quarterly earnings report next week. Those comments follow ones from Verizon (VZ) and AT&T (T) about their having yet to see the much-touted iPhone upgrade cycle emerge.
The moves we made included boosting our panic points for Dutch Bros, Marvell, and Morgan Stanley MS shares, and adding to our position in Lockheed Martin LMT following its quarterly results as well as upgrading the shares to a One rating and upping our price target. Following September-quarter results from United Rentals URI, we left our rating and price target unchanged, while our post-earnings move for Labcorp shares was to lift our target to $260 from $235.
We also shared our thoughts as to why we think Arm’s (ARM) canceling a licensing agreement with Qualcomm QCOM was a negotiation tactic and what the likely outcome will be. Despite the improving smartphone market and AI PC opportunity, this development is likely to bring a larger cloud of uncertainty over Qualcomm’s shares that won’t be lifted until we know the outcome. Odds are this means the stock will be rangebound despite the favorable data points likely in the next few weeks.
Now let’s look at what Wall Street had to say about the portfolio’s holdings this week:
Barclays lifted its Labcorp price target to $249 from $234, while Baird, citing robust expectations for the company’s Diagnostics business, upped its to $289 from $282.
Bernstein increased its Meta price target to $675 from $600 following ad-buyer checks and its view the company is an “AI winner.” While it may seem like a coincidence, Jefferies made the same move with its META price target this week.
Above we noted we kept our United Rentals target intact, but Citi increased its above-consensus price target on the shares to $955 from $930 citing better 2025 prospects. BofA boosted its target to $910 from $800.
We saw some shuffling with target prices for Lockheed Martin as TD Cowen boosted its to $610 from $560, Susquehanna lowered its to $695 from $705, and RBC Capital trimmed its target to $665 from $675.
An early look at Apple’s iOS 18.2 beta release, which we touched on in Friday’s video, was found by Citi to have most of the Apple Intelligence features Apple promised at its June developer conference. And confirming that expectations for Apple’s quarterly earnings next week are all over the map, Morgan Stanley sees a September-quarter beat but a soft guide from the company, while BofA sees a “modest” beat and “better than expected guidance, while the shares caught a rare downgrade to Underweight from KeyBanc.
Following our recent price target increase for Mastercard MA shares, Bernstein upped its target to $560 from $500 this week.
The folks at Bernstein also initiated coverage on Costco COST this week with an Outperform rating and a $1,016 price target. Typically, we see folks stick to round numbers of multiples of five in their price targets.
BMO Capital Markets reiterated its Outperform rating and $230 target for Amazon AMZN shares and raised its Q3 2024 Amazon Web Services cloud growth forecast to 20%. Much like us, BMO sees Amazon taking consumer wallet share during the quarter.
And while it’s not necessarily Wall Street, The New York Post reports Bank of America BAC could be the target of activist investors.
This Week's Portfolio Videos
We cover a lot of ground during the week in our Daily Rundowns. If you happened to miss one or more of them, here are some helpful links:
Monday, October 21: Here's Our Game Plan for the Week Ahead
Tuesday, October 22: Tying the Day's Biggest Results to Our Positions
Wednesday, October 23: Why We're Buying More Lockheed Martin
Thursday, October 24: IBM's AI Business Shows Positives for These Holdings
Friday, October 25: What Could Push Us to Pick Up More of This Big Tech Holding
Key Global Economic Readings
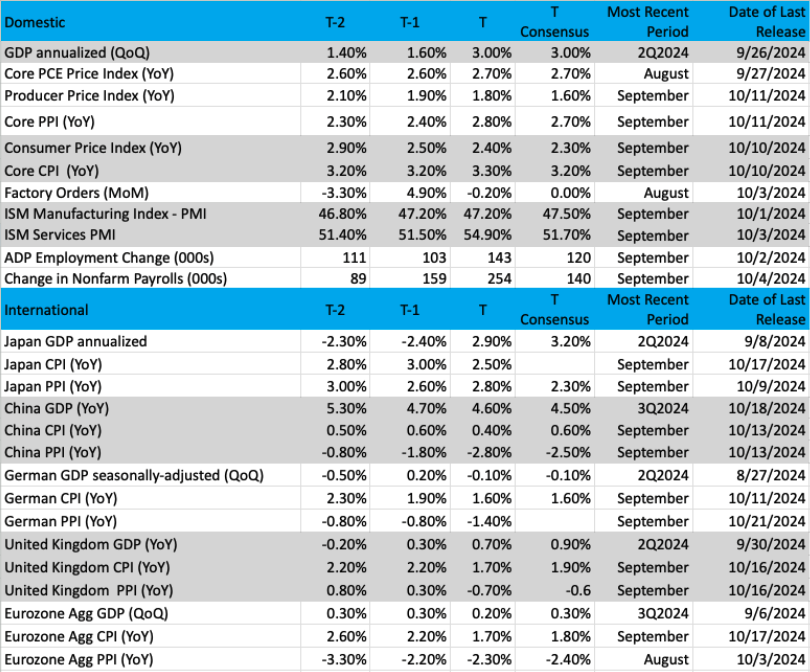
(Note: T is the most recent period, T-1 is the prior period's reading and T-2 is two periods back, the intent being to illustrate any trends)
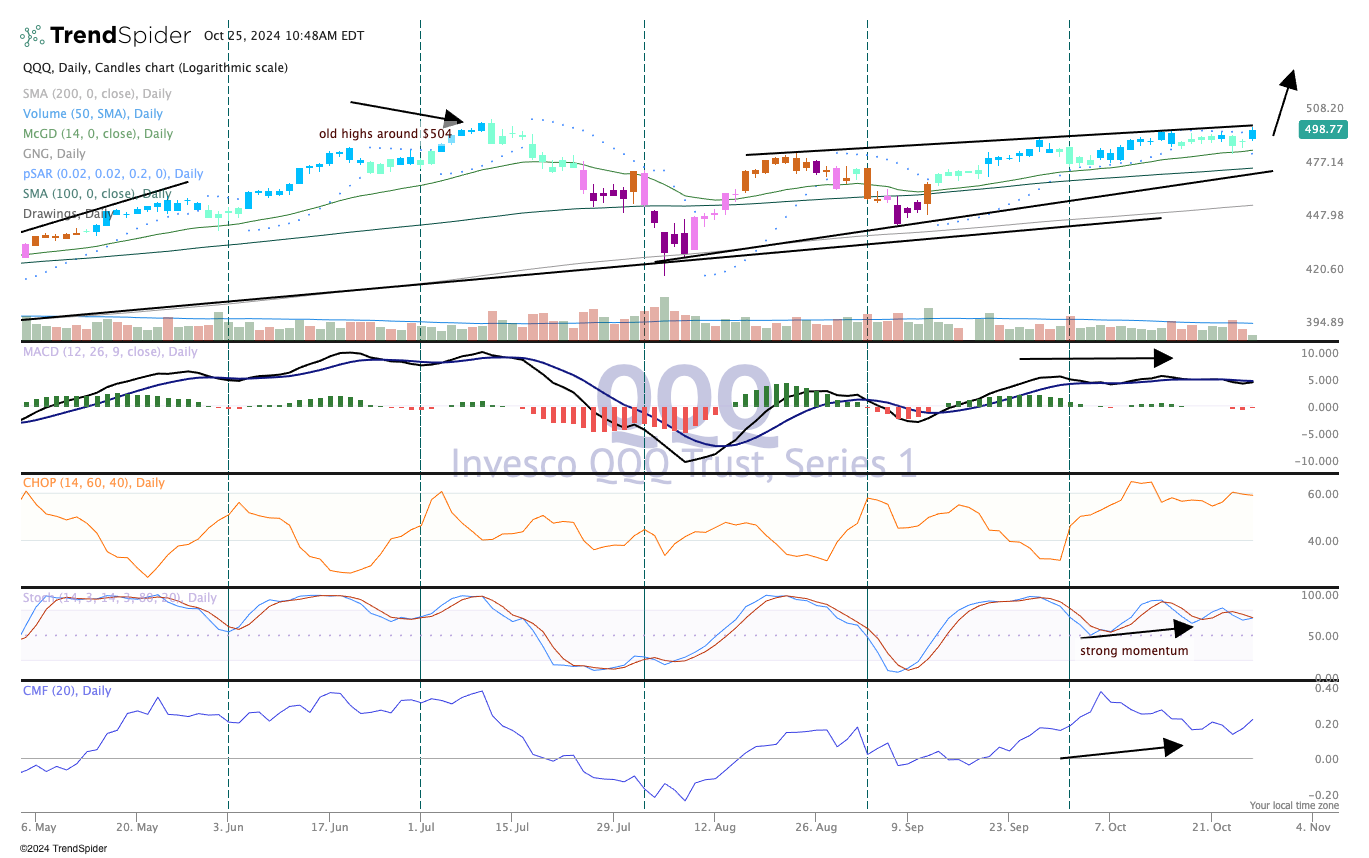
Chart of the Week: The Nasdaq 100 (QQQ)
As we discussed in Friday’s Daily Rundown video, we have a big week coming up with earnings from the largest tech companies. We’ll hear from portfolio names such as Apple AAPL, Amazon AMZN, Alphabet GOOGL, Meta META and Microsoft MSFT, among others.
On Monday, we took a longer-term view of the QQQ using a weekly chart to get a smoother look at the trend, which is in alignment with the more volatile daily chart. This is due to a flattening out in Nasdaq market volatility, which means the market (QQQ) is just drifting, the bias is up. With this week’s Chart of the Week, we look at the daily chart so we can get a better picture of the short-term trend, which could be moved by those earnings releases next week.
At this point, the QQQ is about 1% away from the all-time high reached in July. The ETF had a major spill in August, as most stocks did, when the indexes nosedived on August 5. However, the QQQ has shown great relative strength and is higher by about 17.5% since that day, just under three months ago. That is some good performance, but as we head into a seasonally strong period the momentum is there for a much larger move.
One reason we see the QQQ moving much higher over the coming weeks is a tendency for fund managers to "follow the money." Let’s face it, fund managers want to be paid for their work and that requires beating a "bogey" or target, usually on an annual basis. One such bogey is the QQQ, another one is the SPY. The QQQ was the best-performing ETF in 2023, higher by 54% but is only second this year, trailing the SPY. We think they will trade places by the end of 2024 with the QQQ finishing on top, as more fund managers, investors, mutual funds, and banks buy the big names that are considered "reliable" and with the best earnings.
The technical condition of the QQQ is strong. Notice in the top pane there are mostly blue candles, which is bullish on the GoNoGo. These candles have been blue for most of the last six weeks. Money flow at the bottom (Chaikin) has been robust and remains positive. Meanwhile, stochastics (momentum) are turning higher; this indicator has been bullish all month long.
Earnings next week will be interesting to watch and how they will move the QQQ, perhaps to new highs very soon.
Other charts we shared with you this week were:
Monday, October 21: Nasdaq 100 (QQQ) - QQQ Is Heading for All-Time Highs
Tuesday, October 22: ServiceNow (NOW) - This Tech Holding May Be Due for a Rest
Wednesday, October 23: Cisco Systems (CSCO) - A Bullpen Stock Quietly Nears Historical Highs
Thursday, October 24: PepsiCo (PEP) - This Portfolio Stock Could Use a Jolt
Friday, October 25: Builders FirstSource (BLDR) - This Holding Is Making a Run Higher on Continued Strength
The Week Ahead
The final trading days of October will bring back-to-back waves of economic data and September-quarter earnings. What’s not coming at us? Fed Speakers. That’s right, as of Saturday, October 26, the Fed enters its next blackout period ahead of its November policy meeting, which concludes on Thursday, November 7. That’s a day later than the typical Wednesday announcement and reflects November 5 being Election Day.
Heading into the weekend, the latest update for the Atlanta Fed’s GDPNow model puts 3Q 2024 GDP at 3.3%, down a tick following September Durable Good data on Friday. We’ll see how right that model is on Wednesday when we get the first look at 3Q 2024 GDP as well as the PCE price index for the quarter. A day later, the final September PCE Price Index data will be published, and the market expects to see it inch lower compared to August.
Alongside those inflation figures, we’ll also get a snapshot of September's personal income data. Because we are approaching the start of the holiday shopping season, those figures and what they say about consumer spending firepower for the next two to three months are bound to be a focal point for investors and folks long retailers.
The other wave of economic data coming next week falls in the job creation camp. Indications from the October Flash PMI report this week point to a slightly weaker figure compared to September’s 254,000 non-farm payroll print but not something as low as the average figure of 140,000 for June, July, and August. More than likely we’ll see some jockeying of expectations for Friday’s Employment Report once ADP publishes its October Employment Change Report on Wednesday. Should it suggest a far weaker jobs data for Friday, it would likely lead to renewed calls for a 50-basis point rate cut by the Fed the following week vs the 25-basis point consensus.
As of now, we give the odds of a sharp drop in the October jobs figure and a November 50-basis point rate cut a low probability, but as fresh data is had, we’ll revisit those likelihoods. If anything, stronger-than-expected October jobs figures and a 3Q 2024 GDP print that’s near the current Atlanta Fed GDPNow forecast would do more to raise questions over whether the Fed should cut in November. Again, we’ll let the coming data talk to us and position the portfolio accordingly.
Here's a closer look at the economic data coming at us next week:
U.S.
Tuesday, October 29
· FHFA Housing Price Index – August (9:00 AM ET)
· S&P Case-Shiller Home Price Index – August (9:00 AM ET)
· JOLTS Job Openings & Quits – September (10:00 AM ET)
Wednesday, October 30
· MBA Mortgage Applications Index – Weekly (7:00 AM ET)
· ADP Employment Change Report – October (8:15 AM ET)
· GDP (Advanced Look), PCE Price Index - 3Q 2024 (8:30 AM ET)
· Pending Home Sales – September (10:00 AM ET)
· EIA Crude Oil Inventories – Weekly (10:30 AM ET)
Thursday, October 31
· Initial & Continuing Jobless Claims – Weekly (8:30 AM ET)
· Employment Cost Index – 3Q 2024 (8:30 AM ET)
· Personal Income & Spending, PCE Price Index – September (8:30 AM ET)
· EIA Natural Gas Inventories – Weekly (10:30 AM ET)
Friday, November 1
· Employment Report – October (8:30 AM ET)
· S&P Global Final Manufacturing PMI – October (9:45 AM ET)
· ISM Manufacturing Index – October (10:00 AM ET)
· Construction Spending – September (10:00 AM ET)
International
Monday, October 28
· China: Industrial Profits - September
Tuesday, October 29
· Germany: GfK Consumer Confidence – November
· UK: Bank of England Consumer Credit - September
Wednesday, October 30
· Japan: Consumer Confidence – October
· Eurozone: Flash GDP Growth Rate – 3Q 2024
· Eurozone: Economic Sentiment, Consumer Confidence - October
Thursday, October 31
· China: NBS Manufacturing & Non-Manufacturing PMI – October
· Japan: Bank of Japan Interest Rate Decision
· Germany: Retail Sales – September
· Eurozone: Inflation Rate (Flash) - October
Friday, November 1
· Japan: Jibun Bank Manufacturing PMI – October
· China: Caixin Manufacturing PMI – October
· UK: S&P Global Manufacturing PMI - October
We have a big week of earnings next week with more than 900 companies reporting, 169 of which are S&P 500 constituents. The pace will be fast and furious and could bring about some market volatility in large part because mixed in that sea of reports will be the ones from Alphabet (GOOGL), Microsoft (MSFT), Meta (META), Amazon (AMZN), and Apple (AAPL).
We say that not because those five stocks are portfolio holdings but because together, they account for ~23% of the S&P 500 and nearly 30% of the Nasdaq Composite. In Friday’s Daily Rundown video, we shared what could lead them to trade off following their reports and our plan for them should that be the outcome.
Other portfolio companies reporting next week include Mastercard (MA), Vulcan Materials (VMC), Eaton (ETN), and Universal Display (OLED). We’ll also continue to mine the reports and conference calls for customers, competitors, and suppliers for our holdings.
In addition to comments about the September quarter and prospects for the current one, we’ll also be looking and listening for those initial 2025 expectations. While few have given any specific guidance for the coming year, some, like our own United Rentals (URI) this week, are sharing what we would call directional thoughts about revenue, margins, and some other figures.
As we collect more of them, we’ll be eyeing the current market consensus for S&P 500 EPS this year and for 2025. Should we see those expectations soften, it would lower the earnings hurdle rate we use to identify new opportunities for the portfolio, but it would also make the market’s P/E valuation richer. Rest assured, we’ll share our findings and their implications with you as well as any needed tweaking of the portfolio.
Here's a closer look at the earnings reports coming at us next week:
Monday, October 28
· Open: On Semiconductor (ON), Philips (PHG)
· Close: Crane (CR), F5 Networks (FFIV), Ford Motor (F), Rambus (RMBS), Trex (TREX), VF Corp. (VFC), Welltower (WELL).
Tuesday, October 29
· Open: American Tower (AMT), BP (BP), Check Point Software (CHKP), Comcast (CMCSA), Corning (GLW), DR Horton (DHI), Masco (MAS), McDonald’s (MCD).
· Close: Advanced Micro Devices (AMD), Alphabet (GOOGL), Chipotle Mexican Grill (CMG), Meritage (MTH), Mondelez International (MDLZ), Qorvo (QRVO), Snap (SNAP), Visa (V).
Wednesday, October 30
· Open: AbbVie (ABBV), Caterpillar (CAT), Extreme Networks (EXTR), Martin Marietta (MLM), Terex (TEX), Vulcan Materials (VMC).
· Close: Casella Waste (CWST), Clorox (CLX), DoorDash (DASH), Equinix (EQIZ), Floor & Décor (FND), Invitation Homes (INVH), KLA Corp. (KLAC), Meta Platforms (META), Microsoft (MSFT), Starbucks (SBUX), Universal Display (OLED).
Thursday, October 31
· Open: Anheuser-Busch InBev (BUD), Bandwidth (BAND), Eaton (ETN), Estee Lauder (EL), InterDigital (IDCC), Lazard (LAZ), Mastercard (MA), Radware (RDWR), STMicroelectronics (STM), Utz Brands (UTZ).
· Close: Amazon (AMZN), Apple (AAPL), Intel (INTC).
Friday, November 1
· Open: Cboe Global Markets (CBOE), Charter Communications (CHTR), Chevron (CVX), Church & Dwight (CHD), Exxon Mobil (XOM).
Portfolio September-Quarter Earnings Schedule
Below is a mixture of announced and tentative reporting dates for the portfolio’s holdings. As we move deeper into the September-quarter earnings season, we’ll be updating this list as needed:
October 22: Lockheed Martin (LMT)
October 23: United Rentals (URI)
October 24: Labcorp (LH)
October 28: Waste Management (WM)
October 29: Alphabet (GOOGL)
October 30: Vulcan Materials (VMC), Meta Platforms (META), Microsoft (MSFT), Universal Display (OLED)
October 31: Eaton (ETN), Mastercard (MA), Amazon (AMZN), Apple (AAPL)
November 5: Builders FirstSource (BLDR)
November 6: Dutch Bros (BROS), Qualcomm (QCOM)
November 7: Axon (AXON), Trade Desk (TTD)
November 14: Applied Materials (AMAT)
Portfolio Investor Resource Guide
· Economic Data: Here's a List of Links to the Key Economic Data We Closely Watch
· Investing Terminology: 16 Key Terms Club Members Should Know
· 10-Ks: Want to Know About a Stock? Read the Company's Reports
· 10-Qs: Unlock the Numbers and Key Information Behind Your Stock With the 10-Q
· Income Statement: Our Cheat Sheet to Understanding This Financial Document
· Balance Sheet, Cash Flow Statements, and Dividends: How to Know If a Company Is Off-Kilter? Read Its Balance Sheet
· Valuation Metrics: Everyone Wants a Value. Here's How Investors Can Find
The Portfolio Ratings System
1 - Buy Now (BN): Stocks that look compelling to buy right now.
2 - Stockpile (SP): Positions we would add to on pullbacks or a successful test of technical support levels.
3 - Holding Pattern (HP): Stocks we are holding as we wait for a fresh catalyst to make our next move.
4 - Sell (S): Positions we intend to exit.
