Weekly Roundup: Extreme Fear Flashes as Selloff Delivers an Oversold S&P 500
During another tough week for the market, we added to four holdings, upped a price target, and discussed other potential buying opportunities.
You've reached your free article limit
You've read 0 of 1 free Pro articles.
 Wall Street
With two trading days to go in March, the month has been one of the more challenging ones we’ve seen in some time. It’s also see the longest losing streak in the market since 2022.
We’ve covered the details behind that, including the U.S.-Iran conflict and ongoing uncertainties, increases in energy prices, and issues with the Strait of Hormuz that are rekindling inflation pressures, poised to sap consumer spending dollars, and kick-started conversations about potential Fed rate hikes.
As we walked through on Thursday afternoon, the confluence of those factors, along with Iran appearing to control the peak talk narrative and attacks in the Middle East continuing, have kept market anxiety levels elevated. At a reading of 10, the Fear & Greed Index is flashing "Extreme Fear," and as we closed out the week, the Volatility Index moved above 30, more than 100% higher than where it closed in 2025.
Friday morning, we shared our thinking that potential weekend uncertainty would likely lead short-term traders to be in a risk-off mode with their portfolios as they prepared for the weekend. That led the S&P 500 to cross into an oversold condition, with an RSI reading below 29 on Friday afternoon. And the Nasdaq Composite wasn’t far behind as its RSI figure floated just above 30.
Normally, we would say that some good news would likely drive a rebound in the market, but following the head fake the market received this past Monday morning, it’s going to take a bit more for a sustained rebound to emerge. In all likelihood, that will be joint statements on successful peace negotiations from the U.S. and Iran as well as spelled-out plans to reopen the Strait of Hormuz. Could we get that before Trump’s April 6 deadline? TBD.
However, with what is shaping up to be at least a full month of impact from the conflict, higher energy prices, and those other factors we rattled off above, we continue to think there is room for disappointment from the upcoming March-quarter earnings season and the guidance issued. With that in mind, we will want to navigate carefully over the coming days and weeks, picking our spots along the way and paying close attention to fundamental and technical setups as we do so.
While not pleasant to remember, we have been in similar situations over the last few years, including two in 2024 and another two in 2025. We’ve used that market pain to make some productive moves with the Portfolio, and we’ll aim to repeat those past successes.
Enjoy your weekend. Saturday’s Signals alert will be replaced this week by an in-depth interview from Cheddar’s Big Business This Week program. Next week, ahead of the Easter holiday, we'll have our March Monthly Roundup in your hands.
I’ll see you back here, bright and early on Monday.
Catching Up on the Portfolio This Week
We’ll cut to the chase. The market’s continued decline was felt in the Pro Portfolio’s individual stock positions as well as the EPS Diplomats basket.
Declines in Meta (META) , Axon (AXON) , Arista Networks (ANET) , and new holding Applied Materials (AMAT) were offset by week-over-week gains in SuRo Capital (SSSS) , United Rentals (URI) , Marvell (MRVL) , Costco (COST) , Labcorp (LH) , and Apple (AAPL) . Several other holdings, including American Express (AXP) , Bank of America (BAC) , and TJX Companies (TJX) outperformed the S&P 500 and Nasdaq Composite on a relative basis this week. Even so, along with the market, the Portfolio decreased week over week.
The market’s continued and widespread decline (see Bob’s analysis of the equal-cap-weighted S&P 500 vs. the market-cap-weighted S&P 500, below), reverberated through our EPS Diplomats basket. While that reduced the quarter-to-date gain, the basket continued to be an outperformer compared to the S&P and a positive influence on the Portfolio with its quarter-to-date gain of just under 1% vs. the almost 7% fall in the S&P and the near 10% drop for the Nasdaq Composite.
The only trades we made with the Portfolio were on Monday, and they included exiting our market-hedging inverse position in ProShares Short S&P 500 ETF (SH) , given the extremely oversold state of the market coming into the week. We used those proceeds and a modicum of cash to pick up more shares of American Express (AXP) , Netflix (NFLX) , Arista Networks (ANET) , and Applied Materials (AMAT) .
Subsequent to those trades, we found the 2026 shareholder letter from American Express very supportive of our investment thesis on the shares. It also showcased how the company is leveraging AI. Tuesday, compelling levels to pick up more shares of Axon (AXON) . On Wednesday, we reviewed Bank of America’s (BAC) fresh Buy rating on Microsoft (MSFT) as we trimmed our price target to $500. On Friday, we lifted our price target on Netflix (NFLX) following word of an upcoming price hike.
We’ve seen a few questions about ServiceNow (NOW) , with the shares once again being volatile. Our plan is to let the upcoming remaining performance obligations (RPOs) guide our decision, as they will inform us whether AI is eating into the company’s business. Our thinking is that ServiceNow will leverage AI models to build more robust software tools, helping customers overcome data silo issues. We also question whether companies behind AI models, like OpenAI and Anthropic, are keen to build out their organizations to cater to enterprise clients.
This coming Tuesday, March 31, you will see us begin our next reconstitution for our EPS Diplomats basket. We will close out all of the positions in the current basket that will not be carried forward into Q2 2026. On Wednesday, April 1, we will use those proceeds not only to buy the new basket holdings, but also upsize the position size for the remaining ones to 0.5%. As a reminder, with this EPS Diplomats reconstitution, we are increasing the Portfolio’s exposure to 4% of its assets from 2%. This means each of the eight holdings in the basket will account for 0.5% of the Portfolio’s assets as we start the quarter. We expect to issue these buy trades before the market opens on Wednesday to give members ample time to get their ducks in a row.
Depending on market conditions and the Portfolio’s cash levels, some additional prudent portfolio management may accompany our actions on Tuesday or Wednesday. On Friday, we also noted that shares of Meta (META) , Alphabet (GOOGL) and Microsoft (MSFT) were in an oversold condition.
We’ve also noted we are closely tracking Axon (AXON) , and given its position size, we have room for some additional shares. The same goes for Broadcom (AVGO) , Applied Materials (AMAT) , and Netflix (NFLX) . We’ll balance potential moves against homework that favors the companies with the best fundamentals and EPS prospects, and constructive technicals.
Now let’s see what others on Wall Street had to say about the Portfolio’s holdings during the week:
Monday – Bank of America trimmed its Apple (AAPL) target to $320 from $325, while Morgan Stanley shared survey results that found iPhone share gains and average selling price growth. The firm now sees Apple as the only major smartphone vendor taking share in 2026, with switching rates improving to five-year highs.
Tuesday – Erste Group upgraded Netflix (NFLX) shares to Buy from Hold, while Bank of America reinstated coverage on Microsoft (MSFT) with a Buy and a $500 target.
Wednesday – Jefferies initiated coverage on Bank of America (BAC) shares with a $60 target. Tigress Financial lifted its Amazon (AMZN) target to $315 from $305, while JPMorgan took its AMZN target to $280 from $265, and Citi put its at $285, up from $265. UBS trimmed its Microsoft target to $510.
Thursday - BMO Capital initiated coverage on Eaton (ETN) with an Outperform rating and a $428 target. Wells Fargo upped its Welltower (WELL) target to $228 from $218 as it continues to view senior housing as a preferred sector within the REIT space with fundamentals pointing toward same-store net operating income growth. On that we agree.
Friday - Wells Fargo lifted its Alphabet (GOOGL) target to $397 from $387, while Oppenheimer boosted its Netflix (NFLX) target to $135 from $125.
This Week's Portfolio Videos
We cover a lot of ground during the week in our Daily videos. If you happened to miss one or more of them, here are some helpful links:
Monday, March 23: A Flurry of Moving Market Storylines and Today’s Trades
Tuesday, March 24: Did Trump's Iran Update Mark a Real Market Turning Point?
Thursday, March 26: Looking Past U.S.-Iran to the Market’s Next Potential Challenge
Friday, March 27: What Do Palantir and Apple Have in Common?
Key Global Economic Readings
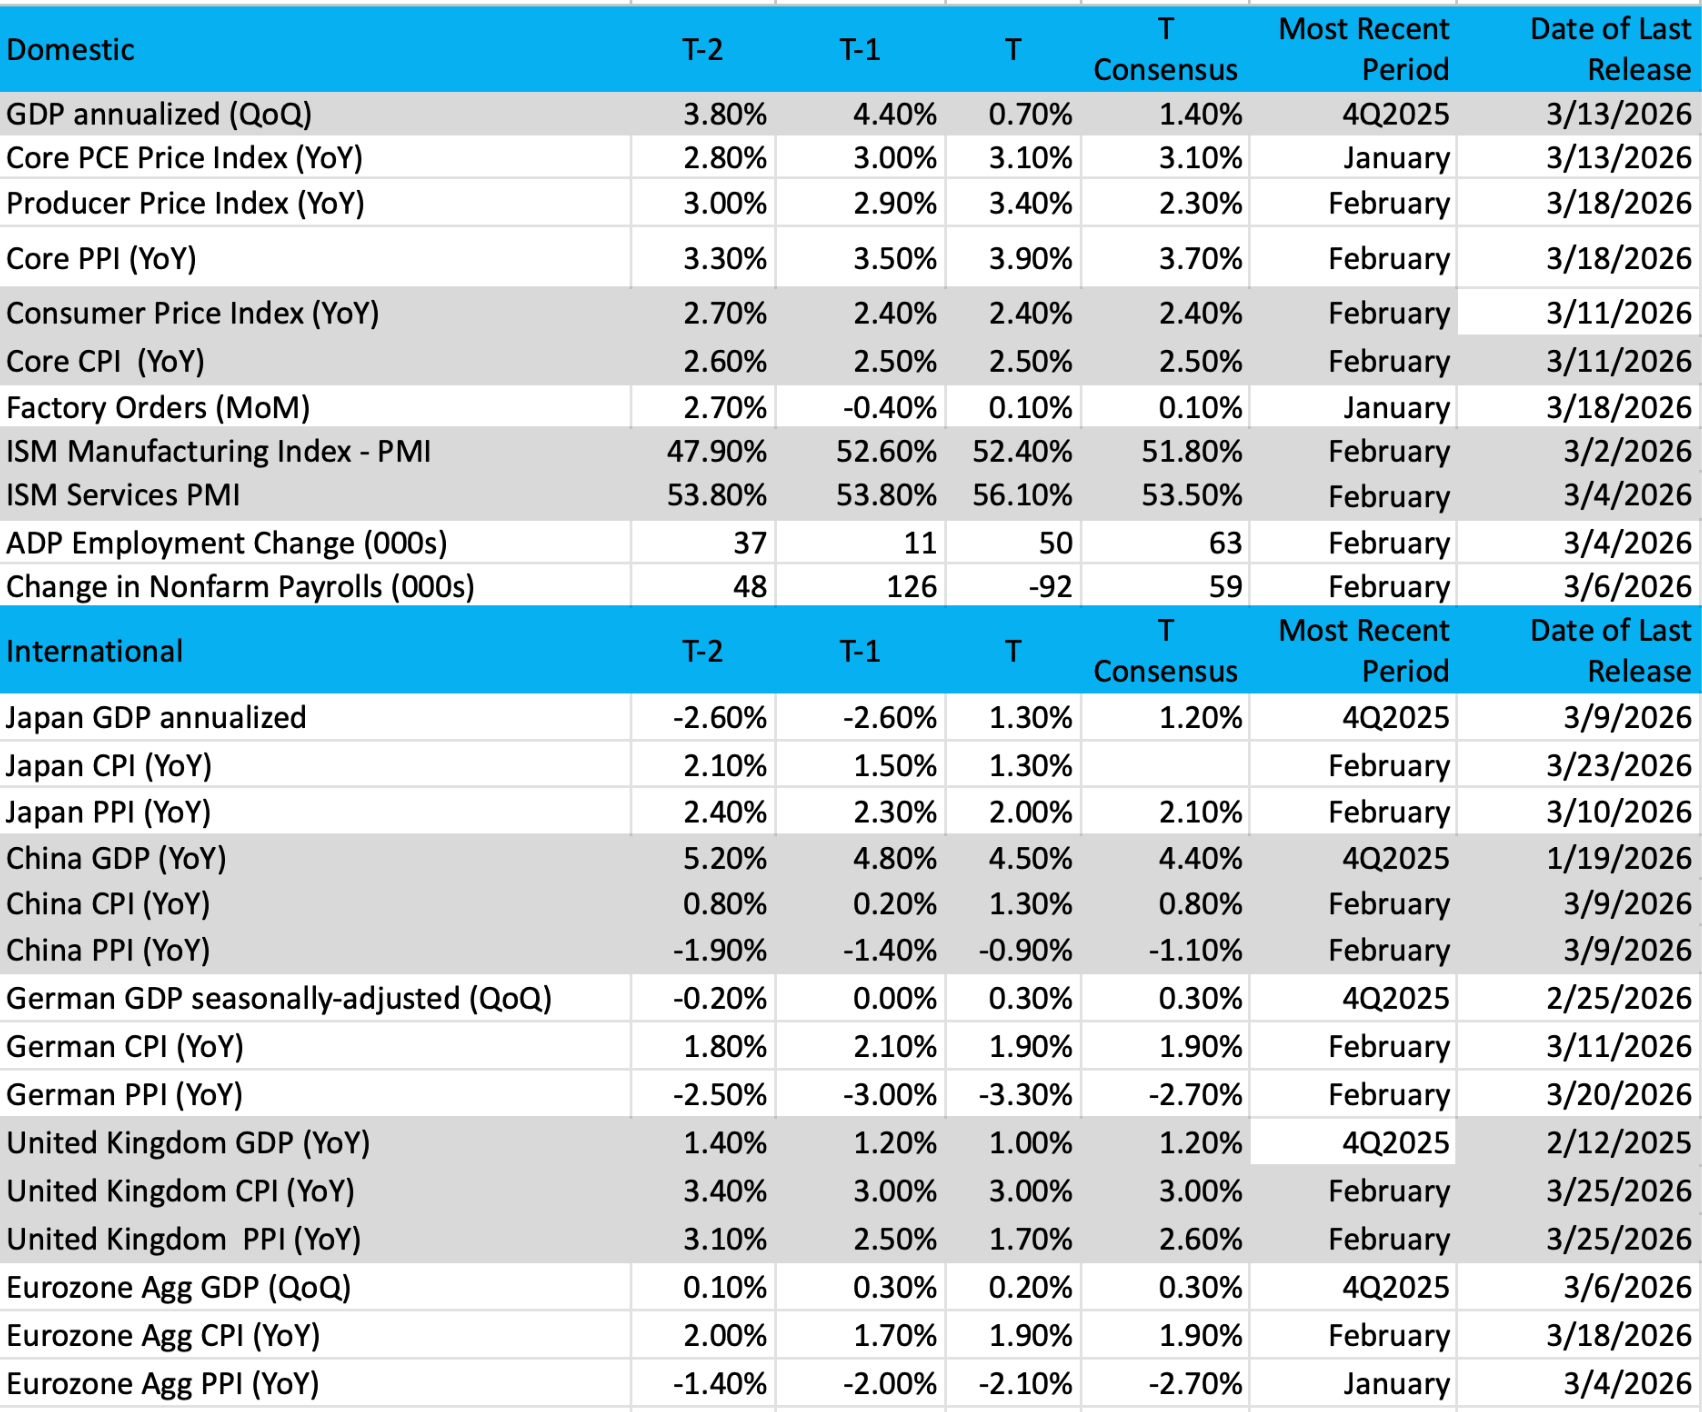
(Note: T is the most recent period, T-1 is the prior period's reading, and T-2 is two periods back, the intent being to illustrate any trends.)
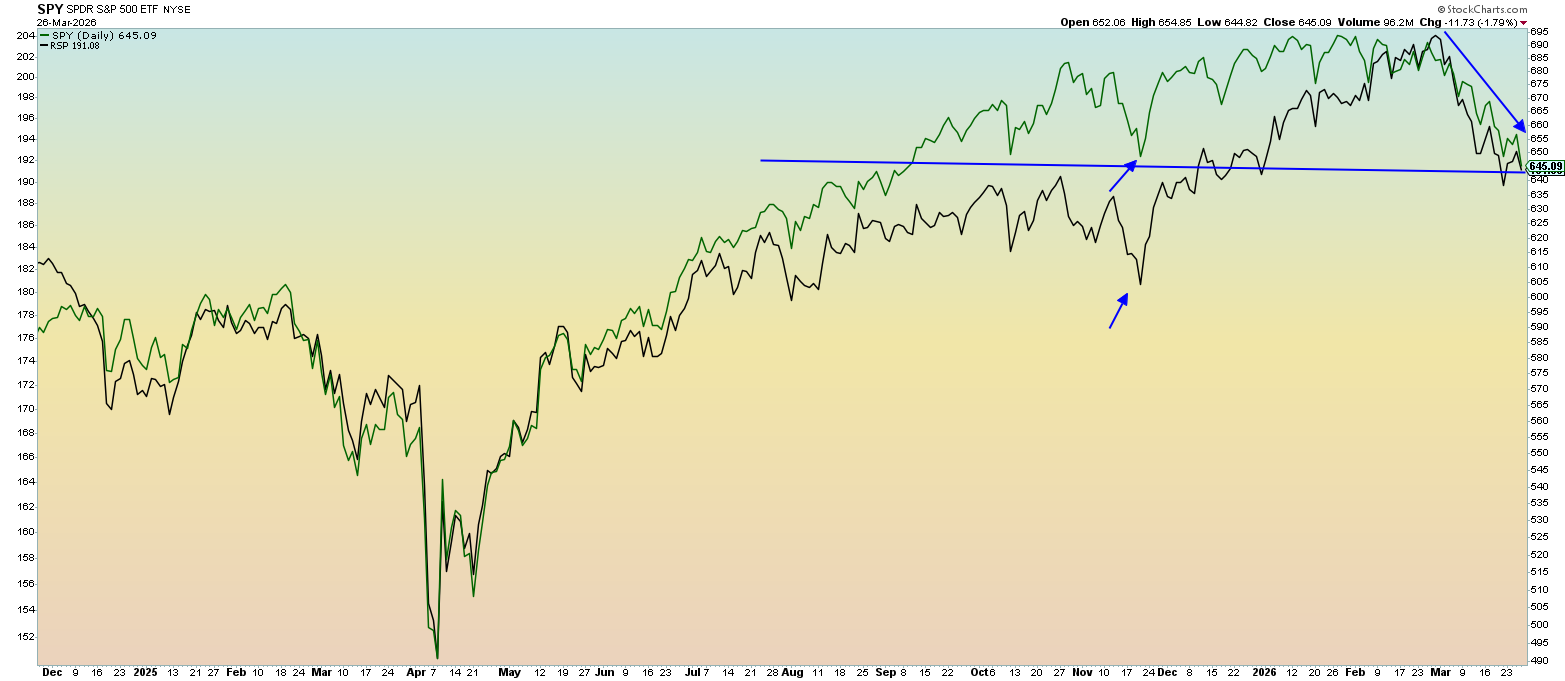
Chart of the Week: S&P 500 – Market Cap vs. Equal Weighted
As we mark the last Friday in March, we again bring you the (RSP) / (SPY) comparison chart, where we examine the difference between the equal-weighted index for a broad group of stocks (RSP) and a cap-weighted index (SPY) dominated by the largest companies in the world. We often see divergences happen to these indexes depending on the market conditions, the economy and where we might be at during an economic cycle.
To be sure, the RSP had been leading the SPY for the last part of 2025. Notice the significant difference as the two ETFs separated cleanly. The green line is the SPY, while the black line is RSP, showing a "catch-up" move to end the year on a high note (yet SPY beat RSP in 2025). Earlier this year we saw better performance yet from the broad, equal-weighted RSP but now the correlations are nearly identical.
We have to remember that when volatility rises (VIX at 30) correlations move toward one. That is positive direction, meaning they both tend to move together. We see this on the chart.
Why is this a problem? Basically, it removes any/all diversification benefits that may be derived from a diversified portfolio. In other words, every name seems to get hit eventually.
The chart shows this strong pairing, with lower highs and lower lows. That is our textbook definition of a downtrend, and it appears no end is in sight. The November lows in the SPY have been broken but the RSP has a way to go to get there (arrows). That would similarly equate to $600 on the SPY, so if this correlation remains strong that would be your next stop.
When the SPY starts performing better then we might see this correlation reduce from near 1, but until then the high volatility will dictate the action.
Other charts we shared with you this week were:
Monday, March 23: S&P 500 - Will Streak of Down Weeks Come to an End?
Monday, March 23:Broadcom (AVGO) - Can We Trust Broadcom to Stay in This Channel?
Tuesday, March 24: Applied Materials (AMAT) - Getting Back Into Applied Materials Was a No-Brainer
Wednesday, March 25: United Rentals (URI) - United Rentals Sends Signal About U.S. Economy
Thursday, March 26: Palantir (PLTR) - Is Palantir's Budding Uptrend Sustainable?
The Week Ahead
Next week, as we close out Q1 2026 and begin Q2, we will reconstitute the Pro Portfolio’s EPS Diplomats basket. That will be one part of a big week that should also include very revealing economic numbers reflecting the impact and initial fallout of the U.S.-Iran conflict. We will also get a fresh set of multifaceted looks at the employment situation in the U.S. Inflation pressures are once again in the spotlight, and next week’s data are likely to reinforce that.
Some of that key data, such as the March Employment Report and ISM’s March Service PMI, will be published on Friday, April 3, which is a stock market holiday. What that collected data reveal and where we stand relative to President Trump’s April 6 deadline will determine how the market will begin the first full week of trading for April.
Here's a closer look at the economic data coming at us next week:
U.S.
Tuesday, March 31
FHFA Housing Price Index – January (9:00 AM ET)
S&P Case Schiller Home Price Index – January (9:00 AM ET)
JOLTS Job Openings & Quits – February (10:00 AM ET)
Consumer Confidence – March (10:00 AM ET)
Wednesday, April 1
MBA Mortgage Applications Index – Weekly (7:00 AM ET)
ADP Employment Change Report – March (8:15 AM ET)
S&P Manufacturing PMI – March (9:45 AM ET)
ISM Manufacturing PMI – March (10:00 AM ET)
Construction Spending – February (10:00 AM ET)
EIA Crude Oil Inventories – Weekly (10:30 AM ET)
Thursday, April 2
Challenger Job Cuts Report – March (7:30 AM ET)
Initial & Continuing Jobless Claims – Weekly (8:30 AM ET)
Business Inventories – February (10:00 AM ET)
Factory Orders – February (10:00 AM ET)
EIA Natural Gas Inventories – Weekly (10:30 AM ET)
Friday, April 3
Employment Report – March (8:30 AM ET)
S&P Global Services PMI – March (9:45 AM ET)
ISM Services PMI – March (10:00 AM ET)
International
Monday, March 30
Japan: Housing Starts – February
UK: Bank of England Consumer Credit – February
Eurozone: Economic Sentiment and Consumer Confidence – March
Germany: Inflation Rate (Prelim.) – March
Tuesday, March 31
Japan: Unemployment Rate, Industrial Production, Retail Sales – February
China: NBS Manufacturing & Non-Manufacturing PMI – March
Germany: Retail Sales – February
UK: GDP (Final) – Q4 2025
Eurozone: Inflation Rate (Flash) - March
Wednesday, April 1
Japan: S&P Services PMI – March
China: RatingDog Services PMI – March
Eurozone: S&P Global Manufacturing PMI – March
UK: S&P Global Manufacturing PMI – March
S&P Global Services PMI – March (9:45 AM ET)
Friday, April 3
Japan: S&P Services PMI – March
China: RatingDog Services PMI – March
On the earnings front, we have a rather light calendar next week. However, from the companies that are reporting, like Nike (NKE) and McCormick (MKC) , we’ll be paying close attention to comments about input costs, inflation pressures, and potential price increases. As companies wrap the quarter and start to work on their Q1 2026 results, we’ll be on the lookout for pre-announcements, both good and not so good.
Here's a closer look at the earnings reports coming at us next week:
Monday, March 30
Open: Americas Gold and Silver (USAS)
Tuesday, March 31
Open: J. Jill (JILL), McCormick & Co. (MKC), TD Synnex (SNX)
Close: Dave & Buster’s (PLAY), Nike (NKE), PVH (PVH)
Wednesday, April 1
Open: Cal-Maine Foods (CALM), Conagra (CAG), Lamb Weston (LW), MSC Industrial (MSCI)
Thursday, April 2
Open: Acuity (AYI), Lindsay Corp. (LNN)
Portfolio Investor Resource Guide
Economic Data: Here's a List of Links to the Key Economic Data We Closely Watch
Investing Terminology: 16 Key Terms Club Members Should Know
10-Ks: Want to Know About a Stock? Read the Company's Reports
10-Qs: Unlock the Numbers and Key Information Behind Your Stock With the 10-Q
Income Statement: Our Cheat Sheet to Understanding This Financial Document
Balance Sheet, Cash Flow Statements, and Dividends: How to Know If a Company Is Off-Kilter? Read Its Balance Sheet
Valuation Metrics: Everyone Wants a Value. Here's How Investors Can Find
Thematic Investing 101 Webinar
Like the Benefits of ETFs? Let’s Talk About Models
The Portfolio Ratings System
1 - Buy Now (BN): Stocks that look compelling to buy right now.
2 - Stockpile (SP): Positions we would add to on pullbacks or a successful test of technical support levels.
3 - Holding Pattern (HP): Stocks we are holding as we wait for a fresh catalyst to make our next move.
4 - Sell (S): Positions we intend to exit.
Stocks & Markets Podcast Links
Some helpful links if you prefer to catch the podcast on the go, in the car, or wherever. Be sure to give it a like or thumbs up and leave a review if you’re so inclined. We’d appreciate it.
