Charting the Markets: A Bullish View of Small-Cap Stocks
The Russell 2000 may hold the key to more market gains.
You've reached your free article limit
You've read 0 of 1 free Pro articles.
What is it the drives markets higher or lower? We can say price action, which would be 100% correct. But we can also look at breadth, because more important is the differential between highs and lows.
We look at breadth through different lenses, but one of the best correlated between strong markets and breadth is the Russell 2000 IWM small-caps. This is a great index to show leadership up and down the markets, and when the bigger cap names need a jolt of caffeine to move higher, they often look towards the IWM for relief.
But this year the Russell 2K is lagging the other indexes, for no other reason than interest rates. The Federal Reserve is adamant about fighting inflation, and with that fight they are keeping to their 'higher for longer' policy.
Yet higher rates are a stinger for small-cap stocks, and thus can douse cold water on any market rally. If rates do start to come down this year, we may see a nice catch up for the small-caps.
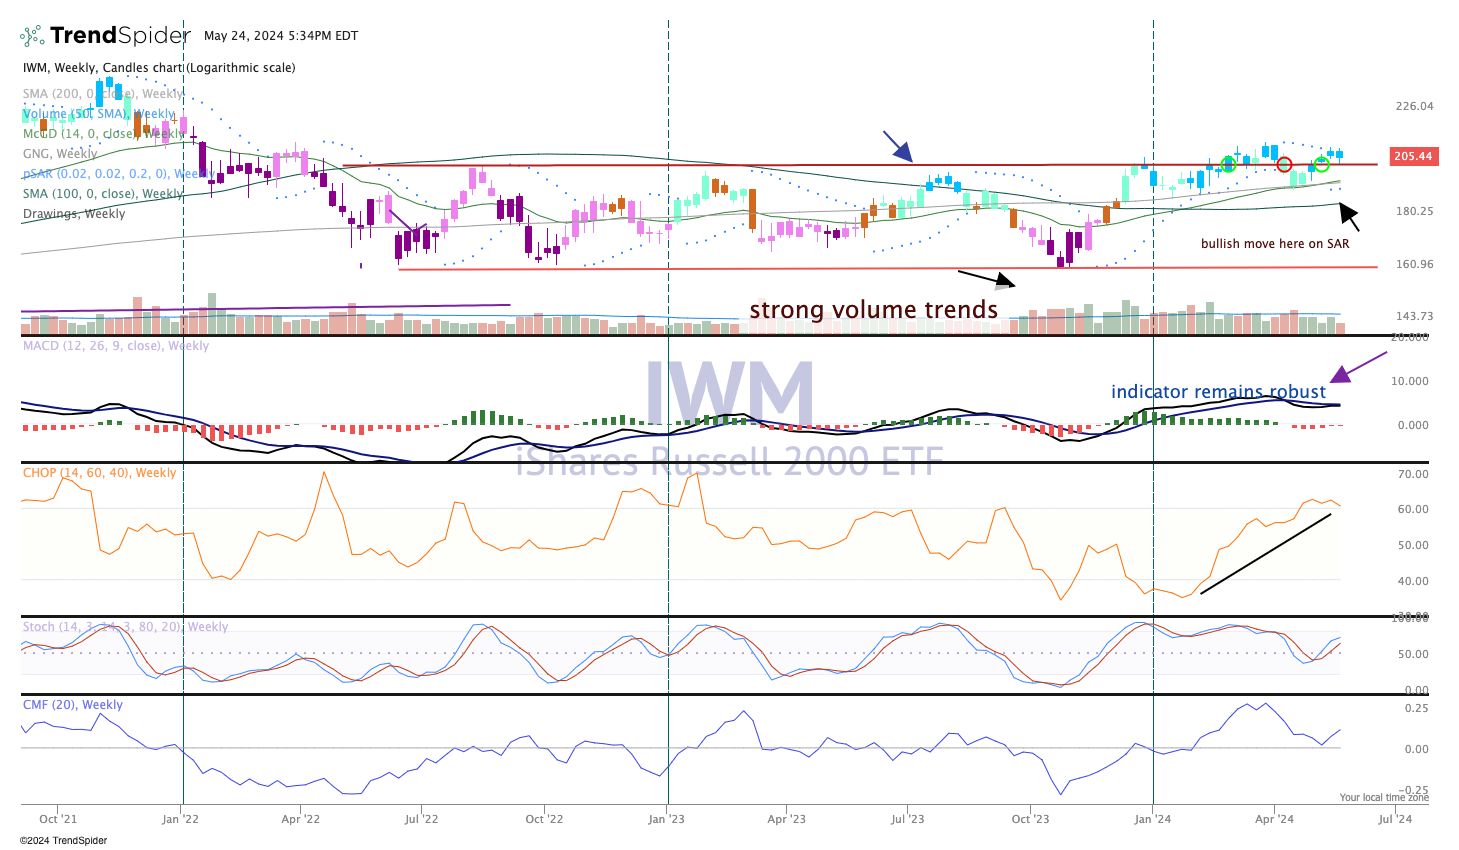
In the meantime, the chart is starting to look much more bullish. The candles are blue or teal, which represent bullishness in the GoNoGo composite of indicators.
The MACD (moving average convergence divergence) remains robust, the parabolic SAR (stop and reverse) just went bullish.
In pane 4 is the choppiness index, and that is rising sharply, which tells us the index is consolidating - below 38 means a trend in place. A consolidation after a sharp move up is bullish, and finally notice the IWM is trading above the tight bands drawn. Again, bullish for the small-caps.
If only the Fed would cut rates... hmmm.
