Chart of the Day: Qualcomm Is Unflappable
The stock is poised for a breakout move any day now.
You've reached your free article limit
You've read 0 of 1 free Pro articles.
Tuesday's massive drop in the market could be attributed to the poor earnings and guidance from big semiconductor equipment maker ASML Holding ASML. Many names in this space were hit hard following this disappointing news, but Qualcomm QCOM was one of the few that were not shaken by it. In fact, the stock finished near the midpoint of the session and continues to grind ahead.
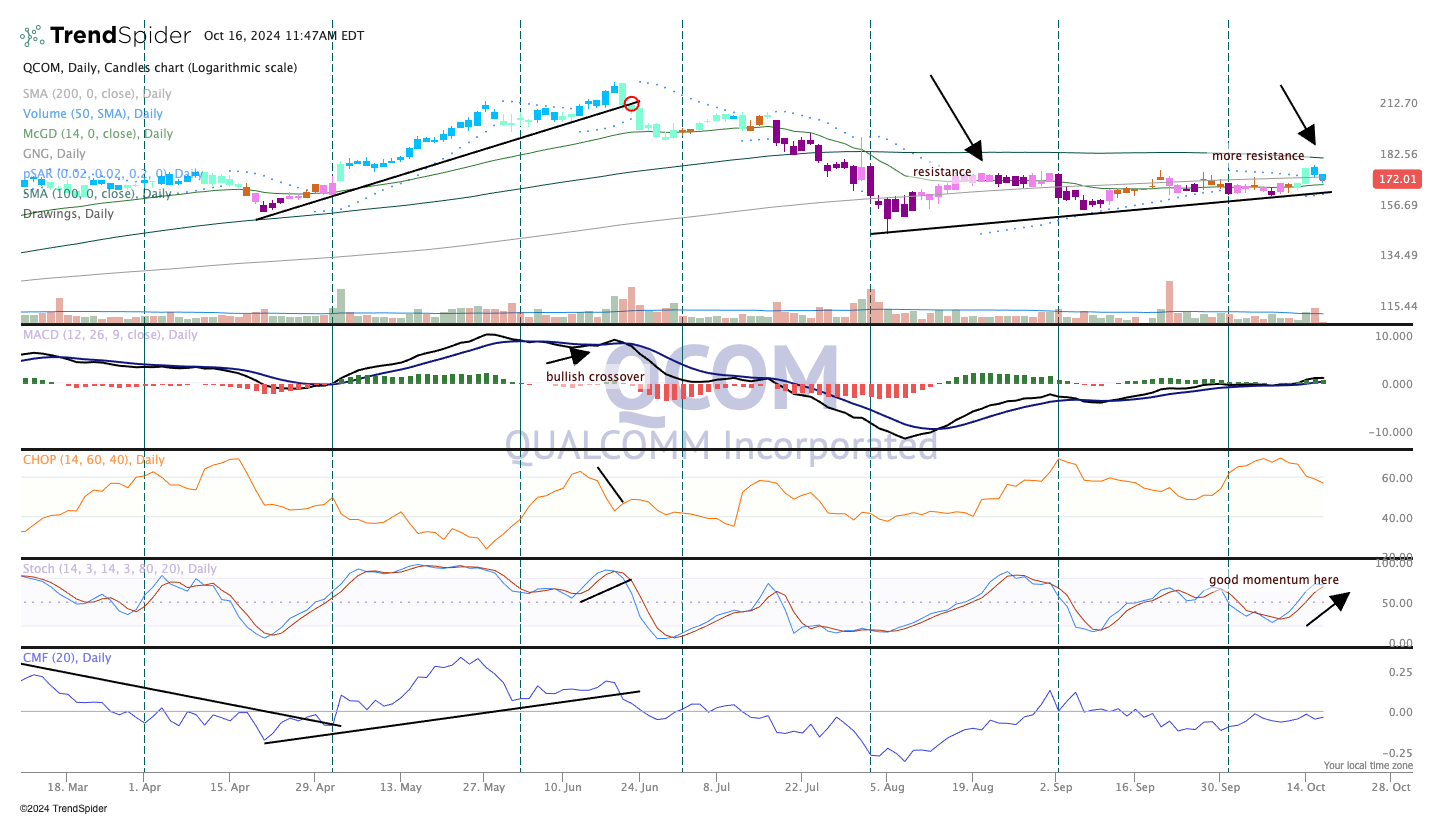
The chart, above, is constructive, with higher highs and higher lows since the early part of August. That is a textbook definition of an uptrend. Notice how the candles are now blue, which is a strong buy signal on the GoNoGo indicator of price action. We also see the parabolic SAR (stop and reverse) flipping to bullish. Furthermore, MACD (moving average convergence divergence) is still on a buy signal and stochastics are showing us positive momentum.
Is a breakout imminent? We think so, but the 200-day moving average and the August highs present challenges. A move confirmed (two sessions) above $182 would be ideal and help push Qualcomm towards those summer highs well above the $200 level.
We rate Qualcomm a One in TheStreet Pro Portfolio.
At the time of publication, TheStreet Pro Portfolio was long QCOM.
