Two Big Clouds Remain Over Wall Street
Insiders have been sellers over the past few weeks and valuation remains a problem for investors.
You've reached your free article limit
You've read 0 of 1 free Pro articles.
We got positive technical readouts after the close on Friday, but clouds remain overhead: Insiders have largely been sellers over the past few weeks, while the forward 12-month valuation of the S&P 500, based on Bloomberg’s earnings estimates, remains significantly above ballpark fair value.
The good news is that all the major equity indexes closed higher Friday, with positive New York Stock Exchange and Nasdaq internals. Trading volumes slipped on the Nasdaq and the NYSE's were flat. All indexes closed near their session highs, which resulted in several positive technicals.
Cumulative market breadth also improved while the one-day McClellan overbought/oversold Oscillators are neutral, despite Friday’s gains.
We continue to believe investors should not be chasing price but taking advantage of weakness.
The Charts and Technicals
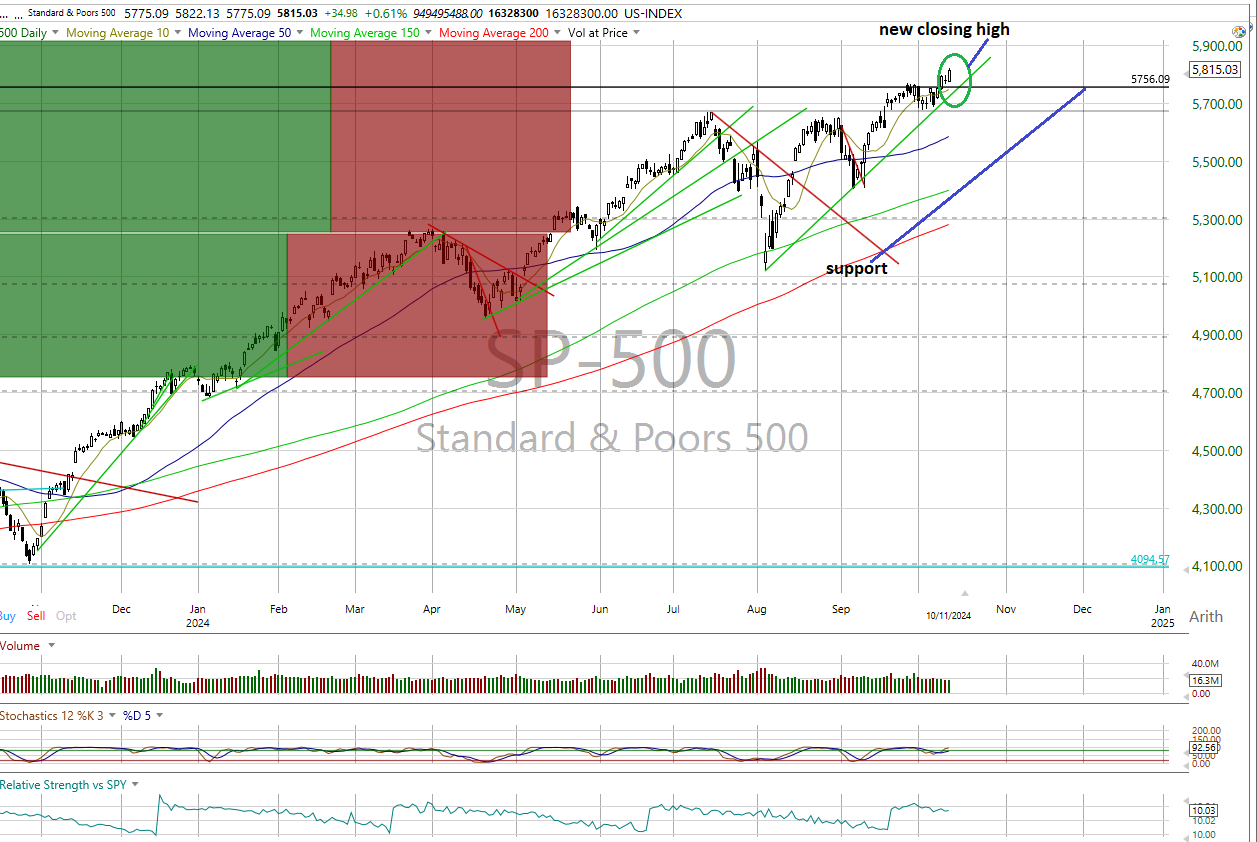
- All closed near their session highs as the S&P, Dow Jones industrial average and midcaps posted new all-time closing highs.
- Also, the Dow Jones Transports and Russell 2000 closed above resistance, leaving all of the charts in near-term bullish trends except for the Russell 2000 that is now neutral vs. its prior bearish status.
- Cumulative breadth also improved with the All Exchange and Nasdaq advance/decline lines shifting to neutral from bearish as the NYSE’s moved to bullish from neutral.
- All the stochastic levels are overbought but have not yet generated bearish crossover signals.
The data remains mixed.
- The one-day McClellan overbought/oversold oscillators, however, are only neutral after responding to their prior oversold condition that fueled Friday’s gains (All Exchange: -6.47; NYSE: -16.62; Nasdaq: -0.06).
- The percentage of S&P issues trading above their 50-day moving averages, a contrarian indicator, rose to 75%, staying neutral.
- The detrended Rydex Ratio, another contrarian indicator, however, rose to 1.07 and is still on a bearish signal.
- The Open Insider Buy/Sell Ratio rose slightly, but remains bearish at 24.6, as they have been sellers of late.
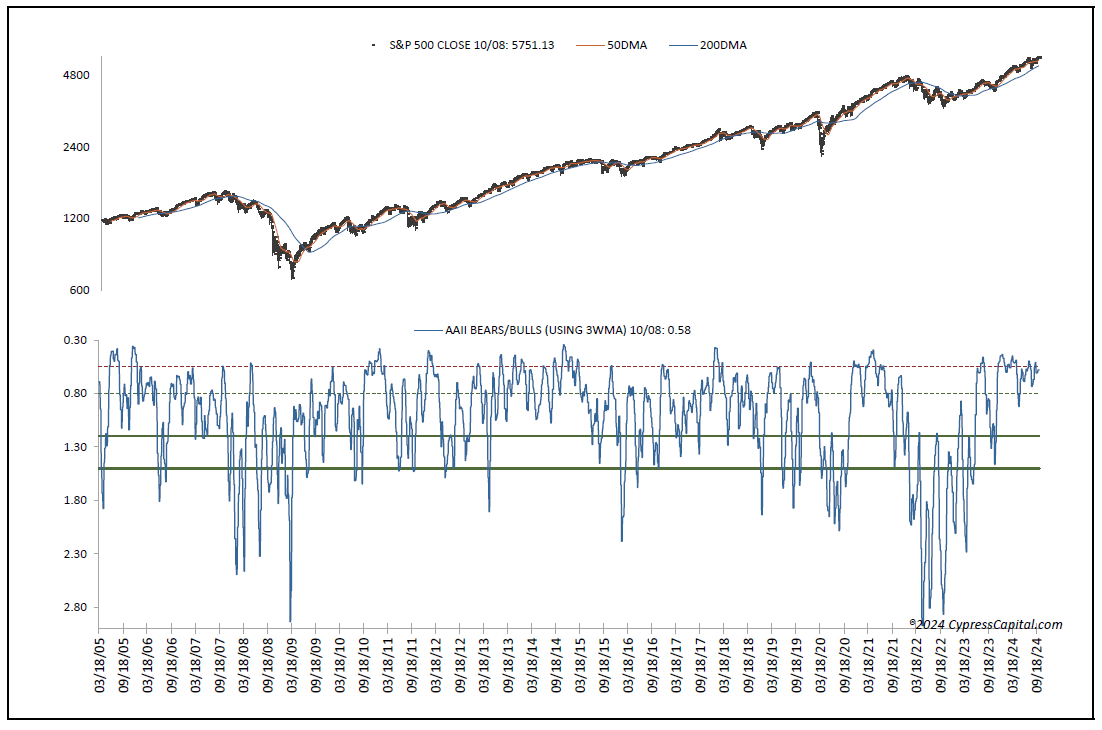
- Last week’s contrarian American Association of Individual Investors Bear/Bull Ratio is unchanged at a neutral 0.58.
- The Investors Intelligence Bear/Bull Ratio, also contrarian, remained neutral as well, and unchanged at 22.6/52.5.
- Finally, valuation remains a concern. The 12-month consensus earnings estimate for the S&P 500 edged higher to $255.85. Yet, its forward price-to-earnings of 22.7 remains at its highest level above the “rule of 20” ballpark fair value in several weeks at 15.9. We believe this premium still presents some risk. Its earnings yield is 4.4%.
The Treasury and the Buck
The 10-year Treasury yield dipped to 4.07%. Support is 3.81% with resistance at 4.11%. Its near-term trend is bullish.
The U.S. Dollar, via the Dollar Index Bullish Fund UUP, closed higher at $28.83. Its trend is bullish with support at $28.70 and resistance at $28.83.
The Bottom Line
In conclusion, we see further sideways chop for the major equity indexes ahead. We are patient and buyers on weakness near high volume support levels.