Traders Remain Complacent Despite Bad Breadth
I’m still expecting the market to reach oversold levels sometime after Memorial Day.
You've reached your free article limit
You've read 0 of 1 free Pro articles.

Note: As you may have seen me reference a number of times over the years, I have bad eyes. On Wednesday, I will finally have cataract surgery, so I am taking the remainder of the week off. My plan, should all go well, is to be back at my desk with a new column Tuesday morning.
Tuesday’s market was a bit different than Monday’s. As I noted during Monday’s market, the selling sort of dried up, but during Tuesday’s market, most stocks sort of leaked, and once the Semiconductors caught a bid, there was very little room for anything else to have a rally.
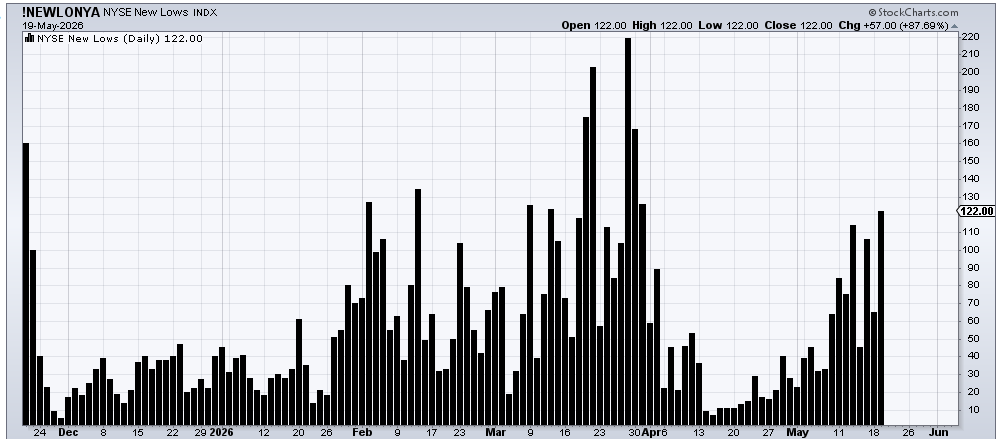
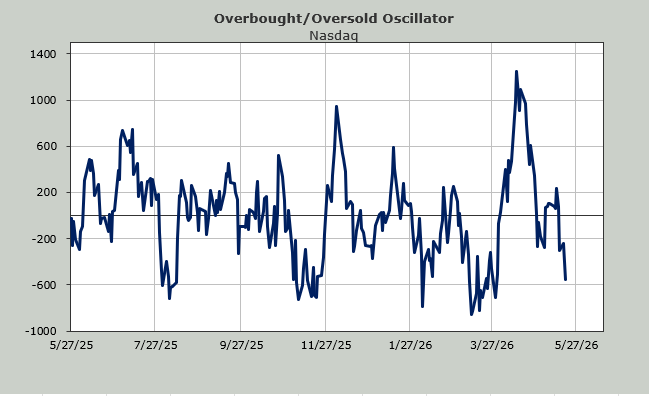
The number of stocks making new lows expanded on Tuesday. Nasdaq’s increased to nearly 270 (up from 235 the prior day). They have nearly tripled in two weeks. The NYSE saw an increase as well. The new lows are up nearly fourfold in about two weeks.
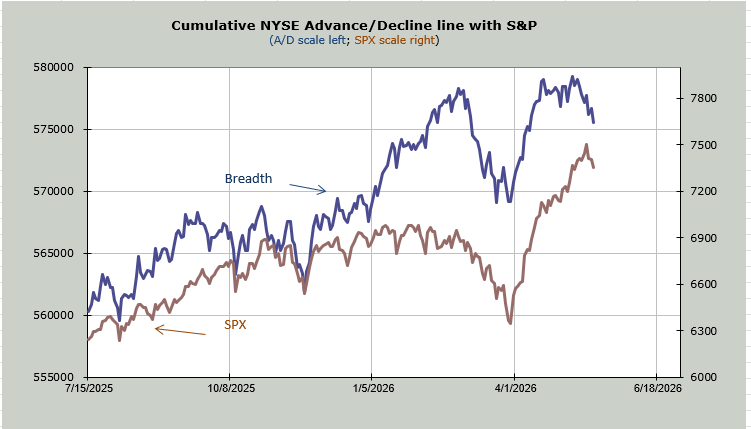
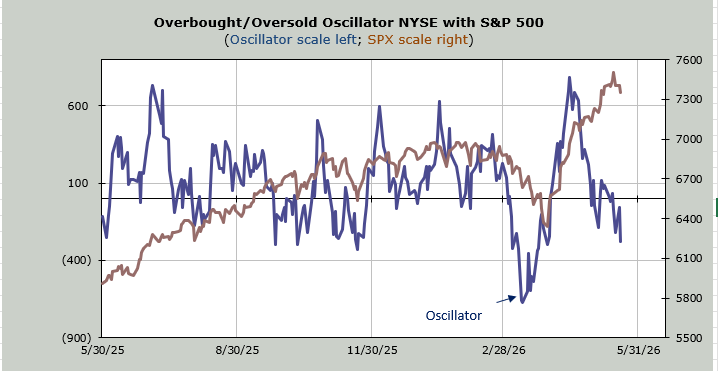
The breadth of the market has been deteriorating for a month now—it essentially made its high mid-April, and now you can see the blue line (breadth) has come down to the equivalent of when the S&P was at 7100.
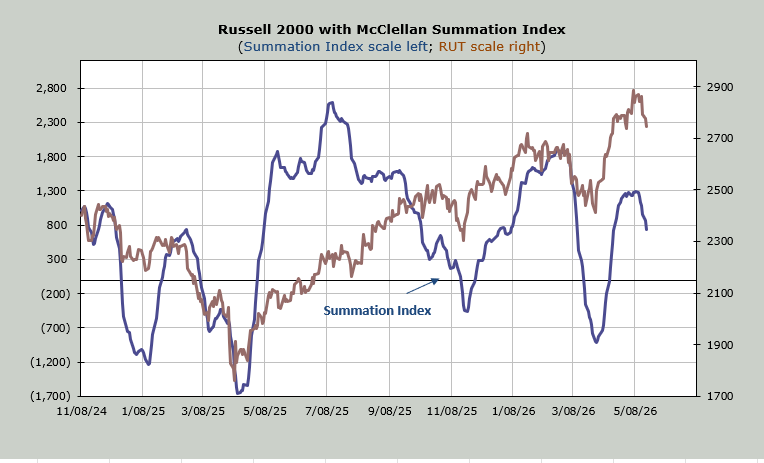
We see it readily in the McClellan Summation Index. This indicator now needs a net differential of +2500 advancers minus decliners on the NYSE to halt the decline. As a reminder at +3000 it gets moderately oversold; at +4000 it gets very oversold. So it’s getting closer.
And that brings us back to the Overbought/Oversold Oscillator. Six of the last ten trading days, breadth has been negative, which is why this indicator keeps heading downward. It’s not been persistent in that we don’t have long strings of negative days—we always seem to have thrown in a positive day here or there—so I can’t give you an exact time frame for an oversold condition (short term) yet. If I had to put a date on it, I’d go with just after Memorial Day. But let’s not write that in stone!
What we really would like to see is the VIX get jumpy. It just sits there. I thought with the action in the bonds on Tuesday, we’d get some panic, but instead, we just got more dripping. In fact you can color me shocked that the DSI for the bonds only slipped from 22 to 20. I was certain we’d see the DSI as a teenager.
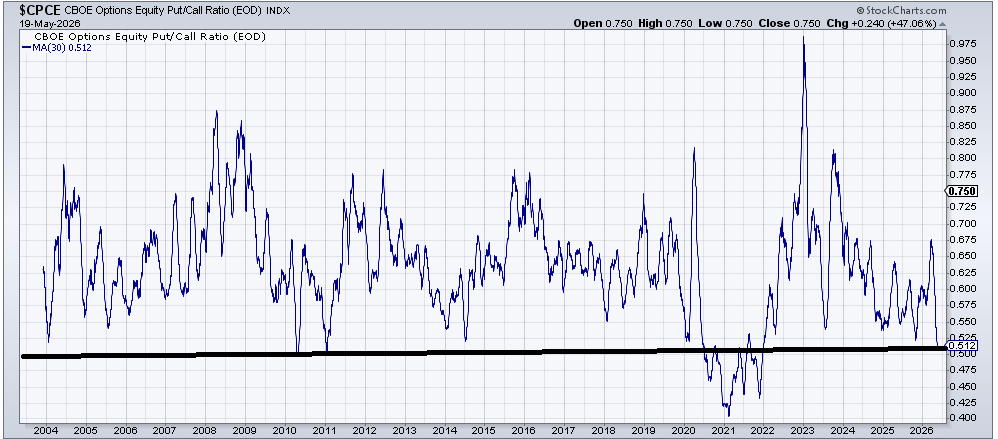
Let me finish by noting the complacency I still see is now evident in the 30-day moving average of the equity put/call ratio. It is now down to .51, which you can see, with the exception of the heady days of 2021, is pretty much where this indicator has found ‘support’ over the last twenty years. I would say this joins the other sentiment indicators (like Market Vane and Citi Panic/Euphoria) that show far too much enthusiasm for stocks.