Something Changed Wednesday — But It Wasn't the Lines
How often do we keep seeing 'since January 2018'? A lot. Here's why it's popping up again. Plus, a look at Costco, and why isn't anyone talking about silver?
You've reached your free article limit
You've read 0 of 1 free Pro articles.
The Market
The market as a whole was dull once again. Sure, we rallied but mostly we continue to just slosh around. The QQQs are still at the same level they were at six weeks ago. About the only good news is that folks have finally seemed to notice the market has been choppy rather than the straight up they were hailing a week ago.
Did the lines break? They did not. Did the indicators change? They did not.
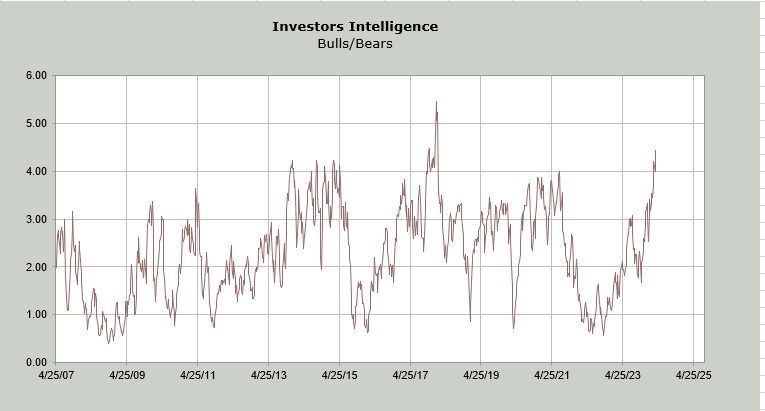
What changed is sentiment. The Investors Intelligence bulls jumped up to 62.5%, which is the highest since 2020. But I am more interested in the bears, which fell to 14.1%. That is the lowest since January 2018. How often do we keep seeing "since January 2018"? A lot.
If we divide the bulls by the bears we get 4.43. There are 4.43 bulls for every bear. That is the highest ratio since…wait for it…January 2018! Back then it got to 5.47 so I suppose there is room for it to move.
With the market’s action this week I fully expect we’ll see the AAII bulls pull in their horns when the data is released on Thursday. The NAAIM folks, who had lifted their exposure back over 100 last week, surely will have retracted that when the numbers are released on Thursday morning.
But I am sure you are interested to know if the DSI for gold got over 90. Shockingly, it did not. It is 89! As a reminder, my measured target for this move in SPDR Gold Shares GLD is right here around $210-ish.
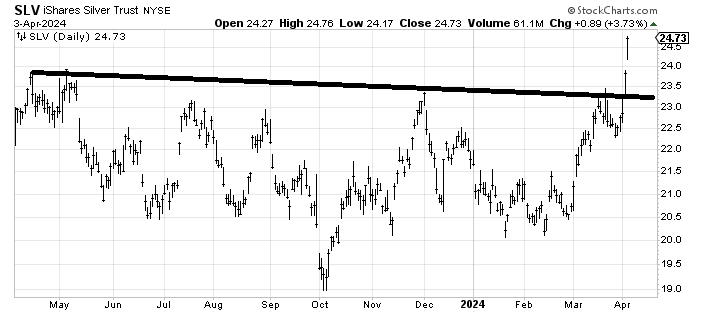
Silver, though, which I recommended on Sunday, did break out but its DSI surged to 91. What to do? I would suggest taking a little something off the table. It’s up 10% in a few days so we don’t need to be pigs. But my target here for the iShares Silver Trust SLV is around $28-29.
I am sort of shocked we don’t see every guest on tv talking about silver. That’s typically what we see when something has moved like that. Perhaps tomorrow.
New Ideas
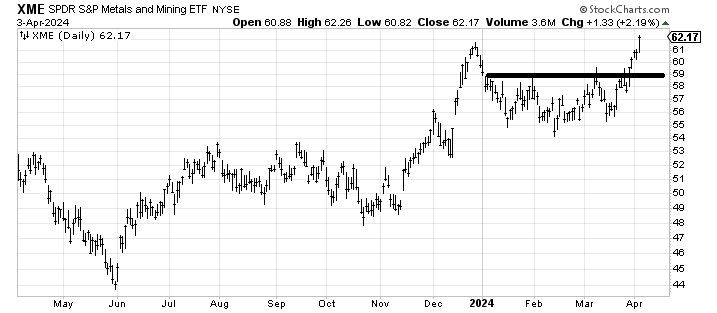
For the SPDR Metals and Mining ETF XME my next target is around $64, but this too is getting stretched. Also copper’s DSI is at 88.
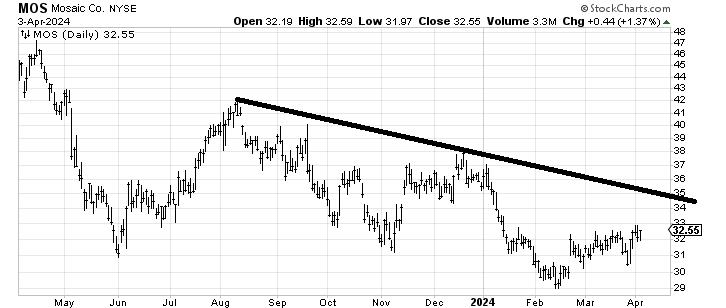
A few days ago I thought Mosaic MOS was set to rally and instead it has sat here, churning. I still think this should rally toward that line.
Today’s Indicator
The Volume Indicator is still overbought at 55%.
Q&A/Reader’s Feedback
Helene welcomes your questions about Top Stocks and her charting strategy and techniques. Please send an email directly to Helene with your questions. However, please remember that TheStreet.com Top Stocks is not intended to provide personalized investment advice. Email Helene here.
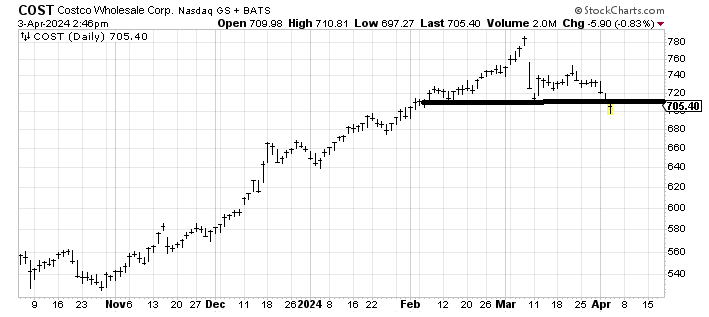
I usually like to buy Costco COST when it takes a dive but right now I would take a wait-and-see attitude toward it. The stock should try and recapture that broken line but if it doesn’t it eventually measures down to $630-ish.
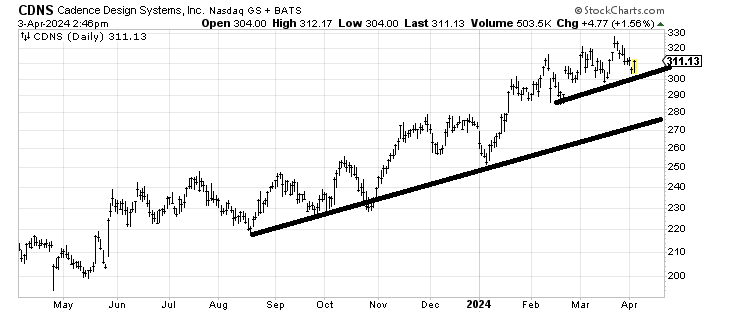
Cadence Design CDNS is in an uptrend but mostly it has been grinding around here for two months with each higher high rather marginal. But unless/until the stock breaks that shorter-term uptrend line I would say the grind upward continues.
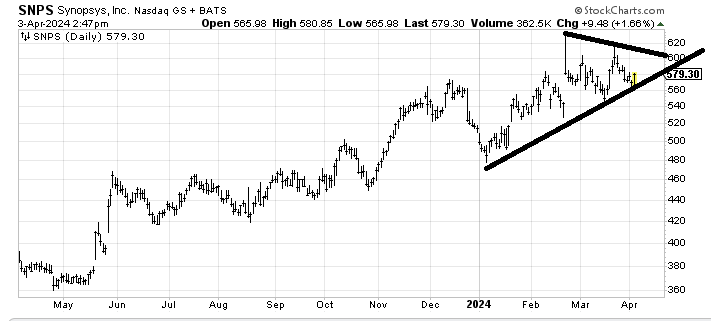
Synopsys SNPS has an unfulfilled measured target around $650, but right now it must contend with those two spike highs in the $610-625 area. I would stop myself out with a break under that uptrend line.
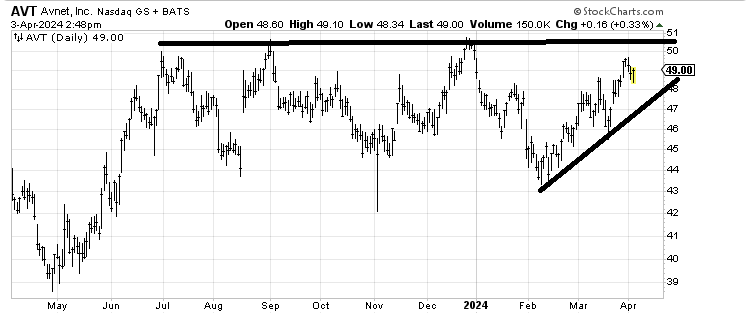
Avnet AVT doesn’t trade much so you have to be careful but if it can get up and over that $50.50 area that would be a nice breakout.