Sentiment Isn't Quite Giddy, but Is It Nearing an Extreme?
While we wait for a bout of volatility, the sentiment indicators keep on moving towards extremes.
You've reached your free article limit
You've read 0 of 1 free Pro articles.
Why didn’t the market have any volatility this week? That’s the question I keep getting asked. I don’t know. But it doesn’t mean the setup for it has gone away. Each day that slips by that it doesn’t appear, is a day the market gets more extreme. And extreme markets are generally not good.
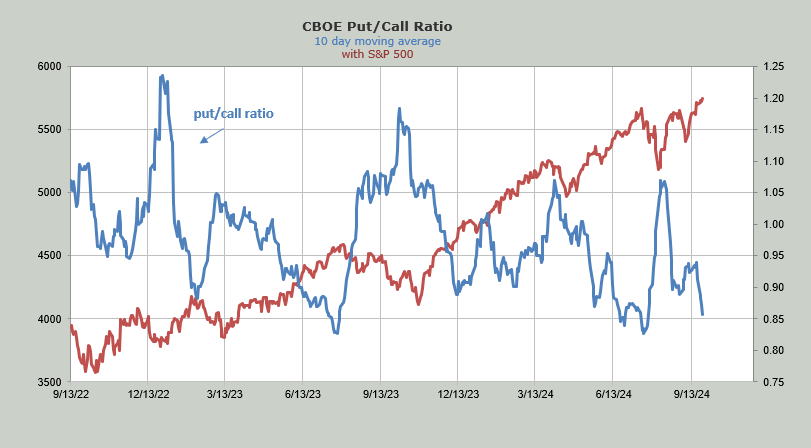
I have said all week that I don’t think we have the kind of giddy sentiment that we saw in July, and I still feel that way, but I have to tell you that the surveys are not giddy, but those put/call ratios are heading in that direction.
For the second consecutive day, the total put/call ratio was under .80 which itself is not extreme but it is the first consecutive reading under .80 since mid-June. In mid-June the ten-day moving average of this metric was still over .90. It did not slip under .85 until early July. It bounced immediately and then came down one more time into mid to late July.
In the recent past a reading under .85 has meant folks have gotten too bullish. The current reading hovers just over .85.
The equity put/call ratio’s ten-day moving average is sitting just at .56. A reading under .56 has been problematic.
Long-time readers will know I am not a fan of the CNN Fear and Greed Index, mostly because I object to some of the inputs (like breadth) but I see that is now knocking on the door of extreme greed. https://www.cnn.com/markets/fear-and-greed
If we use the Daily Sentiment Index (DSI) we don’t see extremes yet. Nasdaq is at 82, while the S&P is at 79. The VIX is persistently at that mid-teens level, sitting at 17 currently. It is safe to assume if the market keeps cranking upward, that the Nasdaq DSI will be in the upper 80s shortly and that VIX reading will fall under 15, becoming a tween.
I suppose the best commodity I can use to gauge China (there is no DSI on China’s market) is copper, and that sits at 81 presently.
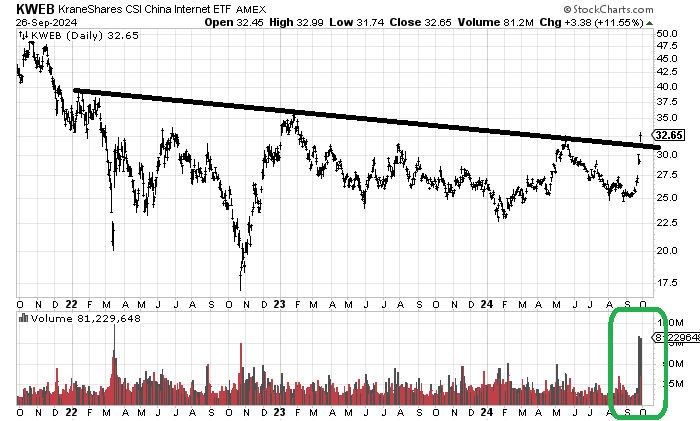
Speaking of China, I do want to point out that we did, in fact, cross that line on the weekly chart I showed here recently. Here I show you the crossing of the line as well as volume, using a daily chart. I want you to see the volume because I believe it is important. I often discuss the high volume lows on the QQQs but this is no different: you can see the two high volume lows on the chart.
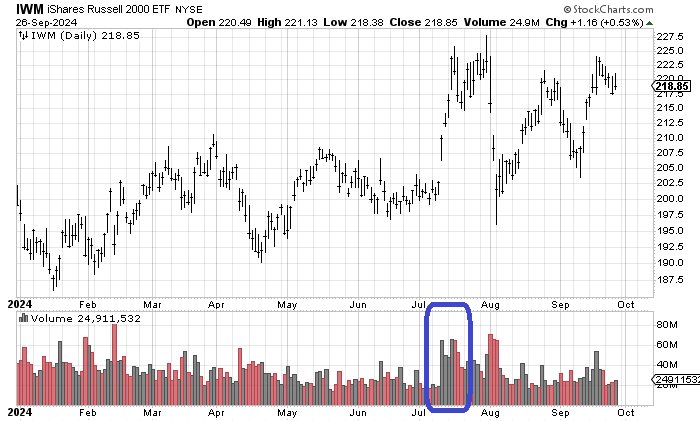
So what does the high volume rally tell us? Probably a sign that shorts wanted out of their positions. While not as dramatic as the KWEB volume, we saw something similar last summer with IWM (blue box). Right next to that blue box you can see the panic out after the panic in.
In any event, I think crossing that line is a big deal. The volume may mean we’re a bit overdone in the short term, but, as long as it stays over 30, it ought to complete the base.