S&P 500 Finally Breaks Below 50-Day Moving Average
Investor sentiment, insider selling and valuation call for caution.
You've reached your free article limit
You've read 0 of 1 free Pro articles.
The market's data is still flashing yellow, as valuations don't add up, investor sentiment is shaky and the S&P 500 has broken below its 50-day moving average.
There were no changes in the charts' near-term trends that are still a mix of bullish, bearish and neutral projections, but that S&P action is something to watch.
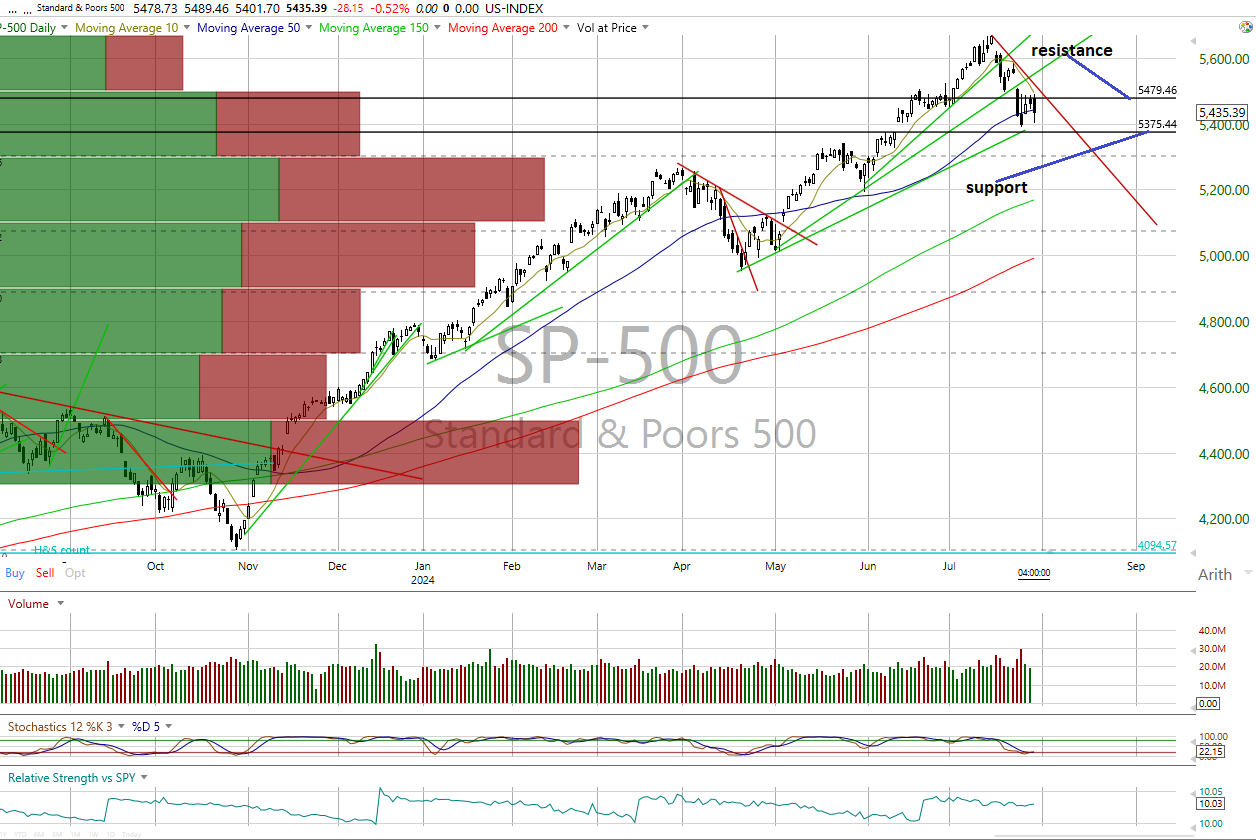
As for the latest action, all major equity indexes closed mixed Tuesday with positive New York Stock Exchange internals. Those on the Nasdaq were negative. Both saw volumes rise from the previous session. They closed near the midpoint to the lower end of their intraday ranges. The only technical event of note was that S&P 500 close. The percentage of S&P issues trading above their 50-day moving averages (a contrarian indicator) is unchanged at 69% and is neutral.
Show Me the Data
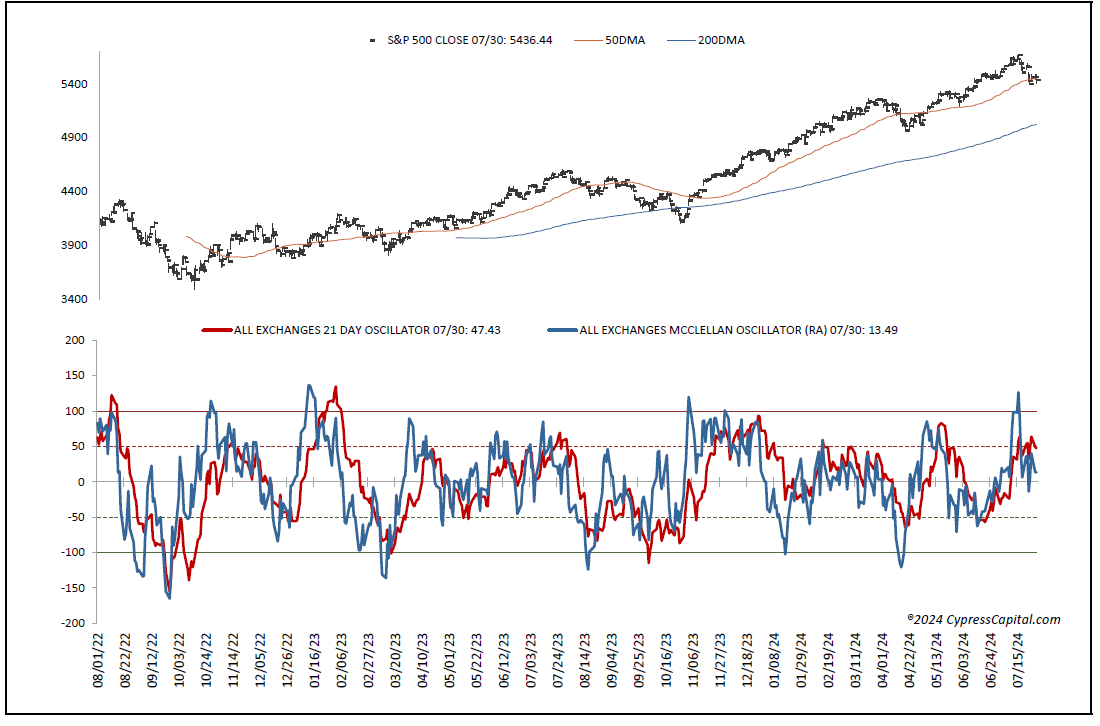
The McClellan one-day overbought/oversold oscillators are neutral (All Exchange: 13.49 NYSE: 29.19 Nasdaq: 4.99), while two of the three investor sentiment readings (contrarian indicators) stayed bearish as insiders have increased selling.
Additionally, the forward 12-month valuation of the S&P based on Bloomberg’s forward 12-month earnings estimates remains quite extended above ballpark fair value. As such, despite the very strong futures from earlier in the morning, we remain cautious as we have yet to see enough evidence suggesting the current market correction has been completed.
The Charts
On the charts, the major equity indexes closed mixed yesterday with negative Nasdaq internals and the NYSE’s positive on heavier volume.
The S&P, the Nasdaq Composite Index and Nasdaq 100 all closed lower as the rest posted gains.
As such the near-term trends are unchanged and bullish on the Dow Jones industrial average and the Dow Jones transports with the S&P, Nasdaq Composite Index and Nasdaq 100 bearish and the mid-caps and small-caps on the Russell 2000 neutral.
Cumulative market breadth remains neutral for the All Exchange and Nasdaq with the NYSE’s shifting to positive from neutral.
Rydex Ratio, AAII, Other Stats
The detrended Rydex Ratio, a contrarian indicator, dropped to neutral from bearish at 0.98 as the typically wrong leveraged exchange-traded fund traders reduced their overexposed and leveraged long exposure.
But this week’s American Association of Individual Investors Bear/Bull Ratio (contrarian indicator page) stayed bearish at 0.53 as the Investors Intelligence Bear/Bull Ratio (also a contrary indicator) stayed bearish at 23.2%, as bulls continued to outweigh bears by a wide margin. There is no “wall of worry” to climb on their part.
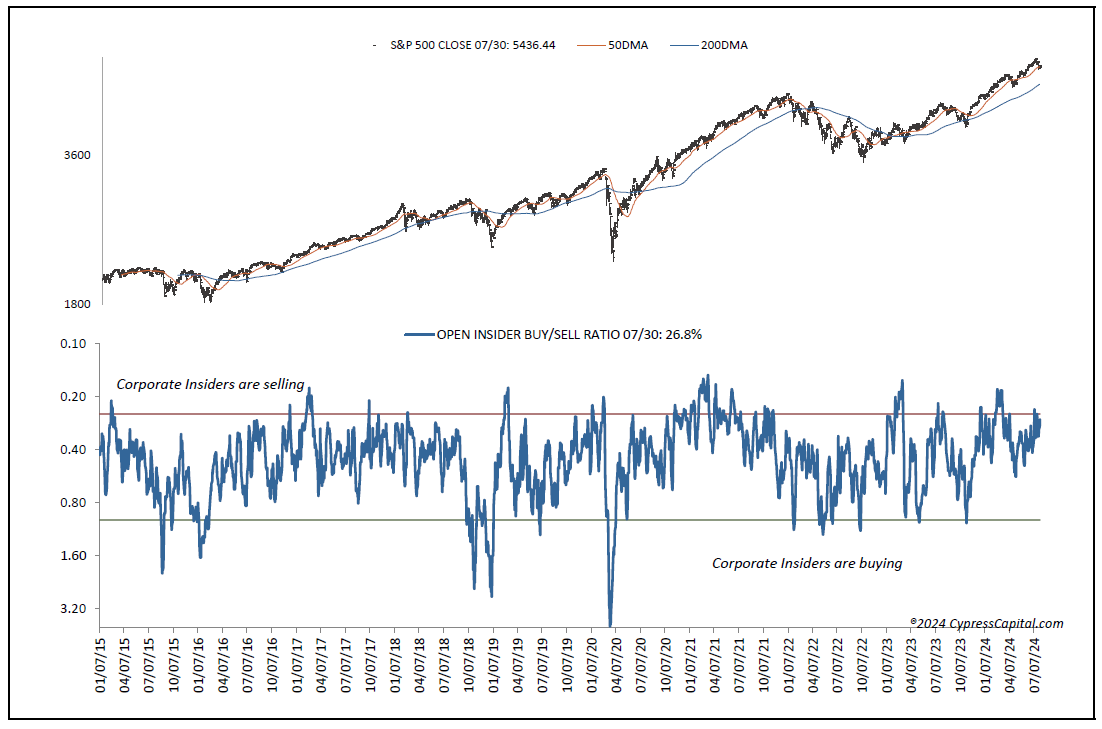
Of note, the Open Insider Buy/Sell Ratio dropped to 26.8% and just shy of turning bearish as insiders have been increasing their selling activity as the crowd wants to buy.
Valuation remains a concern. The 12-month consensus earnings estimate for the S&P from Bloomberg rose to $252.35. But that leaves its forward price-to-earnings of 21.5 still well above the “rule of 20” ballpark fair value at 15.9. We believe this premium remains significant.
Its earnings yield rose to 4.64%.
The 10-year Treasury yield slipped to 4.14%. Support is 4.14% and resistance at 4.24%. Its near-term trend is bearish.
The U.S. Dollar, via the U.S. Dollar Index Bullish Fund UUP, closed higher at $28.92. Its trend is neutral with support at $28.83 and resistance at $28.96.
Bottom Line
We're still cautious, valuation is a continued concern and so is investor sentiment. We are honoring sell signals on individual names while being very selective on the buy side.