Rolling Off a Table, 'Kitty' Litter, Transports Hit, Nvidia Runs, Trading Amgen
Plummeting economic data is impacting markets. Activity relative to supply has nearly come to a halt when compared with the pre-Covid and pre-absurd levels of QE eras.
You've reached your free article limit
You've read 0 of 1 free Pro articles.
Rolling off of a table. Like a pea...
That's what appears to be happening to second-quarter GDP estimates.
On Friday, the Atlanta Fed revised lower their GDPNow estimate for Q2 GDP from growth of 3.6% to growth of 2.7% (q/q, SAAR) after a nasty miss for the April goods trade balance on Thursday was followed up on Friday with a miss for April personal spending and that absolutely horrific print for the May Chicago PMI. The other three regional Fed districts that model GDP in anything close to real-time, make their revisions on weekends, and they (New York, St. Louis, Cleveland) all revised their models lower in response to that data as well. Those three estimates currently stand between growth of 1.76% an 0.67%.
On Monday, the macro was again weak. I remind readers, this sudden and apparent weakness in Q2 economic activity comes as the BEA (Bureau of Economic Analysis) has revised its estimate for the first quarter down to growth of 1.3% from its initial estimate of 1.6%, so the ball has been moving forward in 2024, but I would say that what that ball is doing is more like meandering than rolling.
Velocity of M1 Money Supply, as a ratio of nominal GDP to the stock of money printed at 1.572 for Q1 2024, which is the best we've seen since the pandemic. The flipside of that, is that M1 velocity ran at 5.525 as recently as Q4 2019, and above 10 way back ahead of the "Great Financial Crisis."
So, activity relative to supply has nearly come to a halt when compared with the pre-Covid and pre-absurd levels of QE eras. One needs to look no further when pondering the origins of 2020's-era inflation than the reckless fiscal policy and the sloppy monetary policy that enabled power hungry legislators seeking favor with voters over responsibility to taxpayers at those times.
It Got Worse
The macroeconomic situation weakened further on Monday. The ISM Manufacturing Index (or PMI) printed at 48.7, for May, well short of the 49.6 or so that economists had been looking for.
For those not familiar with how PMIs (purchasing manager surveys) work, the 50 level is the line between expansion and contraction. This was the 18th month in the past 19 that the manufacturing side of the U.S. economy contracted from the prior month. What's worse, the most important component of any manufacturing-based survey — "New Orders" — printed at 45.4, showing the fastest pace of contraction from one month to the next since May 2023.
Backlog of Orders contracted for a 20th consecutive month, while inventories contracted for a 16th consecutive month. While the overall economy may not have gone into recession in 2023 (though that data is still facing a serious downward revision), it is quite clear that the United States has been in an industrial recession for some time now, and that period of depressed activity continues on. Oh, prices were higher for manufacturers as was employment. On that, of course they were, and not for long without new orders.
On top of that, April Construction Spending hit the tape at -0.1% month over month, well below the growth or 0.2% that had been expected. April was the third month in four that construction spending contracted from the prior month. In response to this data, the Atlanta Fed was forced to revise lower their GDPNow model for the second straight business day, this time from growth of 2.7% all the way to growth of just 1.8%(q/q, SAAR) as the inputs for real personal consumption and real private fixed investment were both tweaked to the downside.
This puts Atlanta more or less in line with its peer regional Fed districts on Q2 GDP, though the other three branches only revise their models on weekends, so Monday's data is not factored into those models just yet. Atlanta will revise its model again this week on Thursday after the April Balance of Trade prints and again on Friday after the May labor market report.
Markets
Aside from the glitch that allowed some stocks to trade off what appeared to be more than 99% at one time and the "Roaring Kitty"-inspired volatility in GameStop GME, the poor data inspired a rally in U.S. Treasuries as investors sought out safe haven and/or bet on lower interest rates moving forward. This put pressure on equities for at least half of the Monday session, then like Friday when stocks were supported into the close by end-of-month activity, the markets rallied yet again.
By day's end, the U.S. 10-Year Note paid just 4.4%, down 10 basis points for the day, while the U.S. 2-Year Note paid 4.81%, down six basis points.
For the session, the S&P 500 gained a whopping 0.11% as the Nasdaq Composite "ran" 0.56%. Over two days the similarity in the pattern of how the algorithms that control price discovery behaved is striking:
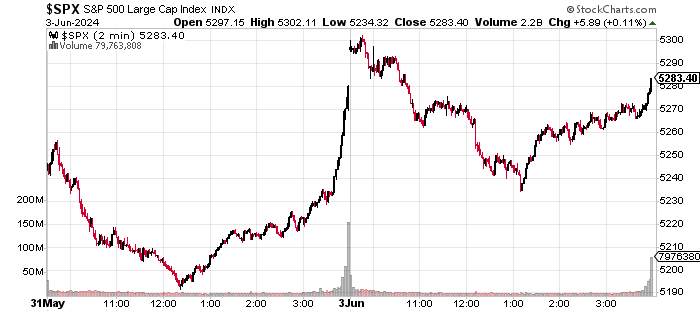
It wasn't all sunshine and rainbows by day's end, however. The Russell 2000 was hit for a loss of 0.5%, while the S&P Midcap 400 was taken 0.77% lower and the Dow Transports were slapped around for 1.07%.
The weakness in the Transports was fairly well distributed across truckers, maritime shippers, delivery services and the rails. That was clearly a response to weaker economic data as was the action in the small to mid-cap names.
Nvidia NVDA appeared to once again, carry the semis, carry technology and carry the S&P 500 with a 4.9% move to the upside. When I put a $1,305 (up from $1,125) price target on NVDA on Monday morning, I never expected the stock to run almost $54 on the day.
Internals
Despite a slight greenish tinge for the headline indexes on Monday, eight of the 11 S&P sector SPDR ETFs closed in the red, led lower by Energy XLE at -2.64% as three of these funds surrendered at least 1%. Health Care XLV led to the upside at +0.72%. Breadth was mixed but leaned negative for the session.
Losers beat winners by just a smidge at both the NYSE and the Nasdaq market site. Advancing volume took a minority share of composite NYSE-listed trade, but a majority share of composite Nasdaq-listed volume. Aggregate trade was sharply lower on a day-over-day basis across the listings of both of these exchanges as well as across the memberships of both the S&P 500 and Nasdaq Composite.
That was to be expected, with Friday being the final trading day of May. Aggregate trade across the S&P 500 was higher on Monday than it had been since May 15 (which was a monthly options expiration event) outside of Friday, so the action, while difficult to decipher, may have been meaningful. However, trading volume across the Nasdaq Composite was lower on Monday than it had been since May 13, even with all of the "Roaring Kitty" nonsense.
But We're Doing So Well
Anyone else happen to notice the news from Bloomberg on Monday that more than 150K households had filed applications for a chance to be placed on New York City's waiting list for federal money that would subsidize rent for low-income family units?
The program, known as section 8 housing, has been at capacity for years, with 100K households currently participating. The waiting list had been locked down since 2009. Now, suddenly, the city is planning to add 200K households to the waiting list.
The portal to get one's household on that waiting list will be open until the end of day, June 9. Those 150K applications? They all came in during the first 12 hours that the portal had been open. No, we're not alright.
I Am Not in the Name...
While i am not in the name, readers may want to be cognizant of the fact that Amgen AMGN has developed a fairly nice-looking cup-with-handle pattern. The pivot stands at $322.
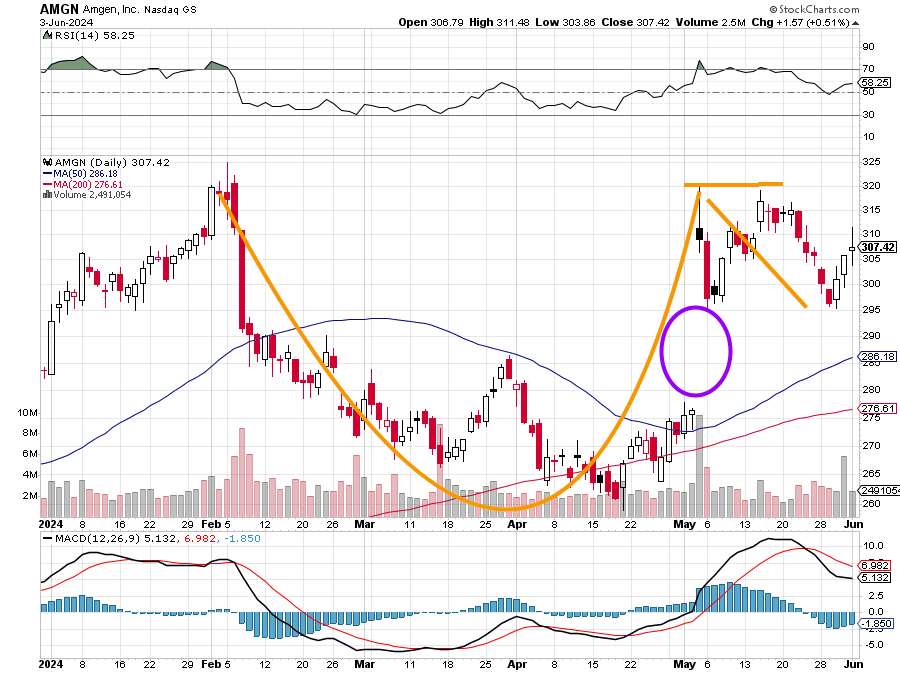
Traders do, however, have to also be aware of the unfilled gap remaining from early May that would need a $278 (or lower) tick to fill.
Economics (All Times Eastern)
08:55 - Redbook (Weekly): Last 6.3% y/y.
10:00 - Factory Orders (Apr): Expecting 0.6% m/m, Last 1.6% m/m.
10:00 - JOLTs Job Openings (Apr): Last 8.488M.
10:00 - JOLTs Job Quits (Apr): Last 3.329M.
16:30 - API Oil Inventories (Weekly): Last -6.49M.
The Fed (All Times Eastern)
Fed Blackout Period.
Today's Earnings Highlights (Consensus EPS Expectations)
Before the Open: BBWI (0.33), DBI (0.13)
After the Close: CRWD (0.89), HPE (0.39), PVH (2.18)
At the time of publication, Guilfoyle was long NVDA and CRWD equity.
