Pushing the Envelope on Bullishness
It's late in the rally. But even if we do pull back we could still get one more rally before year-end. Let's take a look at it all, including the only group that is oversold.
You've reached your free article limit
You've read 0 of 1 free Pro articles.
The Market
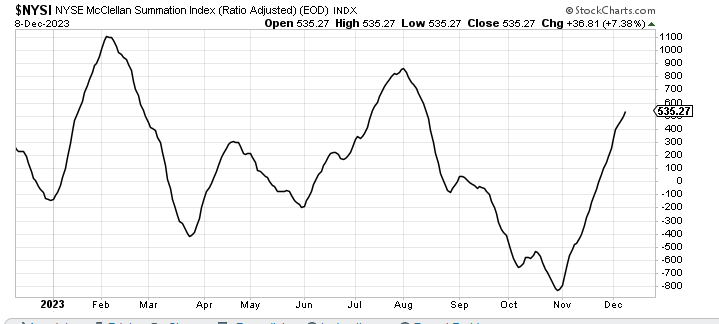
On an intermediate-term basis we are seeing the various indicators slowly move into overbought territory. But to turn bearish I need to see the McClellan Summation Index turn south and that has not happened yet.
To get the Summation Index to turn south we need to see buying dry up and selling pick up. That tends to show up in the Summation Index as breadth can't keep up and rolls over. But it takes more than one day of selling to get there. It takes several -- or as I often say, persistence.
Right now my math says it would take a net differential of -1,700 advancers minus decliners on the NYSE to halt the rise, and more to roll it over.
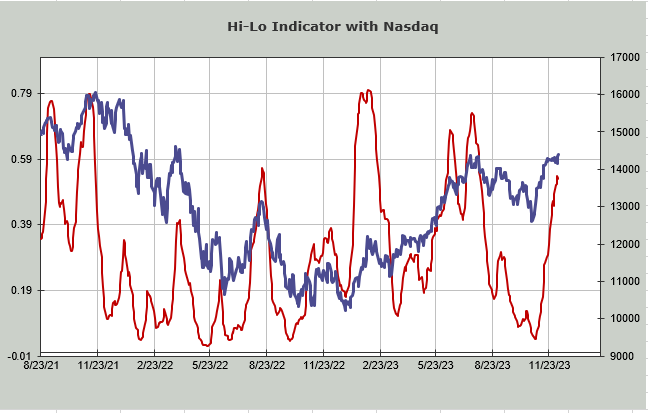
The Volume Indicator is now at 56%, so it is overbought. The new highs have stopped expanding but the Hi-Lo Indicator has only stalled, not yet rolled over. To be bearish I would also have to see that roll over. The Hi-Lo Indicator chart is shown below.
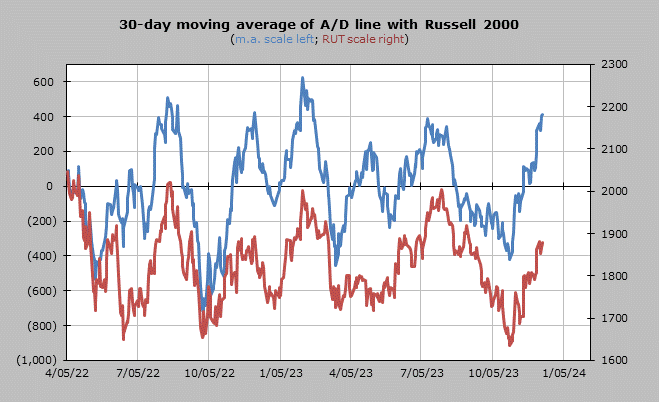
The 30-day moving average of the advance/decline line is overbought but I still think, especially if the market goes down this week, it sets up for a maximum overbought reading just around Christmas.
Then there is sentiment and that is very much pushing the envelope when it comes to bullishness. The AAII bears climbed this past week but the bulls remained the same. The Investors Intelligence bulls were at 55% for the second week, which to me makes the runway short for a rally. The one indicator in this series that is not bordering on extreme is the NAAIM Exposure as it sits just below 80. Recall this one got to 102 in early August.
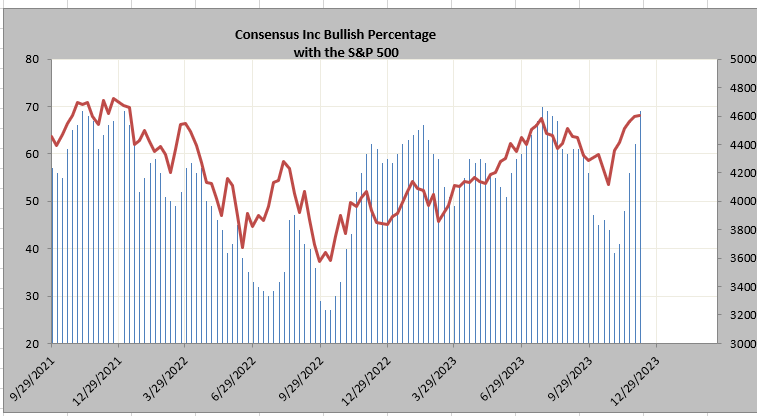
This past week the Consensus Bulls joined the party with 69% bulls. They were 70% this past summer. Recall a few weeks ago I noted we still had room to run on the upside because these folks were still around 55%.
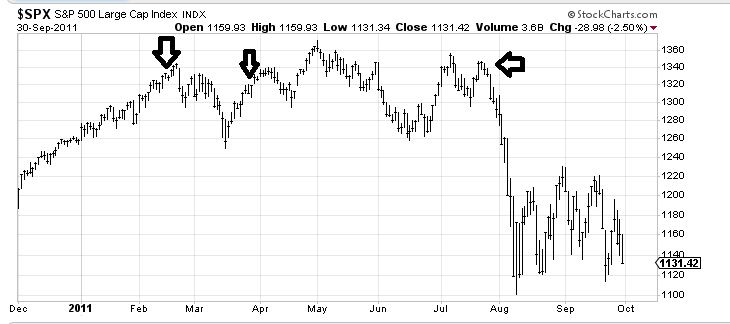
Then there is the ISE call/put ratio. The 21-day moving average did not tick down this past week, which surprises me. Generally it will tick down and then back up (and then down!) before the rally is done. What I do find interesting is that the equity portion has now had five straight days with readings over 2.0, something that hasn't occurred since late July 2011. Yes that long. What's even more interesting is in 2011 we had three of these long strings. I've marked them on the S&P 500 chart of 2011 below:
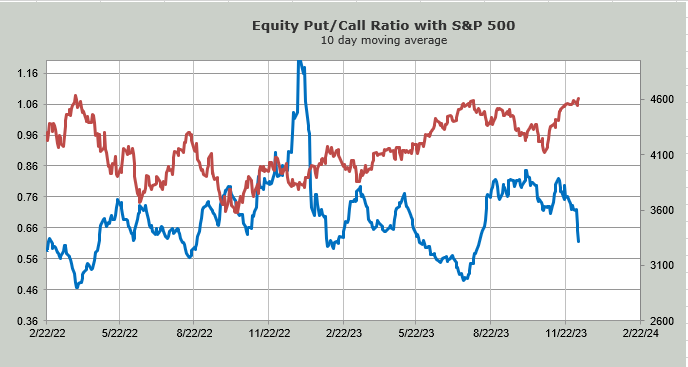
Then there are the put/call ratios. The 10-day moving average of the equity put/call ratio has finally started to come down, although it is not yet extreme. However, you can see the slide in the last week as folks got more bullish.
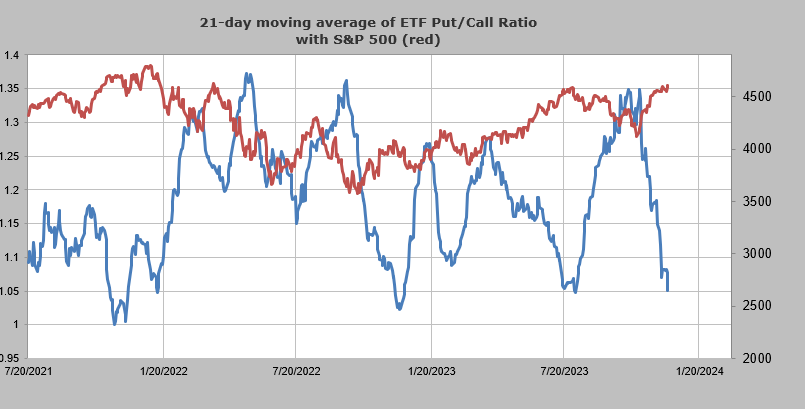
The 21-day moving average of the ETF put/call ratio is getting extreme, although it hasn't turned back up yet. Clearly there are not many bears left playing the ETF options market.
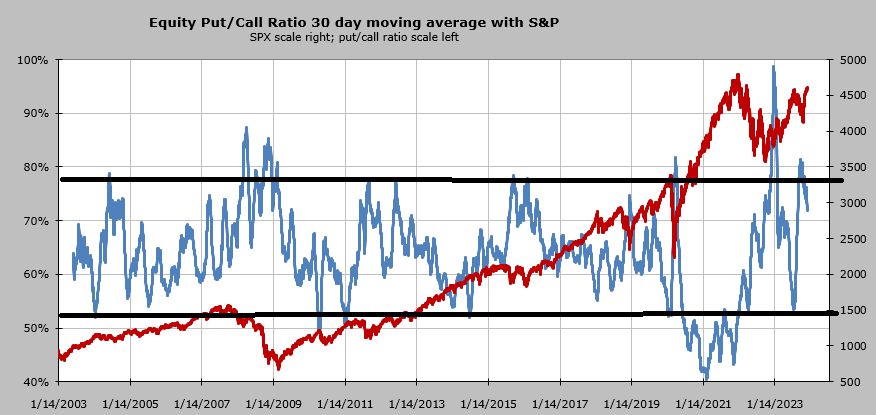
Let me finish up this put/call ratio discussion by noting that the 30-day moving average of the equity put/call ratio has only started heading lower. You might recall we looked at this several times last summer and earlier this fall. In the summer because it had gotten so low, and in the fall because it had gotten so high.
Typically this indicator spends most of its time in between those two black lines. I have done some math and if the equity put/call ratio stays the way it has been in the last two weeks this moving average will, in early 2024, be quite close to the lower black line.
Finally, the Daily Sentiment Indicator (DSI) for the Nasdaq is back to 79. If we keep on creeping upward this coming week it could be 85 by the time the Fed meets midweek. Be that as it may, if the market doesn't fall apart between now and year-end, this indicator is likely to be in the mid-to-upper 80s, or even over 90 by the time we enter 2024.
In sum, there are plenty of signs the market should pull back. But my inclination is still to think that if we do pull back we'd still get one more rally before year-end. The indicators say it is late in the rally and early 2024 could see the next more significant pullback in the market.
New Ideas
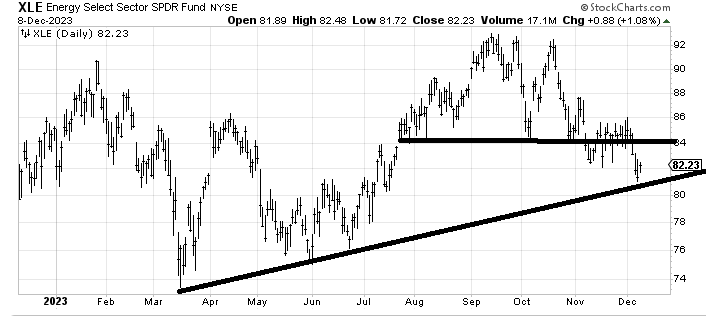
The only group I see that is oversold is, once again, energy. Energy stocks bounced a small bit on Friday but they remain oversold and therefore worthy of bottom fishing.
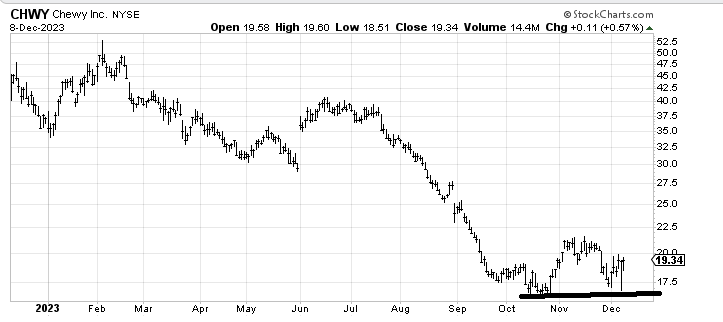
I would also like to follow up on ChewyCHWY, which I was asked about a few weeks ago. At the time I said if the stock can come back down and hold the $18 area it would be worth a shot because of decent risk/reward. The earnings the other day were terrible, though, and the stock didn’t break. Now if it can get itself up and over that November high ($22-ish) it would be even better.
Today's Indicator
The Hi-Lo Indicator is discussed above.
Q&A/Reader’s Feedback
Helene welcomes your questions about Top Stocks and her charting strategy and techniques. Please send an email directly to Helene with your questions. However, please remember that TheStreet.com Top Stocks is not intended to provide personalized investment advice. Email Helene here.
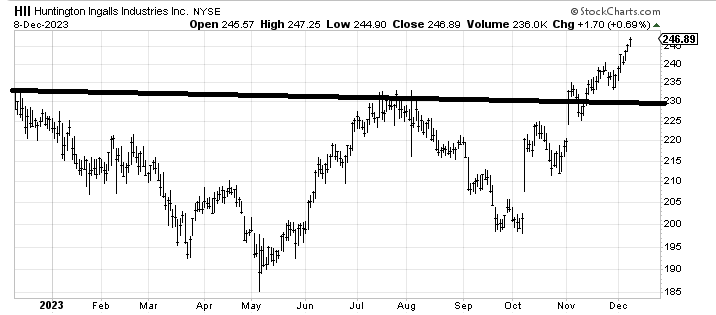
Huntington IngallsHII has an unfulfilled measured target around $270. I doubt the stock gets there in a straight line but as long as it doesn't make a lower low it ought to make its way there. A pullback toward $240 would be good. One under $233 would not.
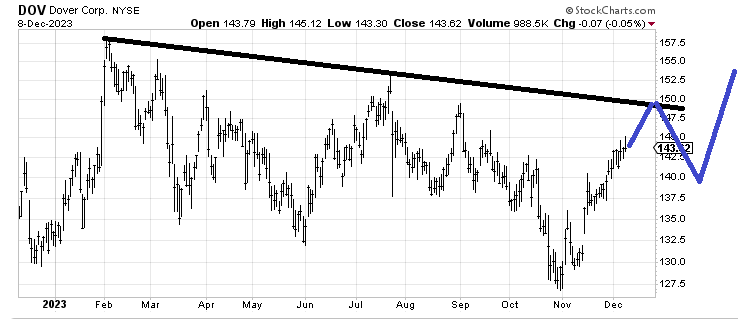
Dover Corp.DOV has too much resistance overhead for me to want to put new money to work here. I’m not even sure if a pullback toward $135-135 would help it much. Instead, I think it’s going to take a lot of time. Perhaps if it played out as I have drawn in blue it would give me more confidence in the chart.
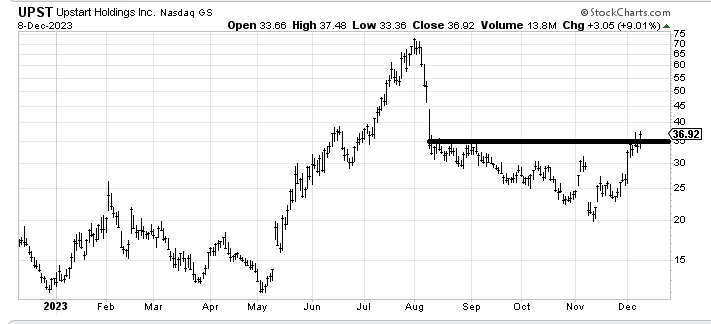
Upstart HoldingsUPST is trying to break out. As long as the stock stays over $35 I would think it should make a try for that gap fill around $45. But back under $35 and this will look like a false breakout.
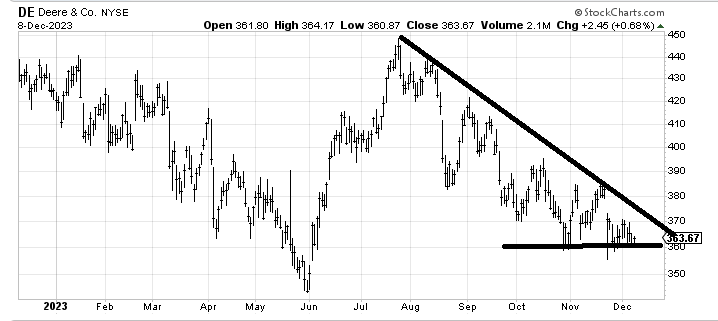
On a risk/reward basis DeereDE is good down at these levels. Break this $360 area and you know you’re wrong. Get over that downtrend line and it improves the chart even though the first target would be a gap fill around $380.