One Survey Says the Bears Outnumber Bulls. But Is It Correct?
Among individual investors, there may be more bears than bulls. But other surveys and indicators seem to disagree.
You've reached your free article limit
You've read 0 of 1 free Pro articles.
Let me begin with sentiment. You might have seen that last week’s American Association of Individual Investors (AAII) weekly survey chimed in with more bears than bulls. You might have even seen a few folks tell you this is bullish. Typically when there are more bears than bulls, I would be the first to agree.
However, longtime readers will know I think this particular survey isn’t a very good one. I won’t bore you with the long list of reasons, but know that I have always said it is a good survey when it is confirmed by other sentiment indicators. Presently I cannot find one other sentiment indicator that has a similar bent.
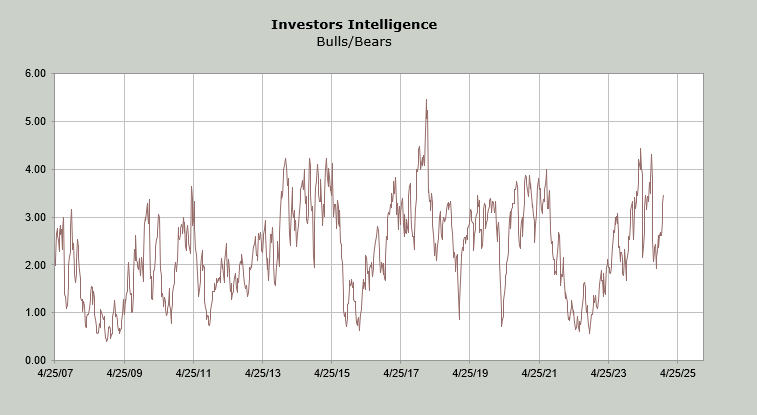
The Investors Intelligence bull/bear ratio is currently 3.46. Does that look low to you? It certainly doesn’t say more bears than bulls. In fact a reading over 4.0 (four bulls for every bear) says ‘buyer beware’.
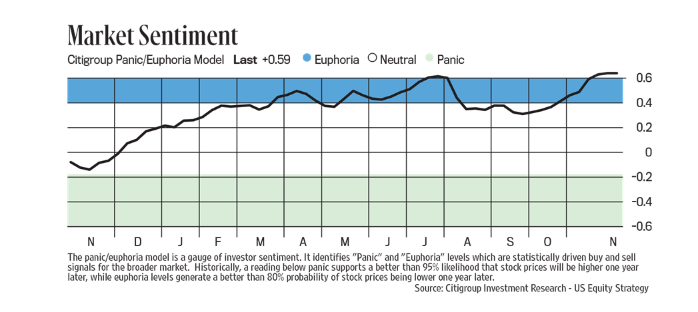
The Citi Panic/Euphoria Model is currently higher than it was in July and literally off the top of the chart. I can’t even pretend this says there are more bears than bulls.
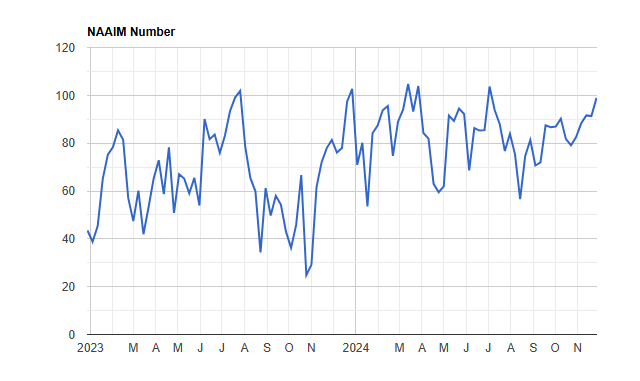
But let’s check in on the National Association of Active Investment Managers and their exposure to the market . It currently sits about a point under 100 (over 100 they are on margin). This is the highest reading since July. Does this speak of more bears than bulls to you?
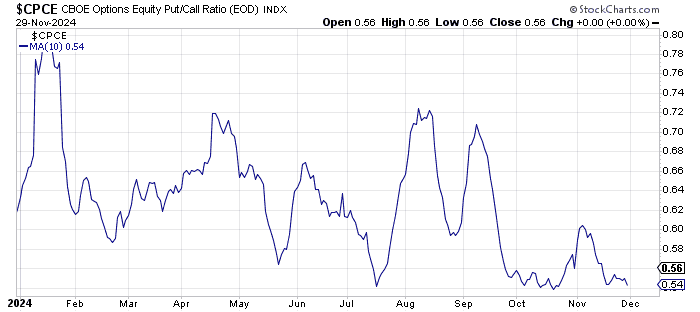
Or maybe we should look at the ten-day moving average of the equity put/call ratio, since this is not a survey but what folks are actually doing. It sits right at lows. Sure it can go lower but does this look like there are more bears than bulls out there?
Markets don’t rally because there are too many bears nor do they fall because there are too many bulls. But surely we can –and should—differentiate when there is an indicator that is an outlier and therefore should be looked at with skepticism.
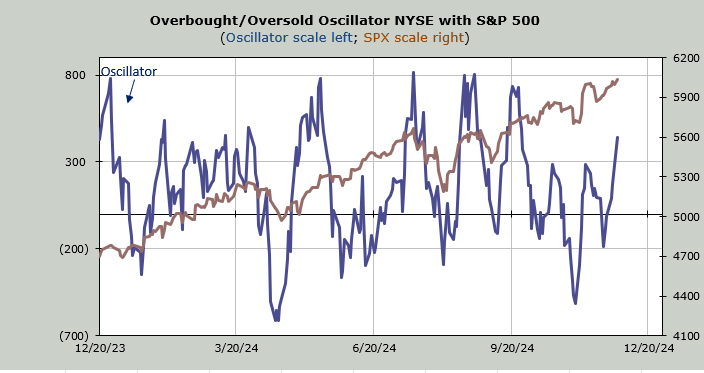
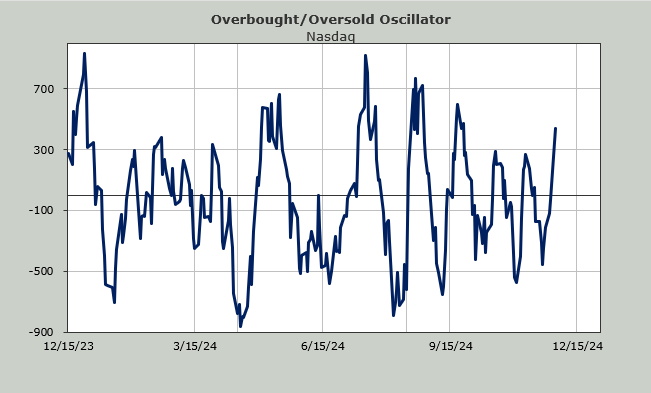
The Overbought/Oversold Oscillator will be back to overbought later this week.
Breadth has been fine—in fact it has been positive for five of the last six trading days—so the McClellan Summation Index is trudging upward even if so many stocks seem to be doing a lot of churning.
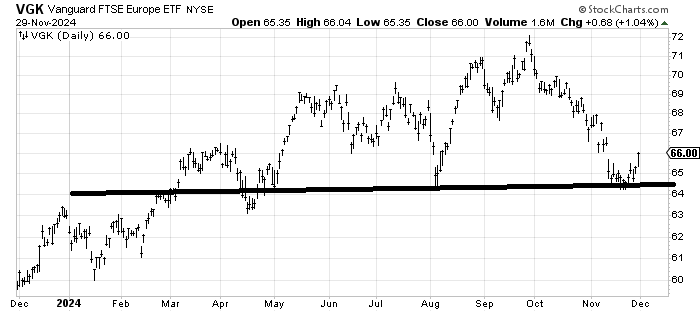
Meanwhile, I have received a few questions on the European markets as they are so down and out. If we look at the chart of VGK, an ETF to be long Europe, it has a decent risk/reward because it is sitting right at the lows. If it turns south from here and breaks 64 You know you are wrong to get involved.
Clearly it has run counter to the path of the US Dollar Index (thus it moves with the Euro). So if the buck is going to back off (it has and should continue to do so), this should be able to lift.
It may just rally to resistance and form a head and shoulders top, but for now, it is down and out and Europe is unloved.