More Signs Point to a Rocky August Than a New Bull Run
When sentiment indicators get this stretched, it is reasonable to expect something to come along to give the market something to panic over.
You've reached your free article limit
You've read 0 of 1 free Pro articles.
You know all those charts that float around stating the number of days the S&P 500 has gone without a 2% pullback? I’m never sure why it matters because last week the S&P managed a 3% pullback, only it was over a few days. So that doesn’t count for these charts.
To me a 2% drop in a day is typically panicky. During a 2% drop we typically see 90% of the volume on the downside. We see the TRIN (Trading Index) surge over 2.0. We see incredibly lopsided breadth. We see the VIX get jumpy. We see volume surge, especially in the QQQs.
In other words, a 2% drop is usually a very good shakeout. What we have had in the last week is not very panicky. Oh sure the VIX has "rallied" but it has not gotten jumpy. And we certainly haven’t seen anything akin to a 90% downside volume day.
The one thing we definitely did not see last week was a pick up in the put/call ratio. That is unless you consider the equity put/call ratio getting to 0.60 a pick-up (I do not). If we look at the 30-day moving average of the equity put/call ratio for the last 20 years what we see is that it has ticked just under 0.60 for the first time in a year.
We also see that once this ratio gets into the mid-50s it’s usually time for a snapback. Yes, I know the period of 2020-2022 saw this go well outside the range but mostly it has spent the last two decades between the mid-50s and mid-70s.
When it does go outside the range we are near a low or a high in the market. See how it surged to 0.81 in the fall of last year? See how it dropped to 0.54 in the summer of 2023?
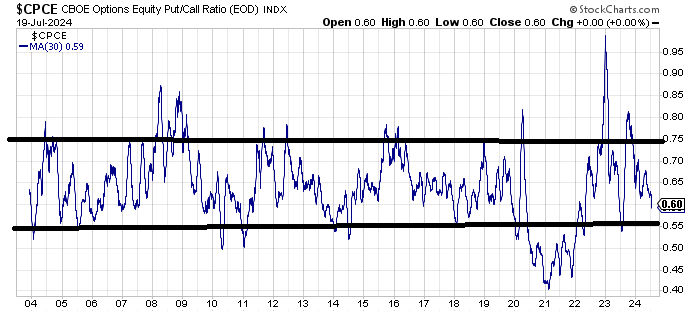
With this indicator pushing toward the lower end of the range (my estimate is it will get into that mid-50s area in the next week to 10 days) it would be more likely that the month of August brings us a pullback than a resurgence to the upside. Maybe we’ll finally get one of those 2% down days!
The Market Vane Bulls ticked up as well. They now reside at 73%, which is the highest reading since May 2007. So let’s take a look at 2007.
You can see the Market Vane Bulls were persistently high beginning in January 2007. The peak reading was in May. Look at that rally we enjoyed from the March low to the summer high.
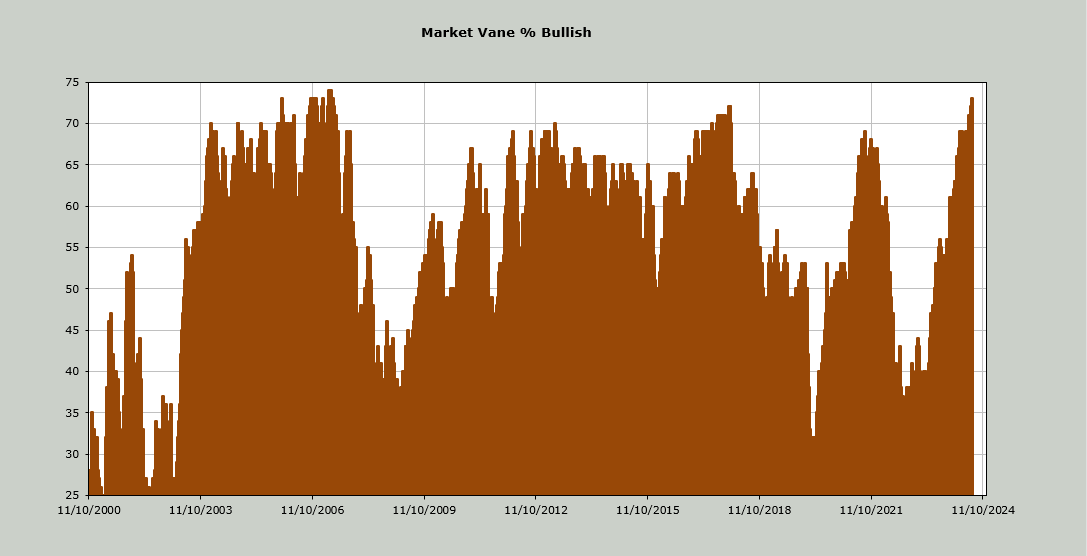
Now let’s see what happened after that reading in May. We climbed a bit more, albeit in quite a choppy manner, until July. Then came the first shock as we fell 10% in a matter of weeks. We rallied again into October, but it was a marginal new high.
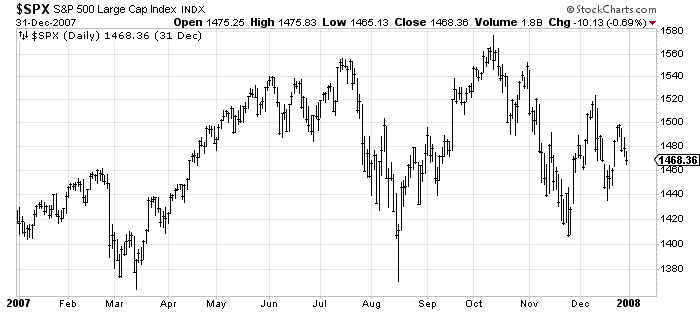
This is not meant to scare you, it is meant to illustrate that when sentiment indicators get stretched as they are now, it is reasonable to expect something to come along to give the market something to panic over. If we do get a bounce this week that would take us into an intermediate-term overbought reading around the end of the month.