Liftoff or Top? Looking Back at History to Understand Today.
Does the market in 1999 hold clues for what may happen next?
You've reached your free article limit
You've read 0 of 1 free Pro articles.

I wish there were a way to measure the sentiment of just one group in the market. And of course, that group would be the semis. Oh, I can give you anecdotal evidence, but nothing in terms of hard data.
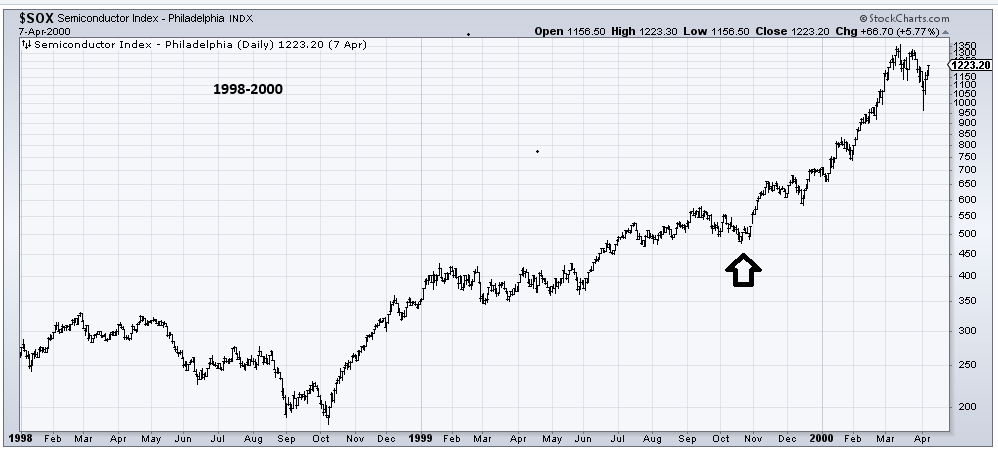
With Friday’s spectacular performance and continued winning streak, I looked back at what the SOX did back in 1999 and 2000. I had forgotten that in the last six weeks of the run to the top in 2000, the SOX nearly doubled. So, I simply posted that on social media Friday afternoon. I didn’t even include a chart. It was just a statement. Boy, did that get folks riled up.
I wasn’t looking for an analogy because, as I am fond of saying, all those chart analogies tend to end up in a 1929 Crash scenario, but the reaction I got to this post was enough to make me go look at the analogy.
There were those who said this was more like the lift-off from October 1998. There were those who thought it was more like the mid-1999 run. I would say those who were bullish (i.e., they were equating the run to 1998 or 1999 rather than 2000, which was the final run) far outweighed the folks who thought this was like 2000.
The similarities are quite interesting. All I did was look back two years from now and two years from the 2000 top.
The sideways action from spring of 2024 through the Tariff Tantrum in 2025 can possibly equate to the period from early 1998 through October 1998 (for those old enough to remember: the LTCM panic was in October 1998). After that, in both cases, the SOX went on a run, from new low to new high in a matter of months.
Then there was a period of sideways digestion for both. Both times, we then saw another ramp. The big divergence in the two pictures arrives in late 1999 and early 2026.
In 1999, the SOX just lifted off, from around 500 (arrow) with tiny pullbacks along the way. In early 2026, the SOX had quite a correction—nearly twenty percent. Unlike 1999, where there was a series of higher lows, now, in early 2026, there was a series of lower lows preceding the latest lift.
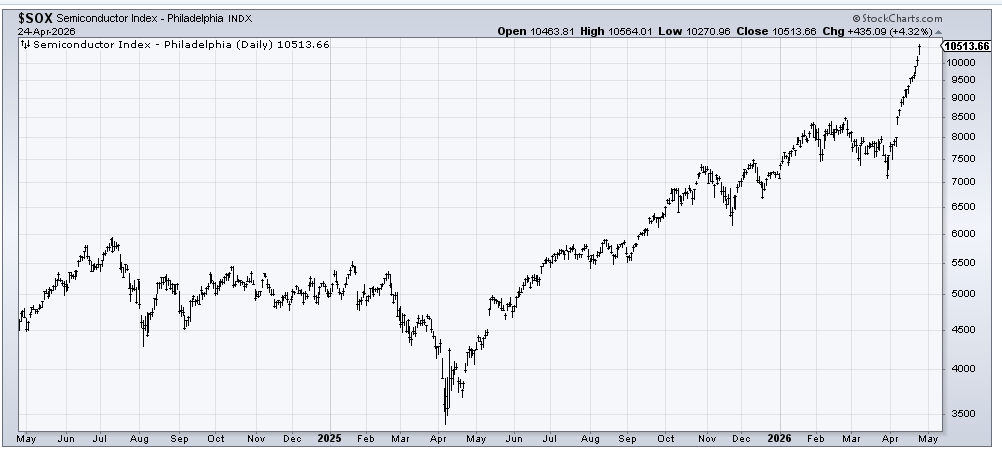
Since all analogies diverge eventually, this is pretty normal for them to look different at some point (I have made that point about the software stocks likely to diverge from the Sentiment Cycle at some point). There is one consistency in the two charts, though: the persistence of the latest run is just as impressive as the consistency in the near doubling in the late winter of 2000.
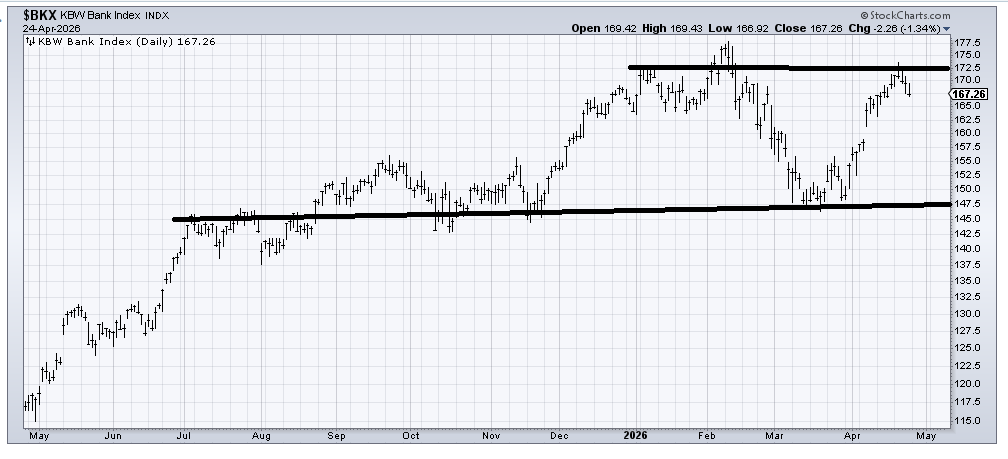
Late last week, I said I thought we’d see a down day in the SOX. That was clearly wrong. But one thing I can say is that the market has become so fixated on the move in the semis that no one even seemed to notice that the Bank Index lost three percent last week.
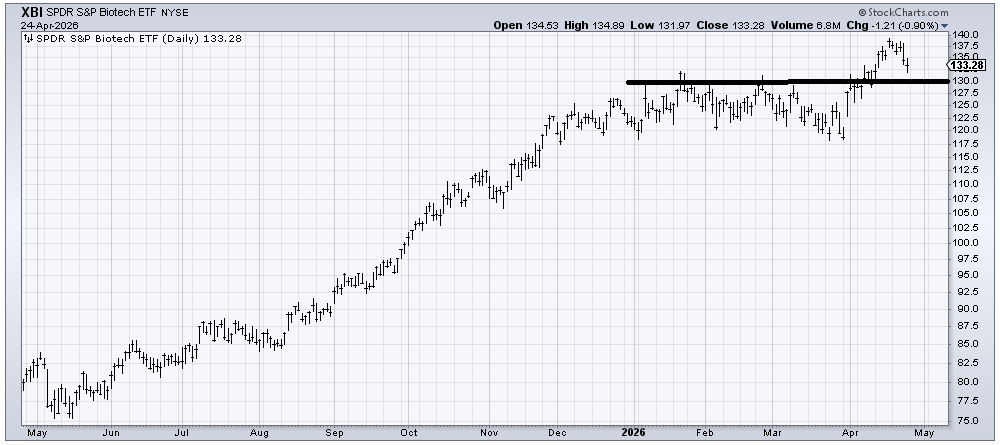
And while I know the biotechs are not a big deal in terms of the market overall, the XBI was also down three percent last week. The short-term overbought condition is at work. I’d call it group rotation, but so far, the only group getting rotated into is the semis!
Related: As Markets Ignore Reality, Akamai’s Selloff Creates an Opportunity
