Large-Cap Gains Masking Underlying Weakness
Things are not as rosy as the large-cap indexes imply.
You've reached your free article limit
You've read 0 of 1 free Pro articles.
Trouble brewing "behind the scenes"?
Tuesday's market action left the index chart trends mixed with only two bullish patterns. Also, some support levels were violated along with some 50 DMAs. In our opinion, however, the gains on the popular large-cap indexes are masking further deterioration from a macro perspective.
The data remain largely neutral except for investor sentiment (contrarian indicators) that finds too many bulls on one side of the boat. Additionally, the forward valuation for the S&P 500 still finds the index at a significant premium to ballpark fair value.
Large-Cap Gains Masking Underlying Weakness
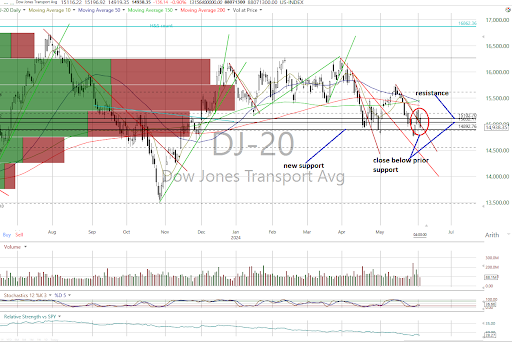
On the charts, the major equity indexes closed mixed Tuesday with negative intervals as trading volumes declined on the NYSE and Nasdaq from the prior session.
Technical weakness was seen as the Dow Jones Transports and MidCap 400 closed below support while the MidCap and Russell 2000 closed below their 50-day moving averages.
There were no changes in their near-term trends that find only the Nasdaq Composite and Nasdaq 100 bullish, the S&P 500 neutral, and the rest in bearish trends.
Cumulative market breadth also leaves something to be desired as the All Exchange and NYSE advance/decline lines are neutral with the Nasdaq’s bearish.
No stochastic signals on import were registered.
Data Remains Mostly Neutral, But Beware of Sentiment
The data remain mixed.
The 1-Day McClellan Overbought/Oversold Oscillator are still neutral (All Exchange: -33.16 NYSE: -32.25 Nasdaq: -34.03).
The percentage of S&P 500 issues trading above their 50-day moving averages (contrarian indicator) slipped to 46% staying neutral.
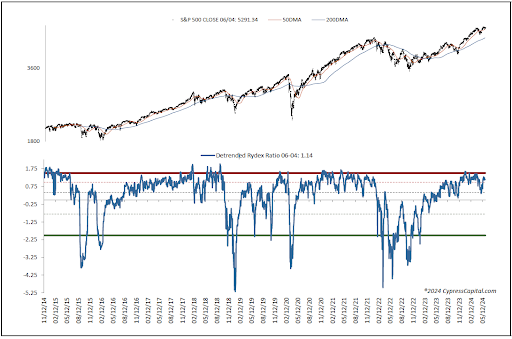
Of note, the detrended Rydex Ratio (contrarian indicator) remains on its warning signal as the typically wrong leveraged ETF traders continue their leveraged long exposure at 1.14.
This week’s AAII Bear/Bull Ratio (contrarian indicator) dropped to 0.6 and is neutral as the number of bulls increased.
However, the Investors Intelligence Bear/Bull Ratio (contrary indicator) is bearish at 17.9/58.2 as bulls also increased and outweigh bears.
The Open Insider Buy/Sell Ratio is neutral as it dropped to 44.2.
Leveraged ETF sentiment is -9.1, remaining neutral.
Valuation Continues to Warn
The 12-month consensus earnings estimate for the S&P 500 from Bloomberg edged up to $253.00 per share. Still, its forward P/E multiple at 20.9x remains well above the “rule of 20” ballpark fair value of 15.7x. This 500-basis point premium remains a significant cause for concern.
The S&P's earnings yield is 4.78%.
The 10-Year Treasury yield dropped to 4.34% and below support. Its intermediate-term trend is now neutral versus bullish with new support at 4.31% and resistance at 4.45%.
The U.S. dollar, via the UUP ETF, closed higher at $28.53. It is neutral with support is $28.4 and $28.65 is resistance.
Bottom Line
The weight of the evidence suggests things are not as rosy as the large-cap indexes imply. Some caution remains warranted as we honor sell signals while staying very selective on the buy side.