In This Kind of Market, It's Chop Till You Drop
Chopfests are not only difficult to trade, they are typically a recipe to lose money.
You've reached your free article limit
You've read 0 of 1 free Pro articles.
Earnings season is typically exciting. Folks sit around and wait for important earnings to be released and then the stock moves — sometimes wildly — and everyone gets to trade it and chatter about it.
Yet we are more than a week into earnings season and the S&P 500 has barely budged. Oh sure, the small-caps were up on Tuesday (more on that below) but as a reminder the IWM fell 3% last week so it too is still milling about. Perhaps the remainder of earnings season will bring us a big move but thus far the word is chopfest.
Chopfests are not only difficult to trade, they are typically a recipe to lose money because if you make money here, you lose it there. But have any of the indicators changed? Not much.
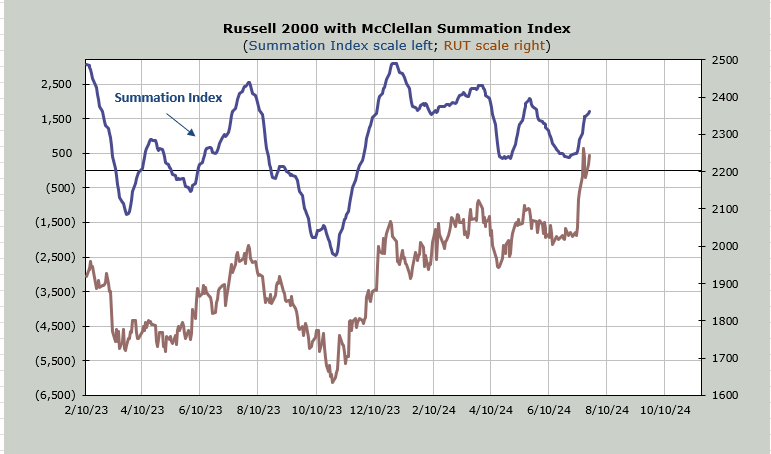
The McClellan Summation Index is still heading upward. The one for the NYSE that is. It would need a net differential of -900 advancers minus decliners to halt the rise.
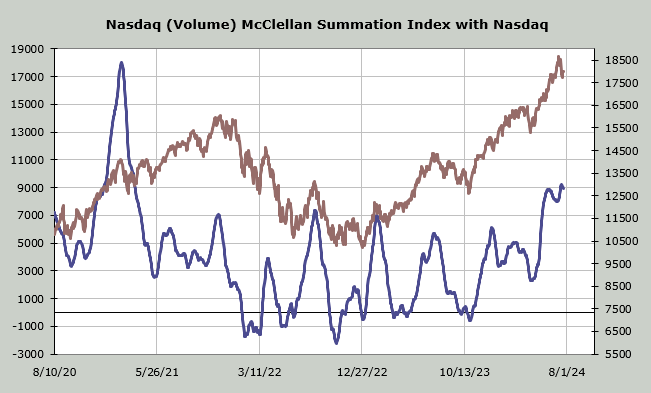
However over on the Nasdaq, where I prefer to use volume instead of the advance/decline line, it has turned down. It would need a net differential of +2.5 billion shares (up volume minus down volume) to halt the decline.
Speaking of volume, the total volume has tailed off — not a surprise because we are in a chopfest right now — but during Tuesday’s 1% rally in the Russell 2000 net volume for both the Nasdaq and the NYSE was flat to slightly negative. That is highly unusual.
You know what else is highly unusual? Breadth (the advance/decline line) was barely positive. Again, that is highly unusual for a day when the Russell is up 1%. Right now I think it’s part of the choppiness but keep in mind that I am still of the view that August should bring us some downside.
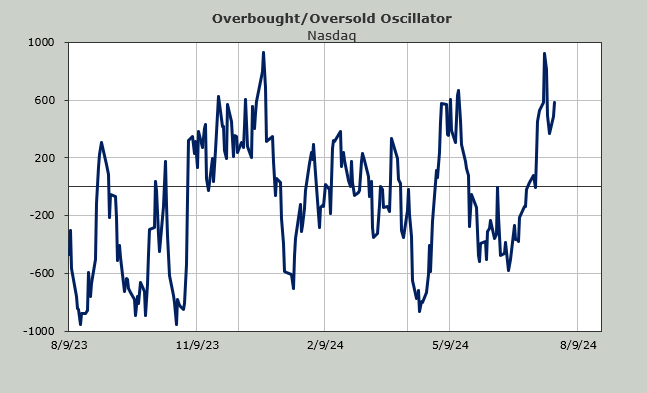
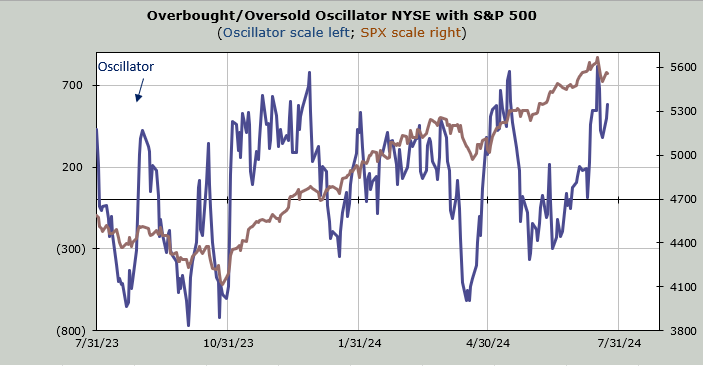
I still think we are set to be intermediate-term overbought in late July. And I still believe sentiment got too stretched with the Great Unwind. And something needs to happen to curb that enthusiasm.
On Monday we saw the enthusiasm tail off a bit with the ISE Equity call/put ratio coming in at its lowest reading since late May. Tuesday the CBOE’s put/call ratio was 0.96. That is the highest such reading since June 6. So folks are not loving the action or at least they want to hedge it out.
The various moving average lines for these two sentiment indicators haven’t moved enough to where I can even show it to you on a chart but recall I am looking for the 10-day moving average of the total put/call ratio and the 30-day moving average of the equity put/call ratio to trough in the next week or so. These sorts of readings reinforce my view.