If Stocks Slip This Week, Don't Fret
My view hasn't changed that a fall in the market this week should be met with a rally later. Also, let's check on lots of charts: Johnson & Johnson, CVS and more.
You've reached your free article limit
You've read 0 of 1 free Pro articles.
The Market
Let me begin with an apology. I use the Wall Street Journal as my data source and their data feed is not working today, so many of my statistics and indicators for the day’s action are untrustworthy today.
For example, the paper listed the New York Stock Exchange breadth at 1,218-1,122. That’s fine, except that this adds up to approximately 2,350 total issues. Most days the NYSE typically trades approximately 2,800-2,900 issues. They also showed NYSE volume at 78 million shares and we know that is incorrect.
That said, I did see during the trading day, that breadth was mostly flat, which means I can honestly say that for all the talk of broadening out, today was not a broad day. The McClellan Summation Index, however, is still rising. It would require approximately -1,700 advancers minus decliners on the NYSE to halt the rise.
As you know, most of the intermediate-term indicators are either overbought or close to it, but unless the Summation Index actually rolls over, the market gets the benefit of the doubt.
I will, however, update you on the Daily Sentiment Index. Nasdaq is now at 82, and the S&P is at 78. If we continue on the upside, Nasdaq will be in the upper 80s, low 90s by the end of the year.
If we do see the market pull back later this week, I would then expect another rally next week. That won’t change.
New Ideas
I would like to do some follow-ups tonight.
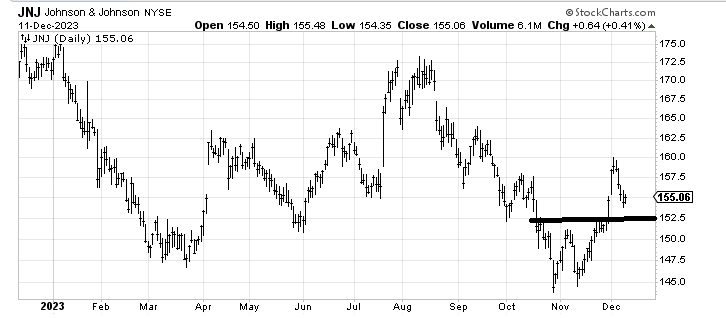
Johnson & Johnson JNJ had a great run and has now pulled back. If it can come down to around $153, that would be a good place to add back what you traded away. But somewhere between $153-$155, I expect it to bounce again.
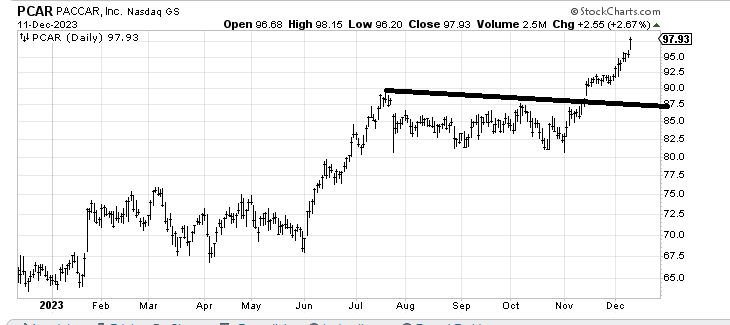
Months ago I noted that PACCAR PCAR had not sold off at all and if it broke out it would be bullish. That move measures right to $97-$98 where it is. The 90/100 rule is also in play (90% of stocks that make it to $90 will make it to $100). So I would consider taking some profits in this area and holding the rest with a trailing stop.
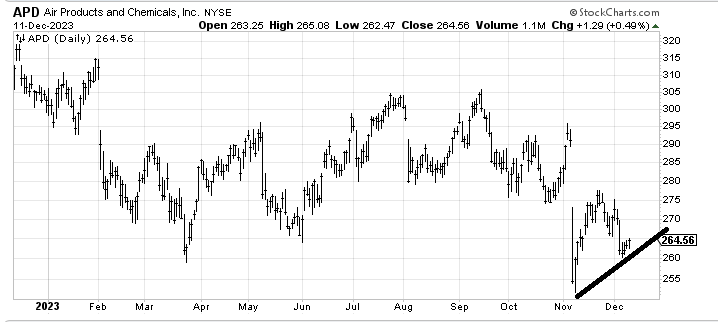
Finally a follow up on Air Products APD from a few weeks ago. This looks like a small retest of the spike low. It’s got a lot of resistance overhead but as long as it stays over $260 it ought to give the upside another try.
Today’s Indicator
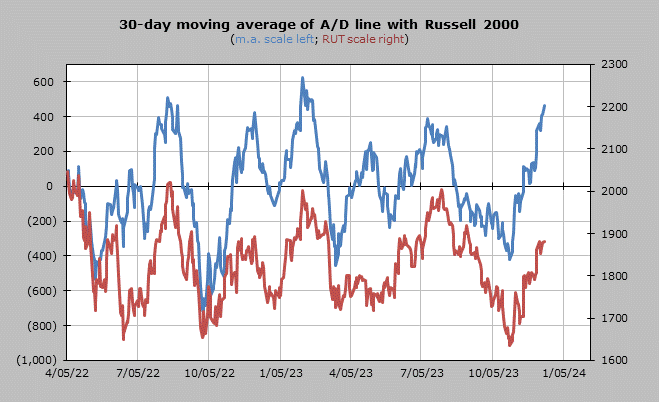
The 30-day moving average of the advance/decline line is overbought.
Q&A/Reader’s Feedback
Helene welcomes your questions about Top Stocks and her charting strategy and techniques. Please send an email directly to Helene with your questions. However, please remember that TheStreet.com Top Stocks is not intended to provide personalized investment advice. Email Helene here.
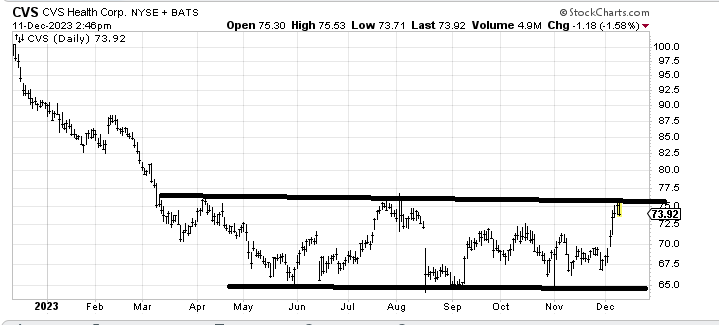
I warmed up to CVS CVS about a month ago and then it promptly went south. Now it has rallied to resistance and considering the overbought nature of the market, I would say it is likely to back off. But on a longer-term basis, this is the sort of chart that ought to do well in 2024, because that is a big base. If it pulls back toward $70 I’d be inclined to be a buyer.
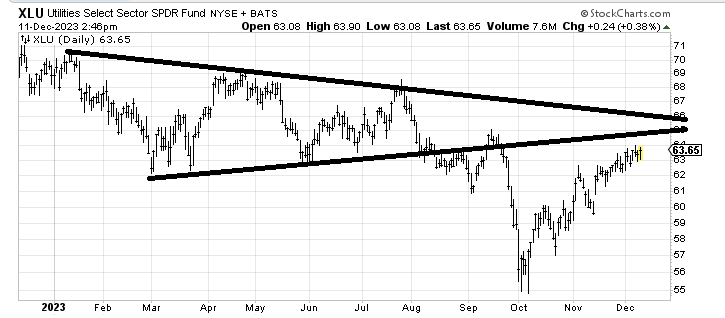
My view on the utilities fund XLU is still the same. I think the best money trading wise has been made. Now it needs to chew through resistance and more likely than not pullback and make for a better chart. I’m a fan of some profit taking in this now.
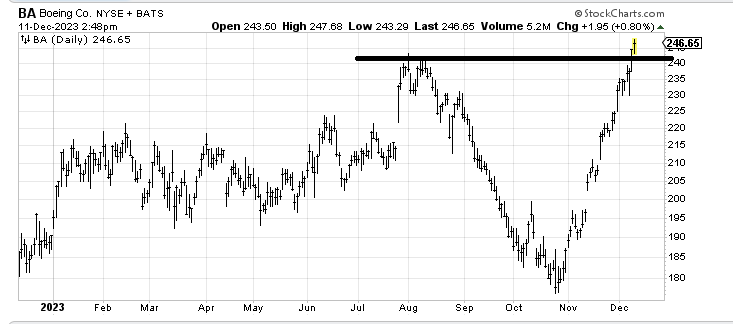
I tried to pick a bottom in Boeing BA around $185-$190. I got a nice trade to $200 and then the stock cracked again. But it has since been spectacular (more so than many of the Magnificent Seven). But it is over-extended now, so I would be in favor of using a stop under $240 or if you want to give it some more room, $230. If I am correct about 2024 it really ought to pull back.
Disclosures: None.
