Commodity Rundown: Where Gold, Copper Have Been and Where They're Going
We're taking at look at major commodities to determine what's next for the market.
You've reached your free article limit
You've read 0 of 1 free Pro articles.
In early June, we wrote about the sudden weakness in copper and what it might mean for risky assets, particularly stocks.
At the time, we were interpreting the copper reversal from its all-time high as a sign of economic dysfunction. After all, they don’t call it "Dr. Copper" for nothing. In addition to the undertones of economic weakness, a plunging copper market signals deflation. Less than two months later, copper has given back $1 in value and appears to be poised for a decline to $3.80. Yet, even after recent selling, the equity market, as measured by the S&P 500 index, is still near the same price it was when the copper market reversed.
We’ve always known the relationship between copper and stocks has a lag effect, but this should concern the “buy the dip” crowd in the stock market. In our view, either the equity market needs to reprice to catch up with the deflationary trend copper is showing, or copper should rebound to realign these assets.
Copper Weekly and Daily Charts
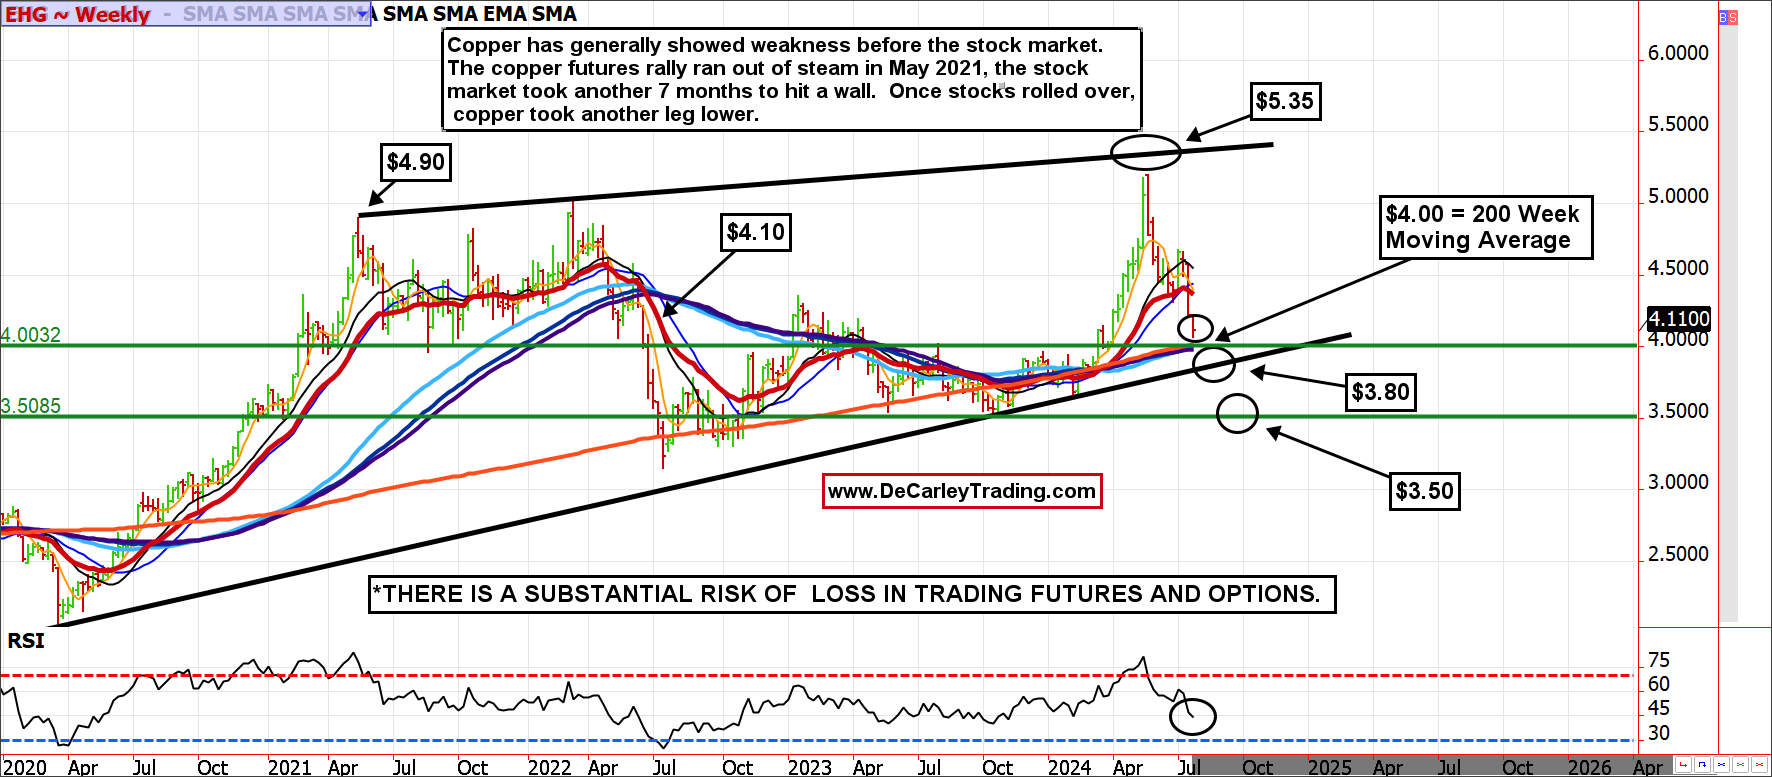
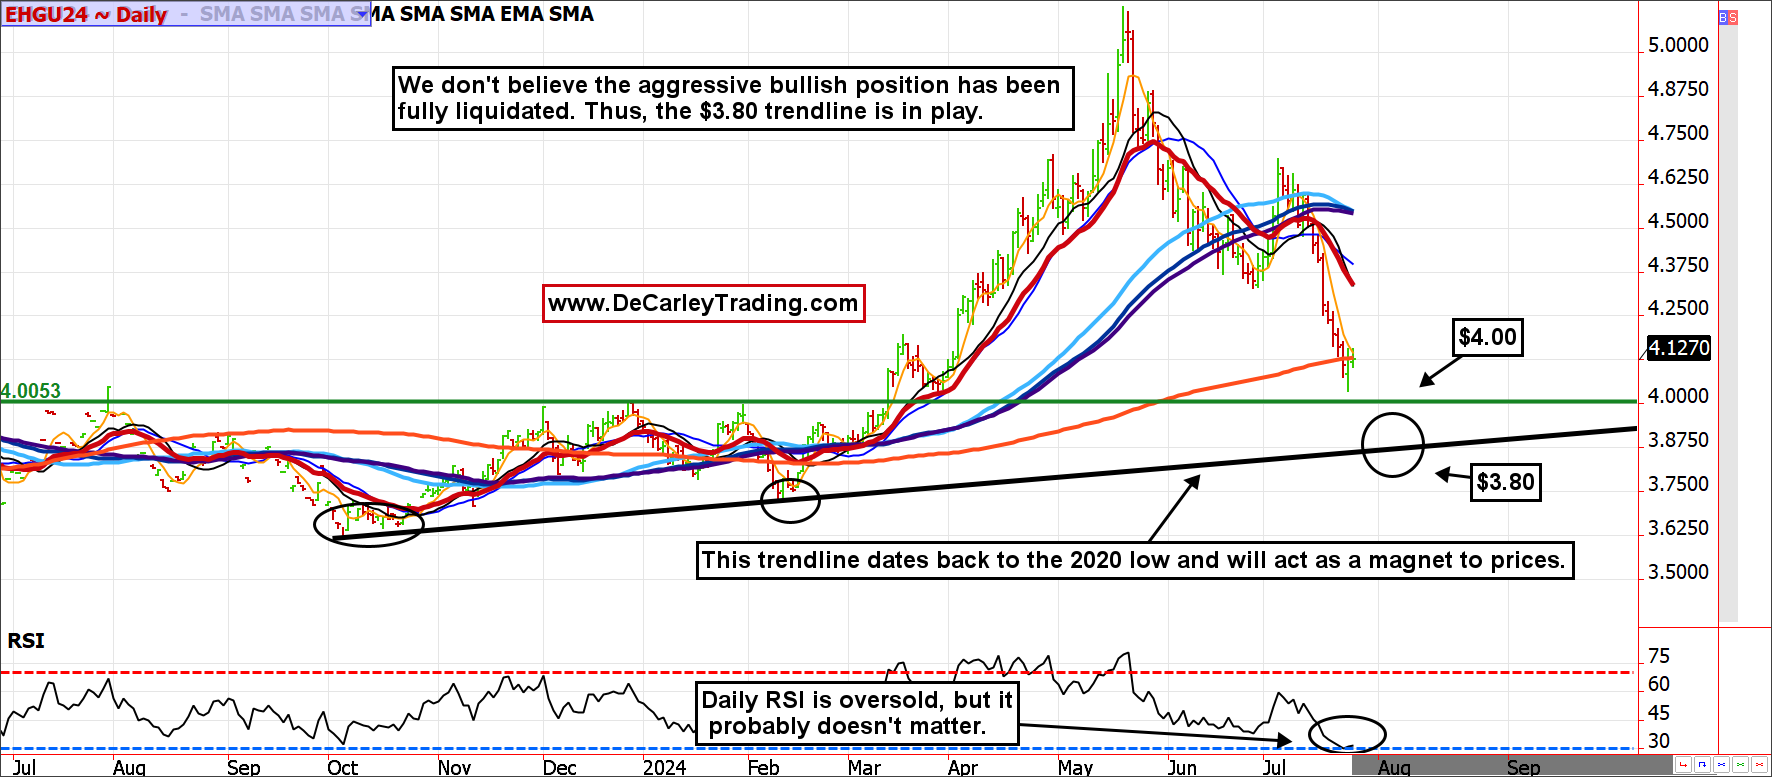
Both the weekly and daily charts of copper tell the same story; there is significant support near $4.00, but we will likely see $3.80 before the selling exhausts itself. Not only is $4.00 psychological support, but it is also the 200-week moving average, and it functioned as a ceiling for two years prior to the latest rally (previous resistance becomes support on the way back down). However, we suspect there are a lot of traders caught on the wrong side of this move; if so, any reprieve in selling will probably begat more selling. Also, the weekly Relative Strength Index (RSI) shows bearish momentum but has further to fall before reaching an oversold status. Thus, the trendline at $3.80 should come into play.
Gold Monthly and Daily Charts
The gold market is notorious for summer swoons followed by sustained rallies; according to our friends at MRCI, the statistical low generally comes on July 24, 2024. In addition to a seasonal tailwind, the mid-week flush out in gold landed precisely on an uptrend line, which appears to have lured enough buyers to thwart a downtrend. The jury is still out, but we believe Wednesday’s plunge had more to do with options expiration and the after-hours unwinding of a yen carry trade than anything related to precious metals fundamentals. In fact, fundamental traders are pounding the table for higher gold prices backed by the prospects of lower interest rates and a lower U.S. dollar, and we concur.
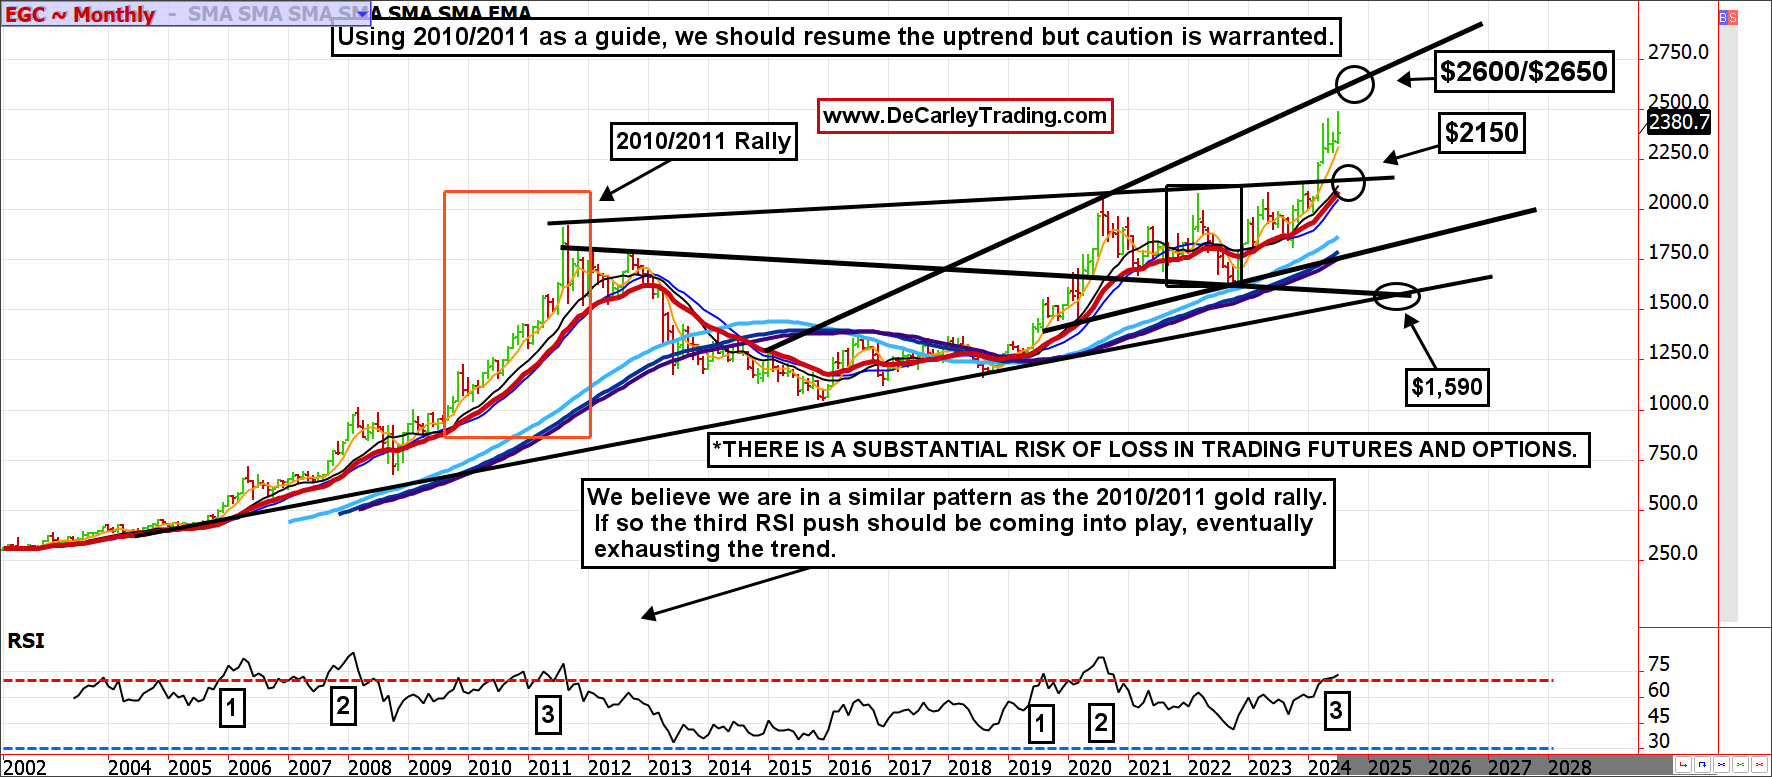
The monthly gold chart should give the bulls some hope as well. We believe we are amid a 2010/2011-style gold rally due to similarities in economic and political uncertainty, and working through the aftermath of unprecedented government stimulus. In later years of the financial crisis, gold prices experienced a relentless rally to roughly $2,100; a new all-time high that took about a decade to surpass. The rally occurred in three RSI waves (and four visible price chart waves), with the third being the largest and longest. We are currently on that third RSI wave; if history repeats itself, we should break $2,500 and run toward the mid-$2,600s. Plenty of analysts have their targets at $3,000 or higher, but we prefer to wait to see how things look when the market reaches the trendline we’ve mapped out on the monthly chart.
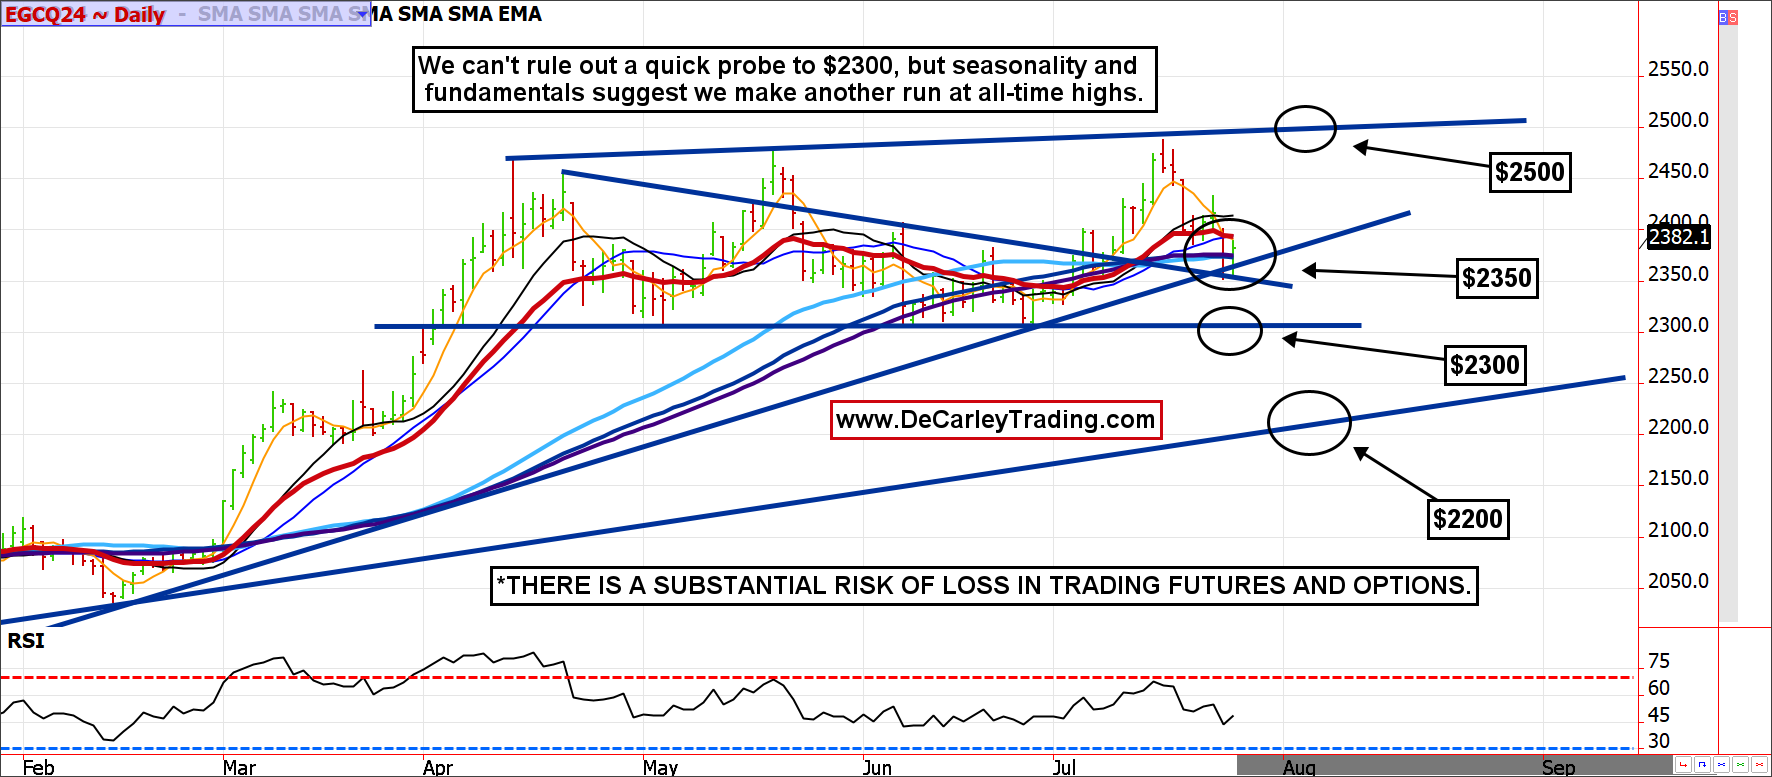
The daily gold chart depicts a market in consolidation; since April, prices have been hovering in a $200 range. However, these chart patterns often resolve themselves in the direction of the trend. With that in mind, we suspect momentum will eventually take prices out of the price range to make a run at our $2,600-plus objective. That said, we can’t rule out a near-term flush to $2,300 (the bottom of the trading range).
Next, we will analyze the ags (meats, grains) and energies (natural gas and crude oil). Stay tuned.
At the time of publication, Garner had no position in any security mentioned.