Are We Partying Like It's 1999? Not Really, But Something's Gotta Give
If you own the big-cap indexes, you're loving this market. If you own small-caps, there many reasons to hate it.
You've reached your free article limit
You've read 0 of 1 free Pro articles.
The Market
There are so many reasons to like this market if you own big-cap indexes. Sure, even within big-cap stocks it’s not all of them, but a good majority of big-caps are heading upward.
There are probably just as many reasons to hate this market if you own small-caps. They have lagged greatly in 2024. But it’s not just the Russell 2000 that has lagged. I saw a stat the other day that more than half the stocks in the S&P 500 are down on the year. That is something when you consider the major indexes are all up.
We are starting to hear chatter, especially after last week’s action, that this is like 1999. As I noted last week, there are some aspects that are similar (AI sounds a lot like dot-com) but in just a few charts I want to show you why it is not similar.
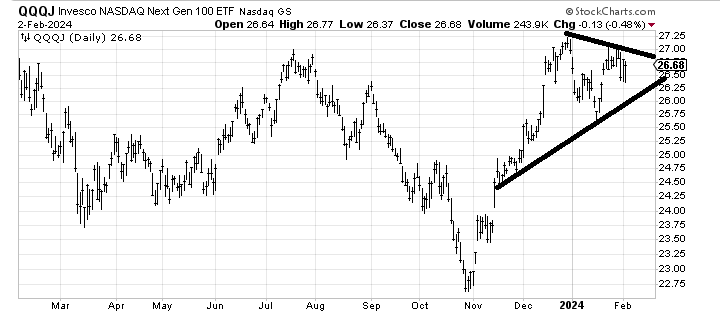
In 1999 every little tech stock you never heard of was soaring a gazillion percent a day -- heck, anything with dot-com in its name. And while it feels like anything with AI is on the run these days, let me show you the chart of Invesco NASDAQ Next Gen 100 ETF QQQJ, which doesn’t trade much but represents the next-generation Nasdaq 100, what I would call the juniors.
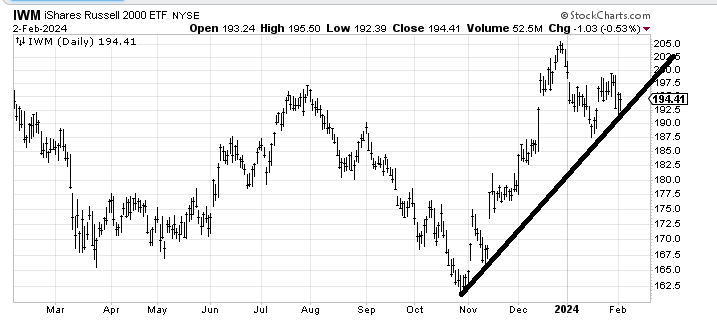
In 1999 this ETF would have been soaring, way up high, because that is how much speculation there was in the dot-com names. Now this ETF looks much more like the iShares Russell 2000 ETF IWM, doesn’t it? These days money is pouring into big-cap stocks, not all that speculative stuff.
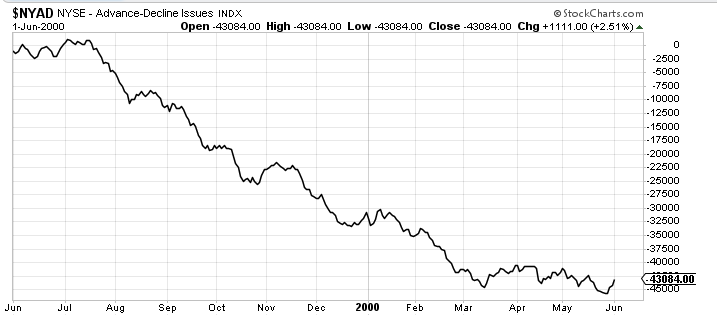
We all know breadth has been lagging. Heck, I complain almost daily about it. But it’s lagging in that it’s not keeping up with the major indexes. It is not lagging in that everything else is being sold on a daily basis. That was the case in 1999. Here is the chart of breadth from June 1999 until June 2000. Do you see that decline in the second half of 1999? Now that was crummy breadth.
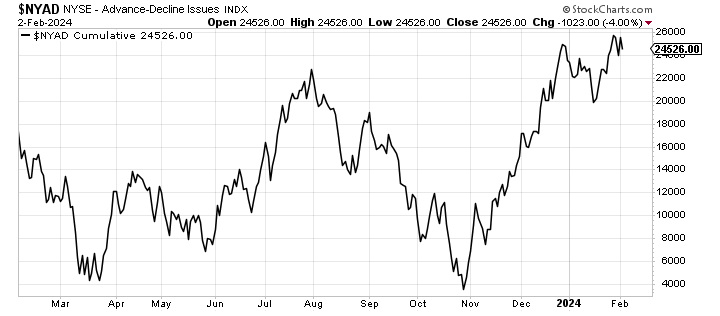
Here is the chart of breadth today. It is just lagging. Where the S&P 500 is nearly 200 points over the late-December high, breadth sits at that late December high. But it is not in a steady downtrend the way it was in 1999.
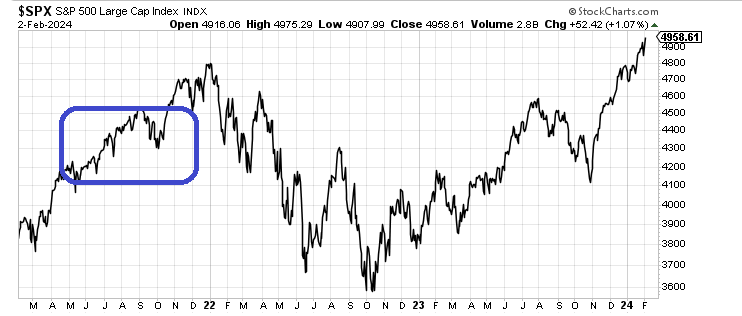
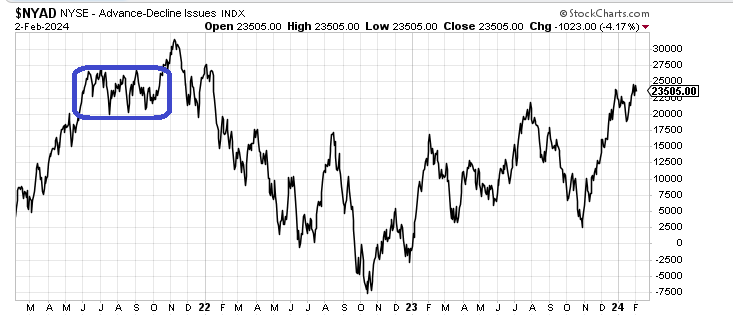
This market feels a bit more akin to 2021. Look at breadth in 2021, below. It lagged considerably as it went nowhere in almost the entire second half of the year (blue box) while the S&P just kept climbing (blue box).
There are two ways to resolve this. Either breadth starts doing better or the indexes keep getting so narrow that they eventually can’t keep pushing higher and they come back down. The market outside of big-caps has had a correction for the last five weeks. The indicators say we really should have a correction -- even in the index movers.
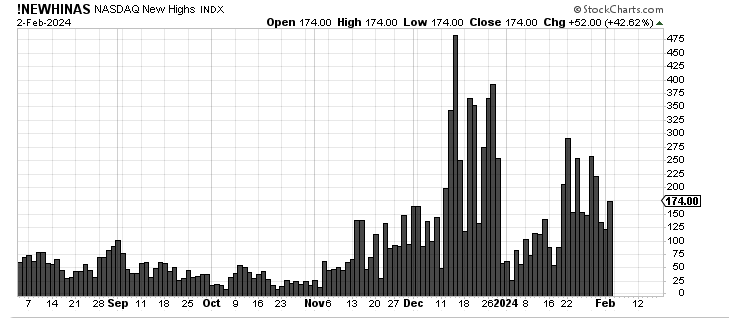
Friday the divergence between breadth and the major indexes was so obvious that I was sure even my mother saw it. I can list all the indicators that say we should have a proper correction but you know them already: the McClellan Summation Index is heading down, we are overbought, sentiment is too bullish (the DSI for the S&P was 83 on Friday), the new highs are lagging, the new lows are expanding (although much more so on Nasdaq than on the NYSE), and the 10-day moving average of the put/call ratio has come back down again, among others.
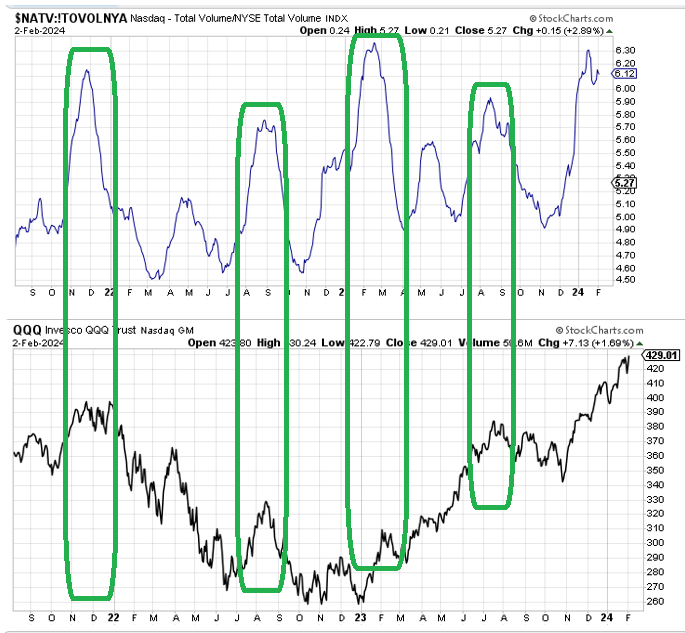
Finally, there is the relationship of the Nasdaq’s volume to that of the NYSE. I plot it on a 30-day moving average and you can see it has gotten quite extreme. Here I have plotted it against the QQQs so that you can see that in each case the QQQs did indeed back off.
I don’t really want to bet against the QQQs because they haven’t done much wrong. Should they back off? Yes, but enough for a trade? I’m not so sure. If the Daily Sentiment Indicator (DSI) was at/over 90 I might feel differently. But something’s gotta give in this market.
New Ideas
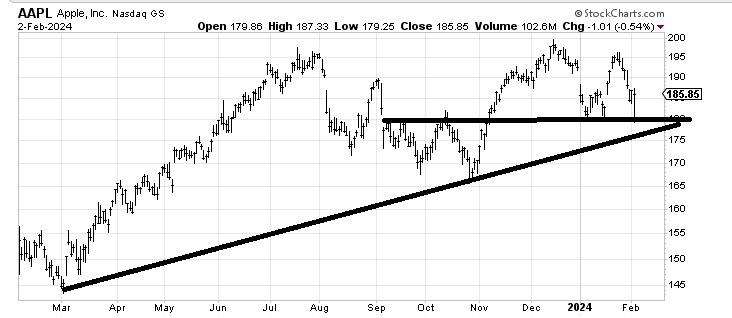
On Thursday night I suggested Apple AAPL for a trade. I would put a stop in under $183/184 if you are conservative, otherwise I think it might get to that $190 area.
Today’s Indicator
The new highs are discussed above.
Q&A/Reader’s Feedback
Helene welcomes your questions about Top Stocks and her charting strategy and techniques. Please send an email directly to Helene with your questions. However, please remember that TheStreet.com Top Stocks is not intended to provide personalized investment advice. Email Helene above.
I was asked if there are any stocks with big bases out there in the tech/growth area. I would remind you that I have shared the charts of Snowflake SNOW and Lumentum LITE with you in recent weeks as well as Adobe ADBE, which is not a base but did look as though it ought to bounce off that $590 area (as it has).
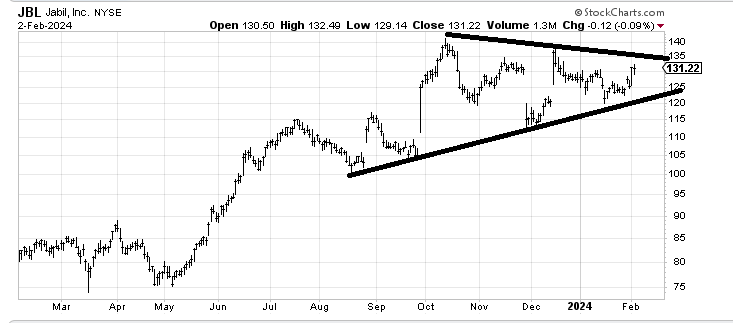
Jabil JBL has been going sideways for four months. If the stock can get up and over that top line ($135-ish) it should work. I will admit, though, I don’t know why JBL has so many gaps in the last few months.
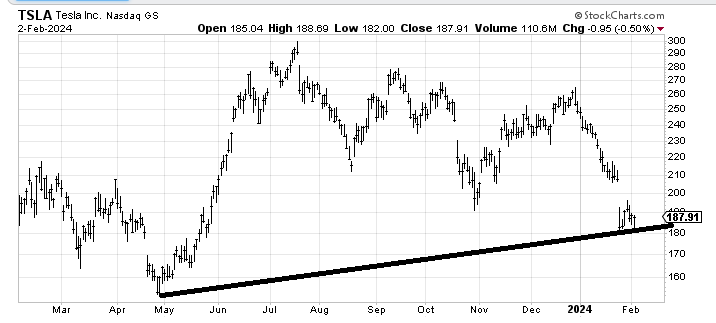
Tesla TSLA has a long term downside target that is around $140. In the near term the stock bounced off $180 so If you want to use a trade back under there as a stop it has a chance at filling the gap above just shy of $210.
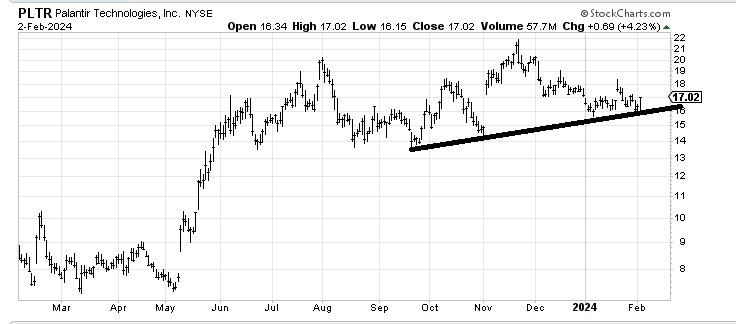
Palantir PLTR is another one of those stocks that has gone nowhere for months. I do not want to see it break under that line, below, though. Near term, that spike at $18.50 will be resistance.
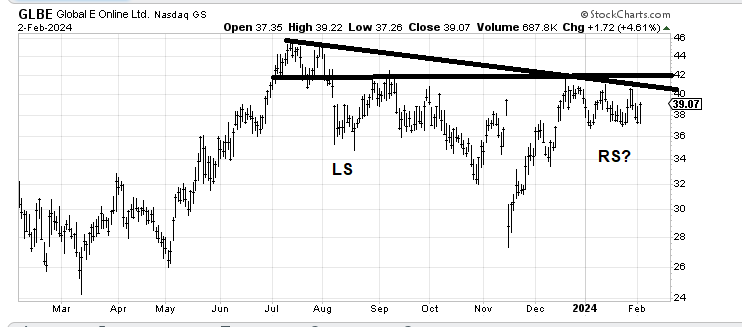
Global-e Online GLBE made me think of Globe.com from the dot-com days but this stock could be forming a head-and-shoulders bottom. A stop under $37-ish is needed.
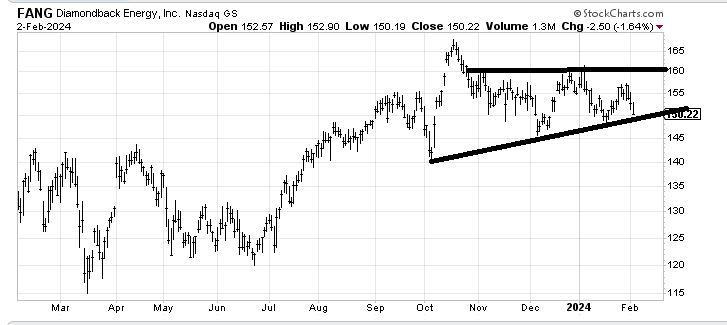
Diamondback Energy FANG needs to hold in this $148-ish area. It does look like it is getting short-term oversold but it should have done better on the last energy rally.
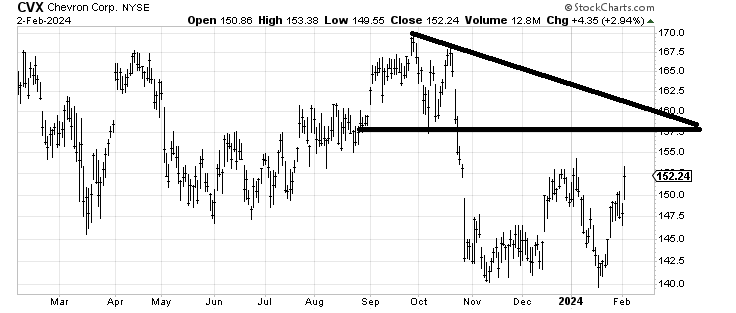
I would note, however, that Chevron CVX -- a big-cap Dow stock, so once again we see the difference -- had a good day on Friday, but will run into some resistance in the $155-157 area.