All This Optimism Makes Me Wary
The sentiment indicators turn bearish while overvaluation poses persistent problem.
You've reached your free article limit
You've read 0 of 1 free Pro articles.
Excessive optimism combined with high prices doesn't portend safe times. In fact, the current market has me quite cautious.
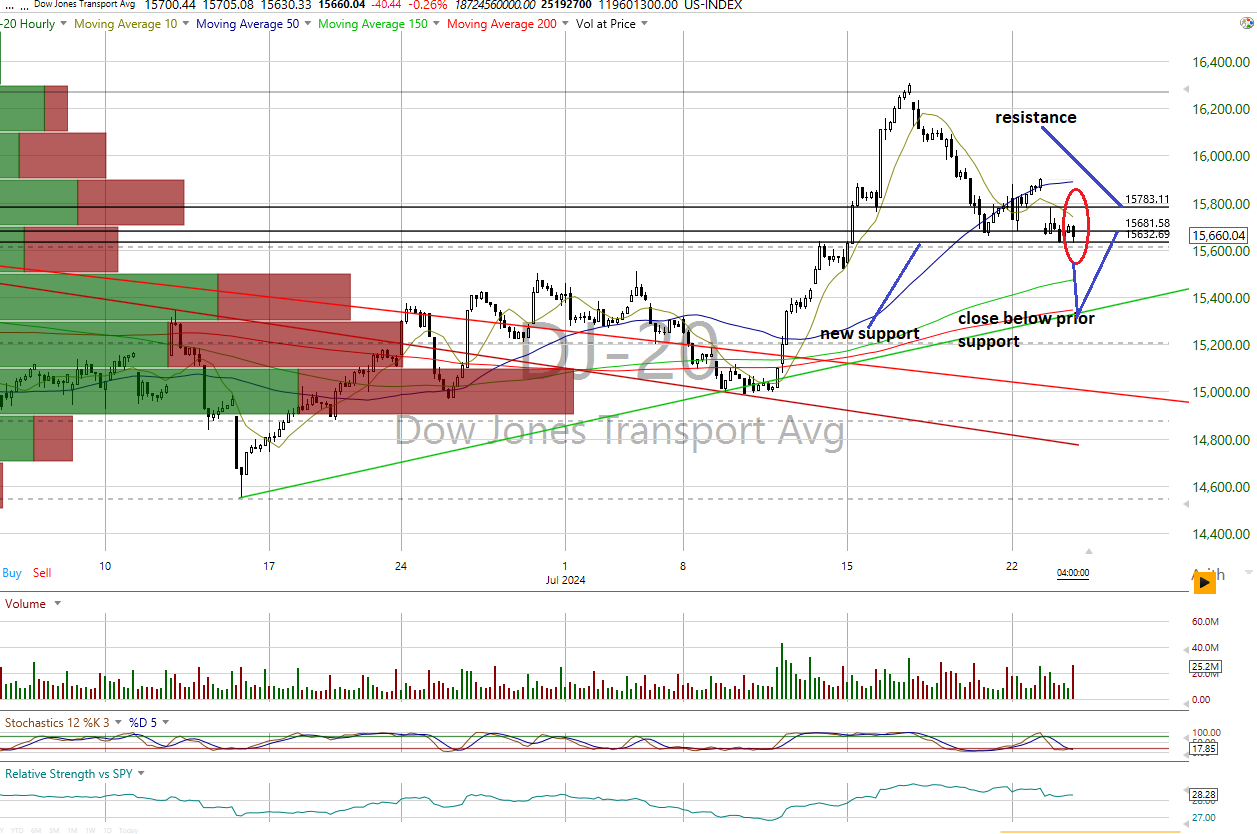
Let's review the stats: The major equity indexes closed mostly lower Tuesday with mixed internals on the New York Stock Exchange and Nasdaq. Both saw positive breadth but negative up/down volume with most closing near their session lows. What's notable technically was the Dow Jones Transports closed below support, leaving all but two of the indexes in near-term uptrends.
Cumulative market breadth remains neutral across the board.
High Price of the S&P
We're still wary of S&P 500's overvaluation, based on Bloomberg’s forward 12-month earnings estimates. The sentiment readings (contrarian indicators) are also flashing red lights, as the crowd is almost entirely on the bullish side of the boat.
And you never want to be on a lopsided boat....
Indeed, the 12-month consensus earnings estimate for the S&P from Bloomberg rose to $252.59 but leaves its forward price-to-earnings of 22.0 well above the “rule of 20” ballpark fair value at 15.8. Its 600-basis point premium remains significant.
The earnings yield, however, slipped 4.54%.
The 10-year Treasury yield, meanwhile, dipped to 4.24. Support is 4.17% and resistance at 4.27%. Its near-term trend is bearish.
The U.S. Dollar, via the Invesco BD U.S. Dollar Index Bullish Fund UUP, closed higher at $28.85. Its trend is neutral with support at $28.70 and resistance at $28.87.
Chart Check
On the charts, the major equity indexes closed mostly lower Tuesday with only the mid-cap 400 index and Russell 2000 posting gains.
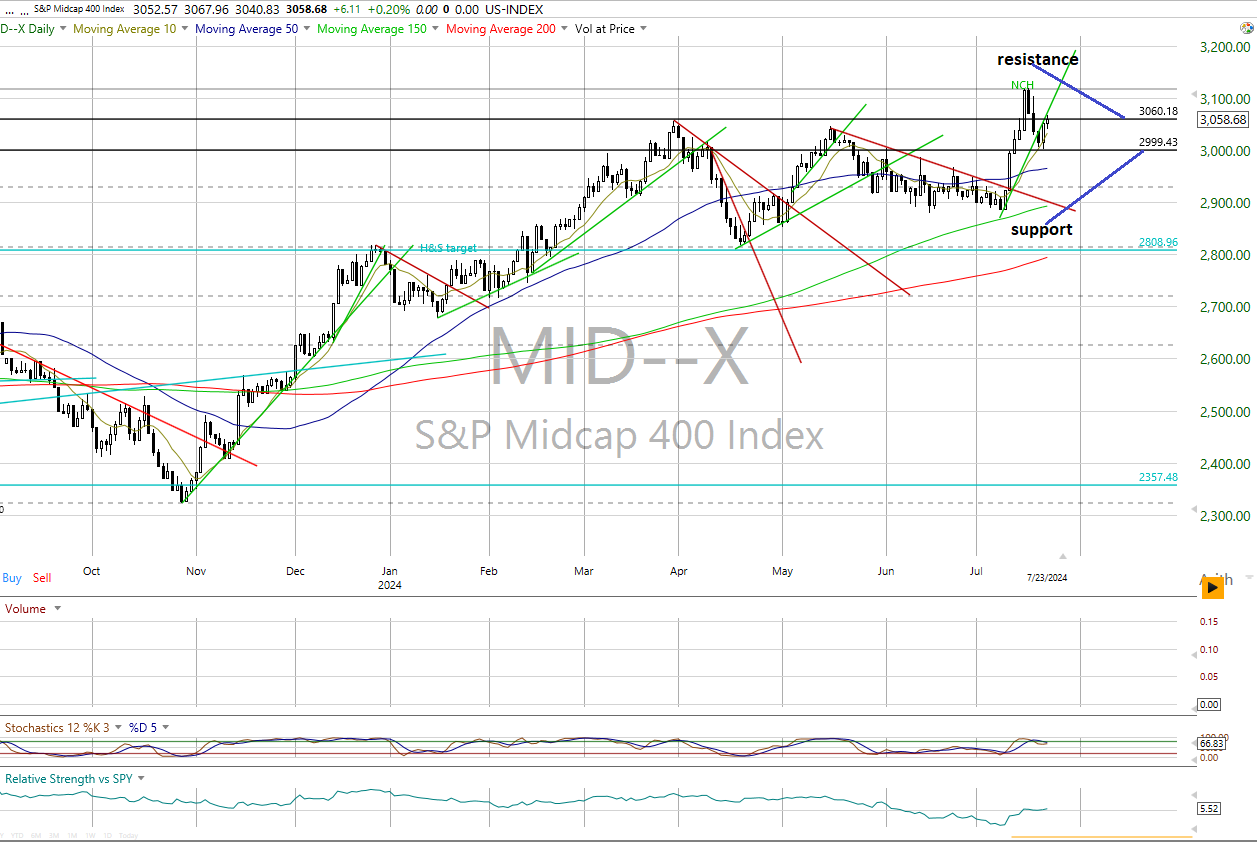
While market breadth was positive, up/down volume levels were negative.
Again, note the Dow Jones Transports closed below support that left the mid-cap index and Russell 2000 in near-term neutral trends with the rest still bullish.
There was no change in cumulative market breadth that stayed neutral on the All Exchange, NYSE and Nasdaq.
We didn't see any striking stochastic technical signals.
But the data, in our opinion, is still sending some bright warning signals.
Sentiment, Oscillator Ups and Downs
The one-day McClellan overbought/oversold oscillators are still neutral (All Exchange: 35.77; NYSE: 31.04; Nasdaq: 40.41).
The percent of S&P issues trading above their 50-moving averages, a contrarian indicator, sped to 67% and is also neutral.
But the "de-trended" Rydex Ratio (a contrarian indicator) remains bearish at 1.16 as the typically wrong-leveraged exchange-traded fund traders remain overexposed leveraged long. We still need to see some fear on their part.
That leaves all three of the sentiment indicators bearish as the “herd” is all on the band wagon. This week’s AAII Bear/Bull Ratio, a contrarian indicator, turned bearish at 0.50 as the Investors Intelligence Bear/Bull Ratio (contrary indicator page 8) stayed bearish at 16.7/63.6 as bulls continued to outweigh bears by a wide margin. There is no “wall of worry” to climb.
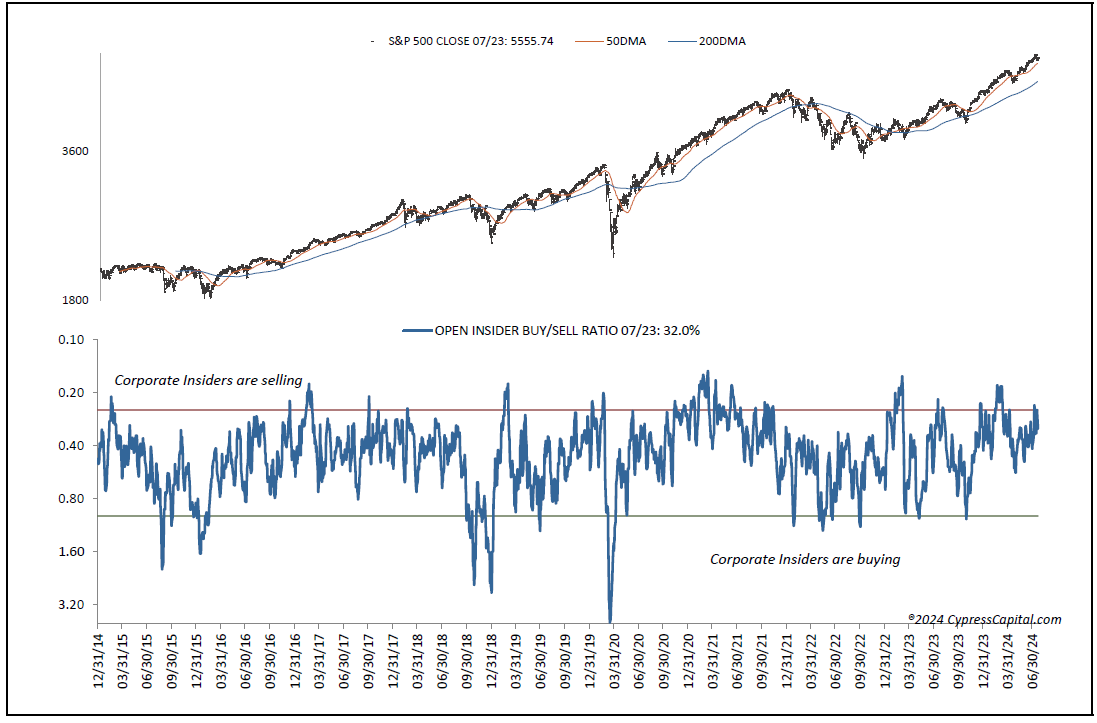
The Open Insider Buy/Sell Ratio is neutral at 32.08 as insiders decreased their selling activity.
At the same time, leveraged ETF sentiment is 6.8 and neutral.
Bottom Line
Market valuation with excessive optimism suggests risk is currently high for equities. We're honoring the sell signals on individual names while being extremely selective on the buy side. We're focused on preserving capital.