A Market Going in Circles
Look what the S&P 500 did yesterday as the 'overboughtness' is at work and volatility looms.
You've reached your free article limit
You've read 0 of 1 free Pro articles.
The S&P 500 opened at 5702 and closed the day at 5713, which means there are going to be lots of folks frustrated with the trading day. We went up and then down, but in the end, we sort of gapped up ... and then sat.
Breadth was good, although it was better on Sept. 13, a day the S&P was up a mere 30 points on the day (instead of 95 as it was on Thursday). Thursday saw 73% of the volume on the upside, whereas a week ago, it was 84%.
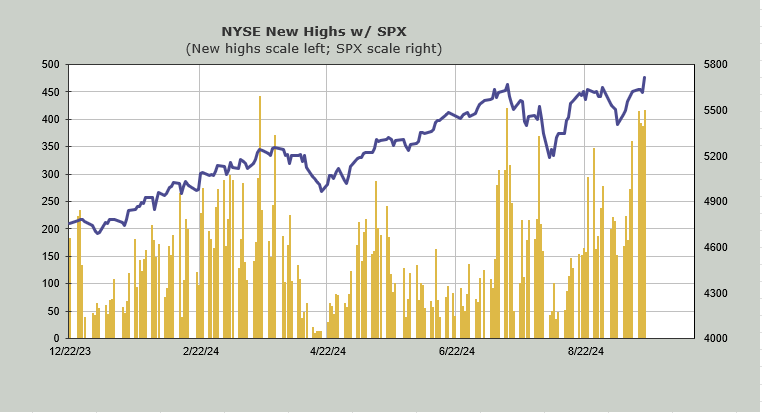
The number of stocks making new highs improved a smidgen from the prior day, but we’re still sitting at the same level we were at on Monday on the New York Stock Exchange: 415. This is the overboughtness at work.
Then there is sentiment, which is all over the map. The American Association of Individual Investors bulls are now back to just over 50%, having fallen from that level a few weeks ago. In the last few years, each jump up over 50% has led to a pullback in the market.
But then I noticed something else: The bulls had jumped 11 points week over week. They haven’t done that all year.
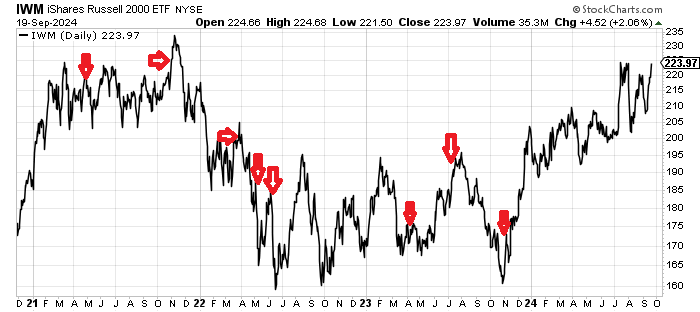
But then I noticed something else: The bulls had jumped 11 points week over week. They haven’t done that all year. But they have done that eight times since 2021. I was a bit surprised to see that within a week or two, each time we saw the Russell correct a few percentage points. In 2023, the spring reading gave us a quick 5% pullback, but that was a bottom. In November 2023, the pullback was very fast, but was about 4%, also in bottoming action. The others were not bottoming action.
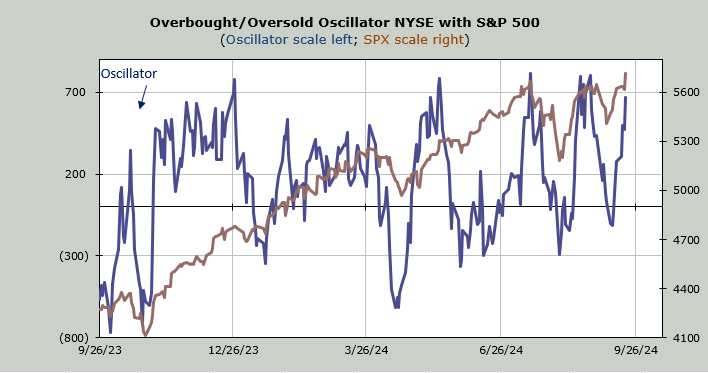
As you know by now, my work shows that the market will be maximum overbought by the end of the day tomorrow. It is one reason I am looking for a pick up in volatility next week.
Another reason is that the Volatility Index did not make a lower-low with that new high in the S&P 500. And then there is the Daily Sentiment Index (DSI), which chimed in at 16 for the VIX on Thursday. My rule of thumb is I am on the alert when the reading is a teenager. When it is under 15 (do I call that a tween?) it’s a yellow flag and at single digits, it’s a red flag and very actionable.
I do not have a strong view on what the market will do on Friday; it is triple-witching after all. But I do know that when the market is overbought and the DSI on the VIX is low as it is now, I should look for volatility to pick up next week.
I want to end by revisiting the chart of KraneShares CSI China Internet exchange-traded fund KWEB. We looked at it with a positive eye on Monday, because it felt as if the interest in it had dried up (and the selling, too).
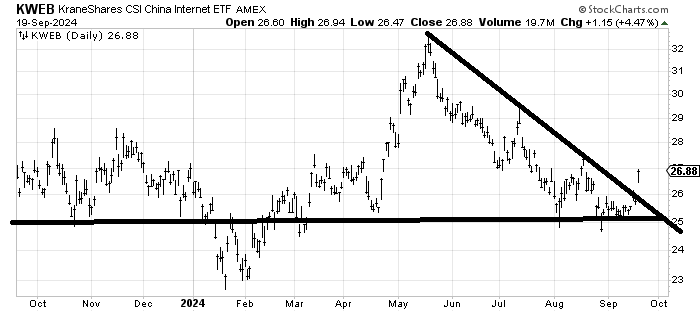
It has since crossed the downtrend line I drew in and, while there is resistance here at 27, (and quite frankly all the way up) I am encouraged at the bottoming I see on the chart.
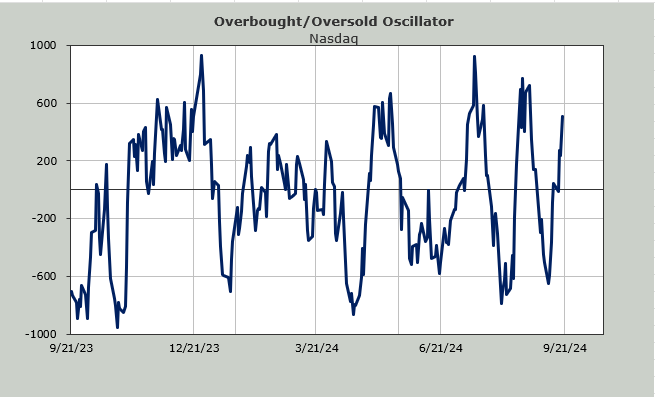
The Oscillators