As Intel Plans a $25B Chip Plant in Israel, What Does That Mean for Traders?
Let's review the charts and indicators.
You've reached your free article limit
You've read 0 of 1 free Pro articles.
Intel INTC is planning a $25 billion chip plant in Israel following a $3.2 billion grant from the Israeli government. Let's check out the charts and indicators of INTC.
In this daily bar chart of INTC, below, I can see that prices have climbed higher the past twelve months. INTC trades above the rising 50-day moving average line and above the rising 200-day line.
The daily On-Balance-Volume (OBV) line has been rising the past year and confirms the price gains. The Moving Average Convergence Divergence (MACD) oscillator is in a bullish alignment above the zero line.
In this weekly Japanese candlestick chart of INTC, below, I see a positive setup. Prices are in an uptrend and trade above the rising 40-week moving average line. The weekly OBV line has saw-toothed higher this year to help to confirm the price gains. The MACD oscillator is in an upward path above the zero line.
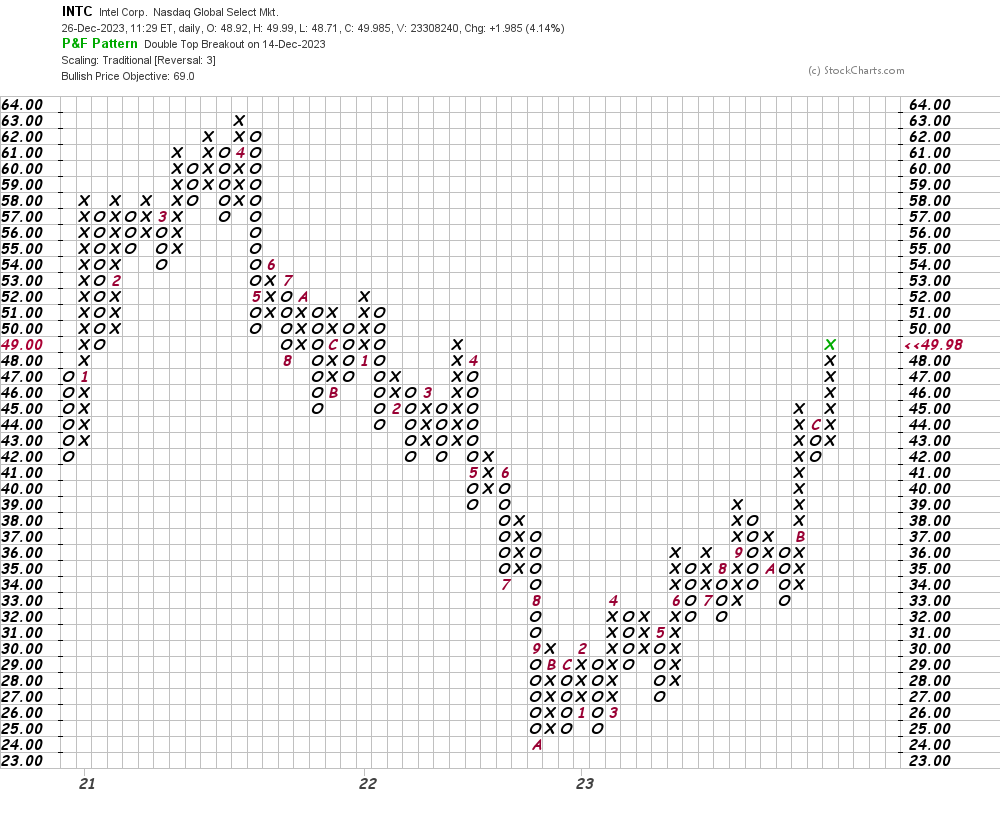
In this daily Point and Figure chart of INTC, below, the software is projecting an upside price target in the $69 area.
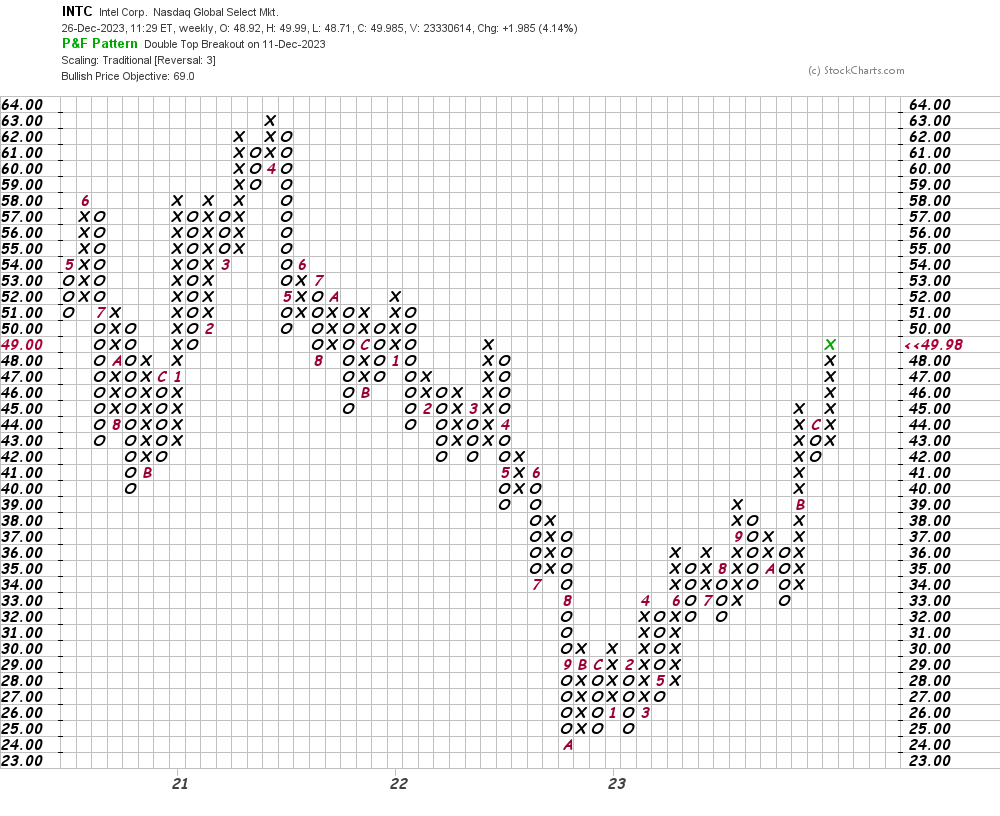
In this weekly Point and Figure chart of INTC, below, I can see the same $69 price target as the daily chart above.
Bottom line strategy: INTC seems to be attracted to dry climates - Arizona and Israel to name two, and traders seem to be attracted to the stock. Traders who went long after November 16 should raise stops to $43 from $37.
Employees of TheStreet are prohibited from trading individual securities.