3M's Charts Need Lots of Work
It's likely that 3M continues to trade sideways to build a base pattern.
You've reached your free article limit
You've read 0 of 1 free Pro articles.
Shares of 3M Co MMM were trading higher Tuesday after the company named former L3Harris Technologies LHX chief William M. Brown as the new CEO starting May 1, succeeding Michael F. Roman, who will become the executive chairman.
Let's check out the charts of MMM.
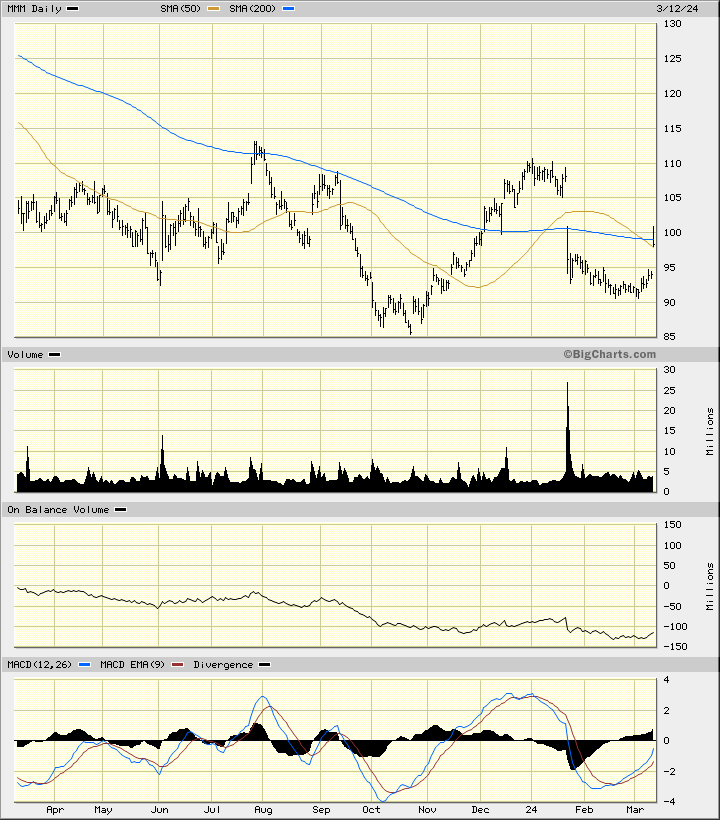
In this daily bar chart of MMM, below, I can see that prices gapped higher on the opening Tuesday but prices have pulled back after an hour of trading. MMM is trading around the 50-day moving average line and the 200-day moving average line. The slopes of both of these averages are negative.
The daily On-Balance-Volume (OBV) line shows weakness the past twelve months. The trend-following Moving Average Convergence Divergence (MACD) oscillator shows us a cover shorts buy signal in February but remains below the zero line for now.
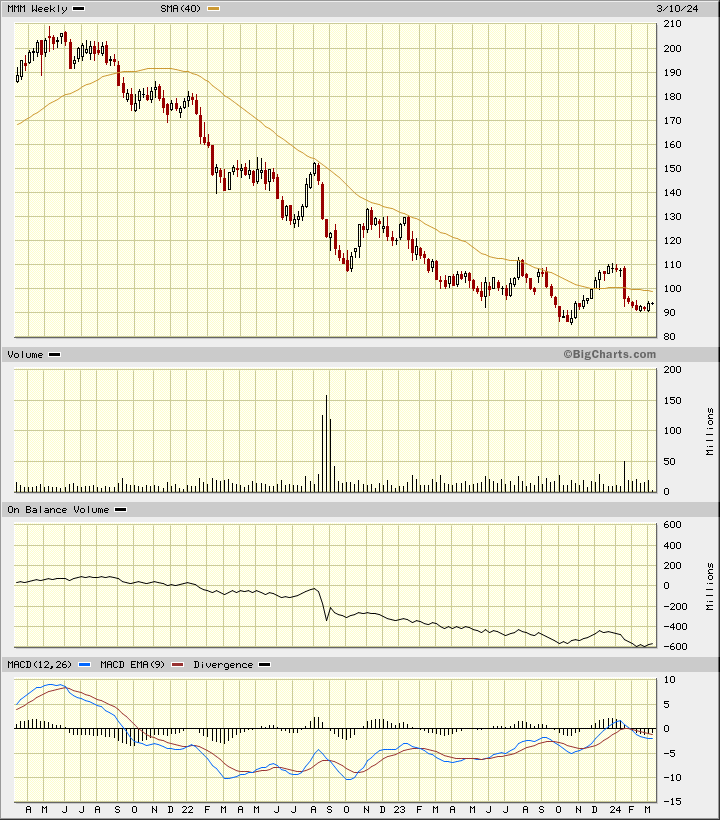
In this weekly Japanese candlestick chart of MMM, below, I can see that shares of MMM are in a longer-term downtrend. Prices made a higher low in February versus October but the slope of the 40-week moving average line is still negative.
Trading volume has not expanded at the recent lows to suggest a change of ownership from weak hands to strong hands. The weekly OBV line remains bearish. The MACD oscillator is below the zero line.
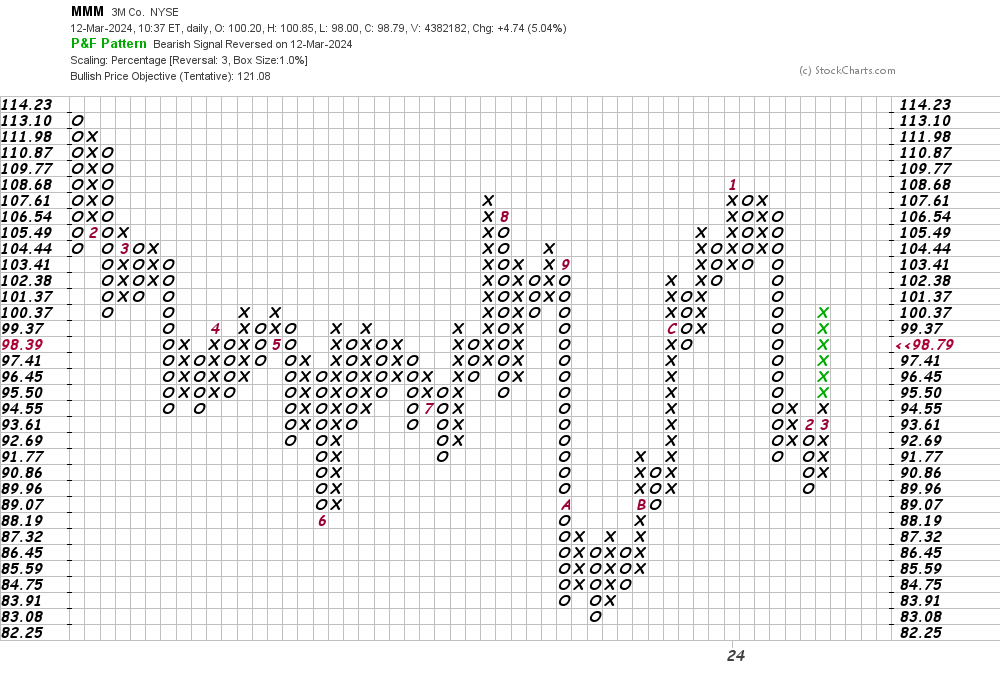
In this daily Point and Figure chart of MMM, below, the latest price action is shown with no gap. An upside price target in the $121 area is shown.
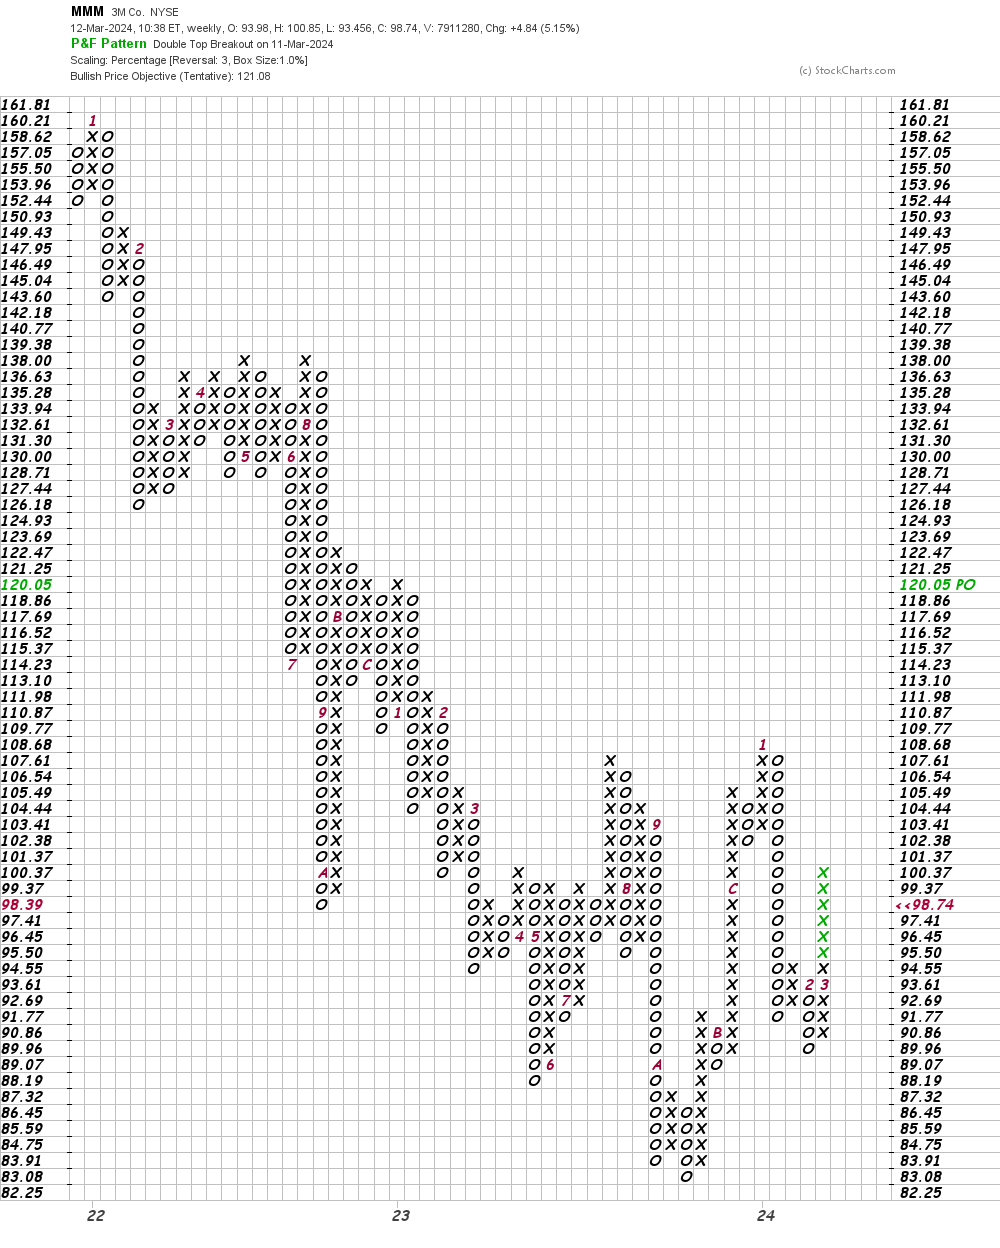
In this second Point and Figure chart of MMM, below, I used weekly price data. Here the software reveals the same price target of $121.
Bottom line strategy: MMM is likely to fill today's price gap. It is also likely that MMM continues to trade sideways to build a base pattern. Potential buyers of MMM should keep their powder dry.
Employees of TheStreet are prohibited from trading individual securities.