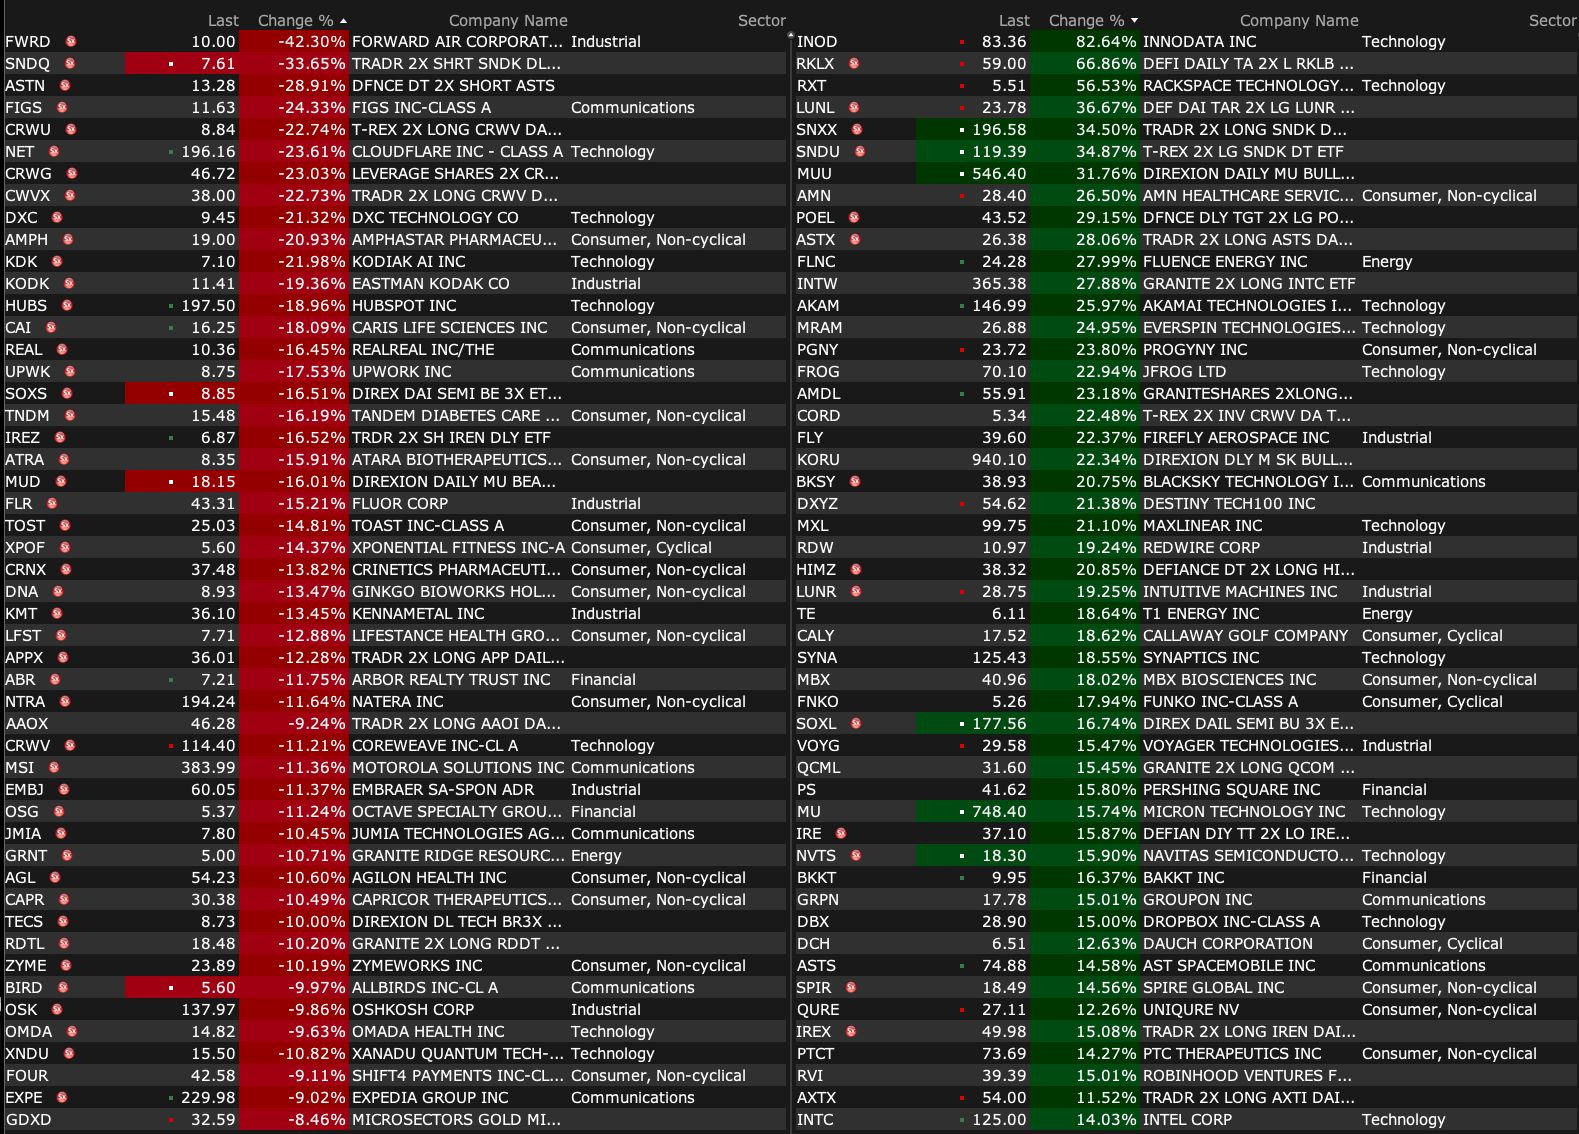
Friday's After-Hours Advancers and Decliners
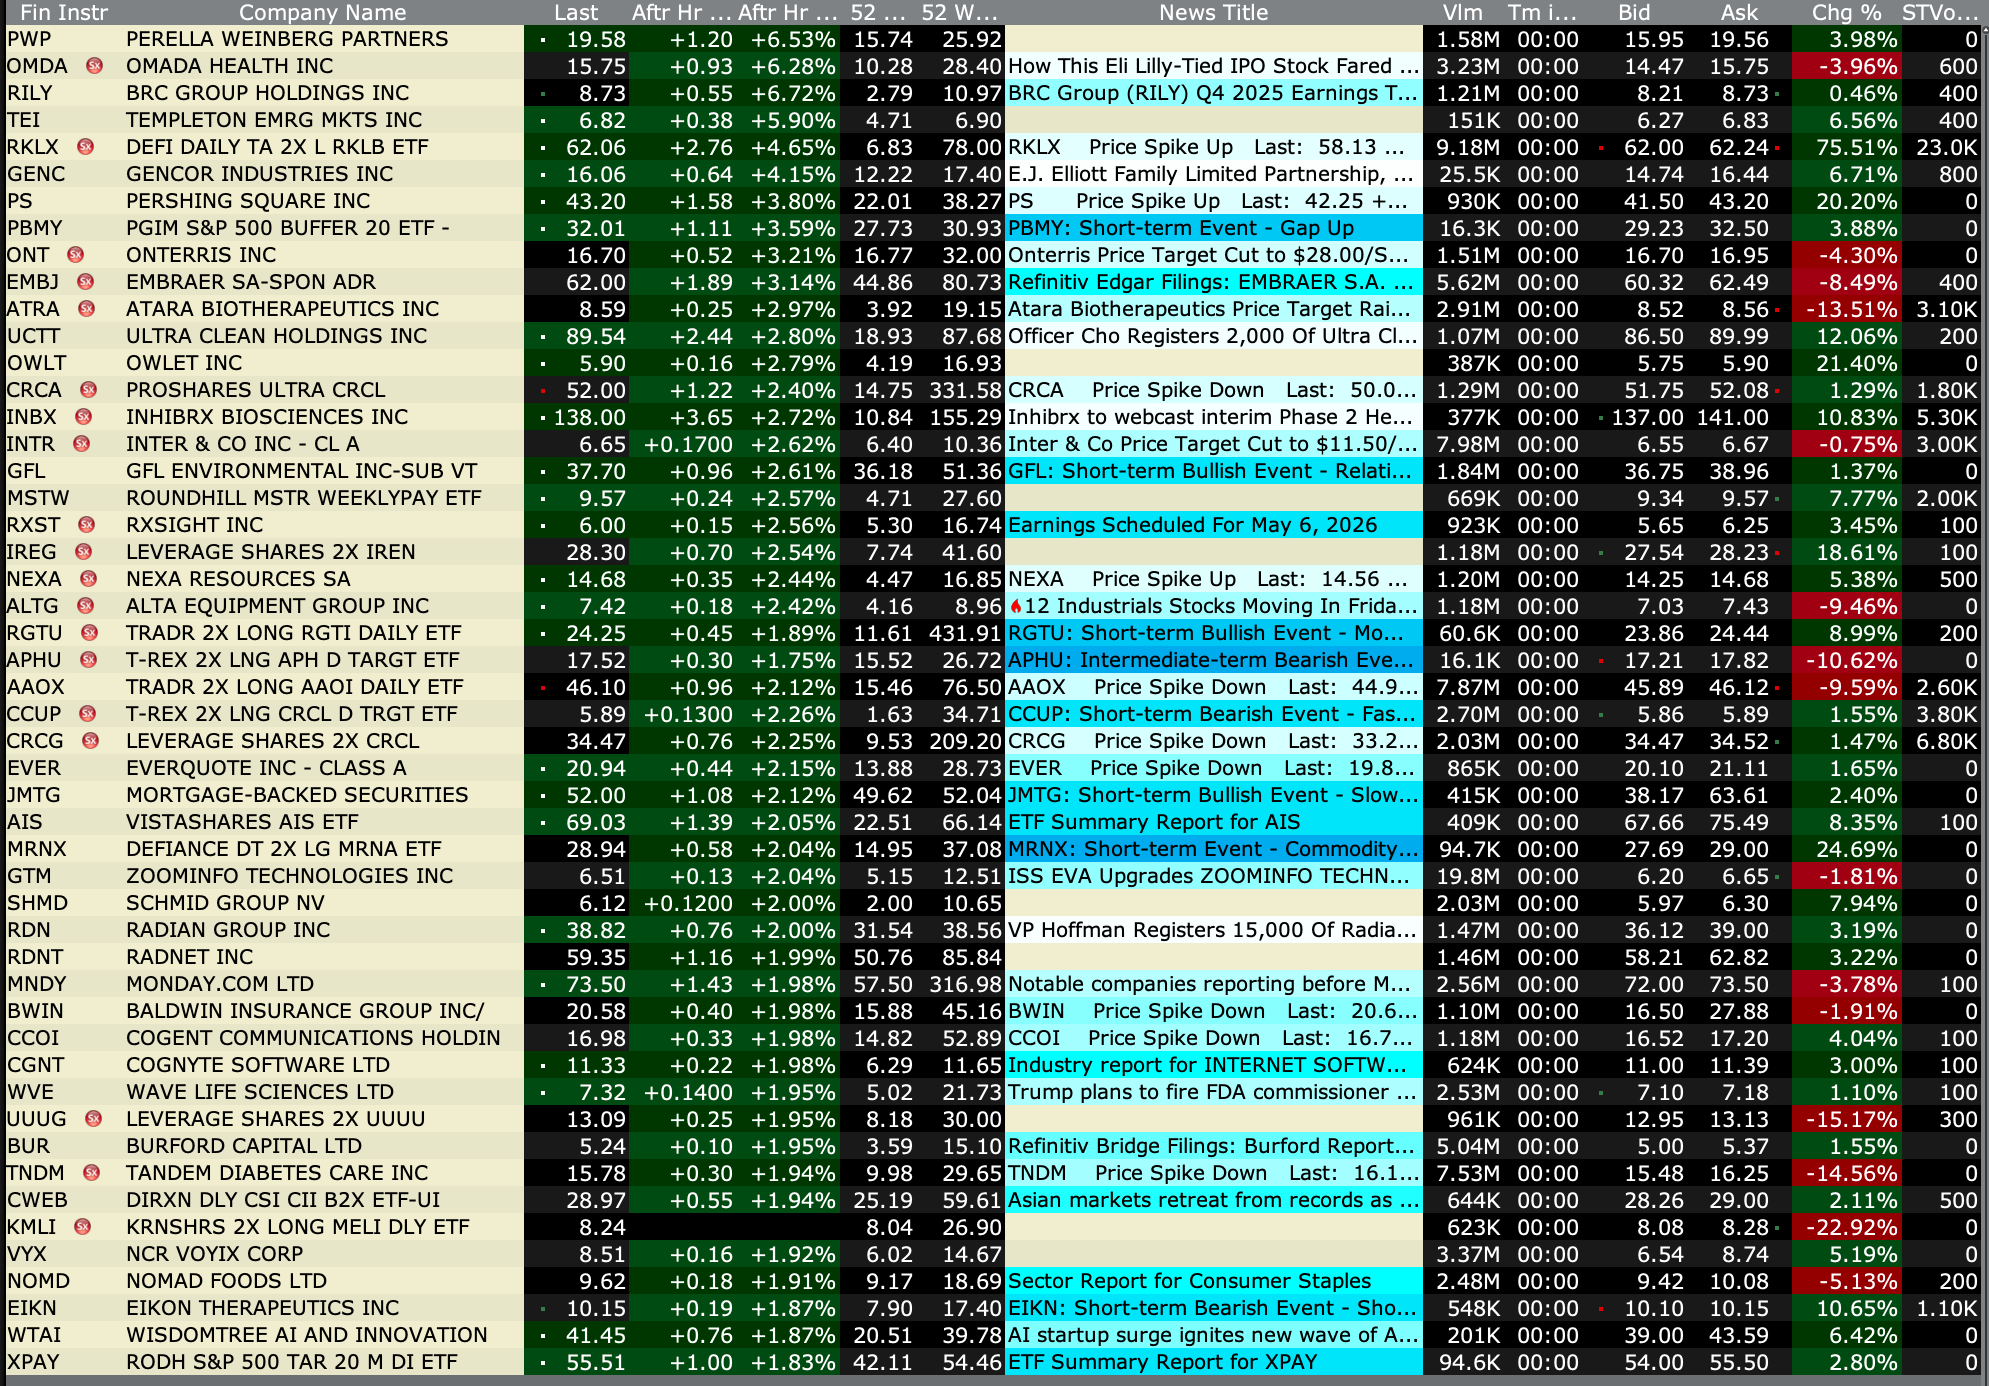
After-Hours % Advancers
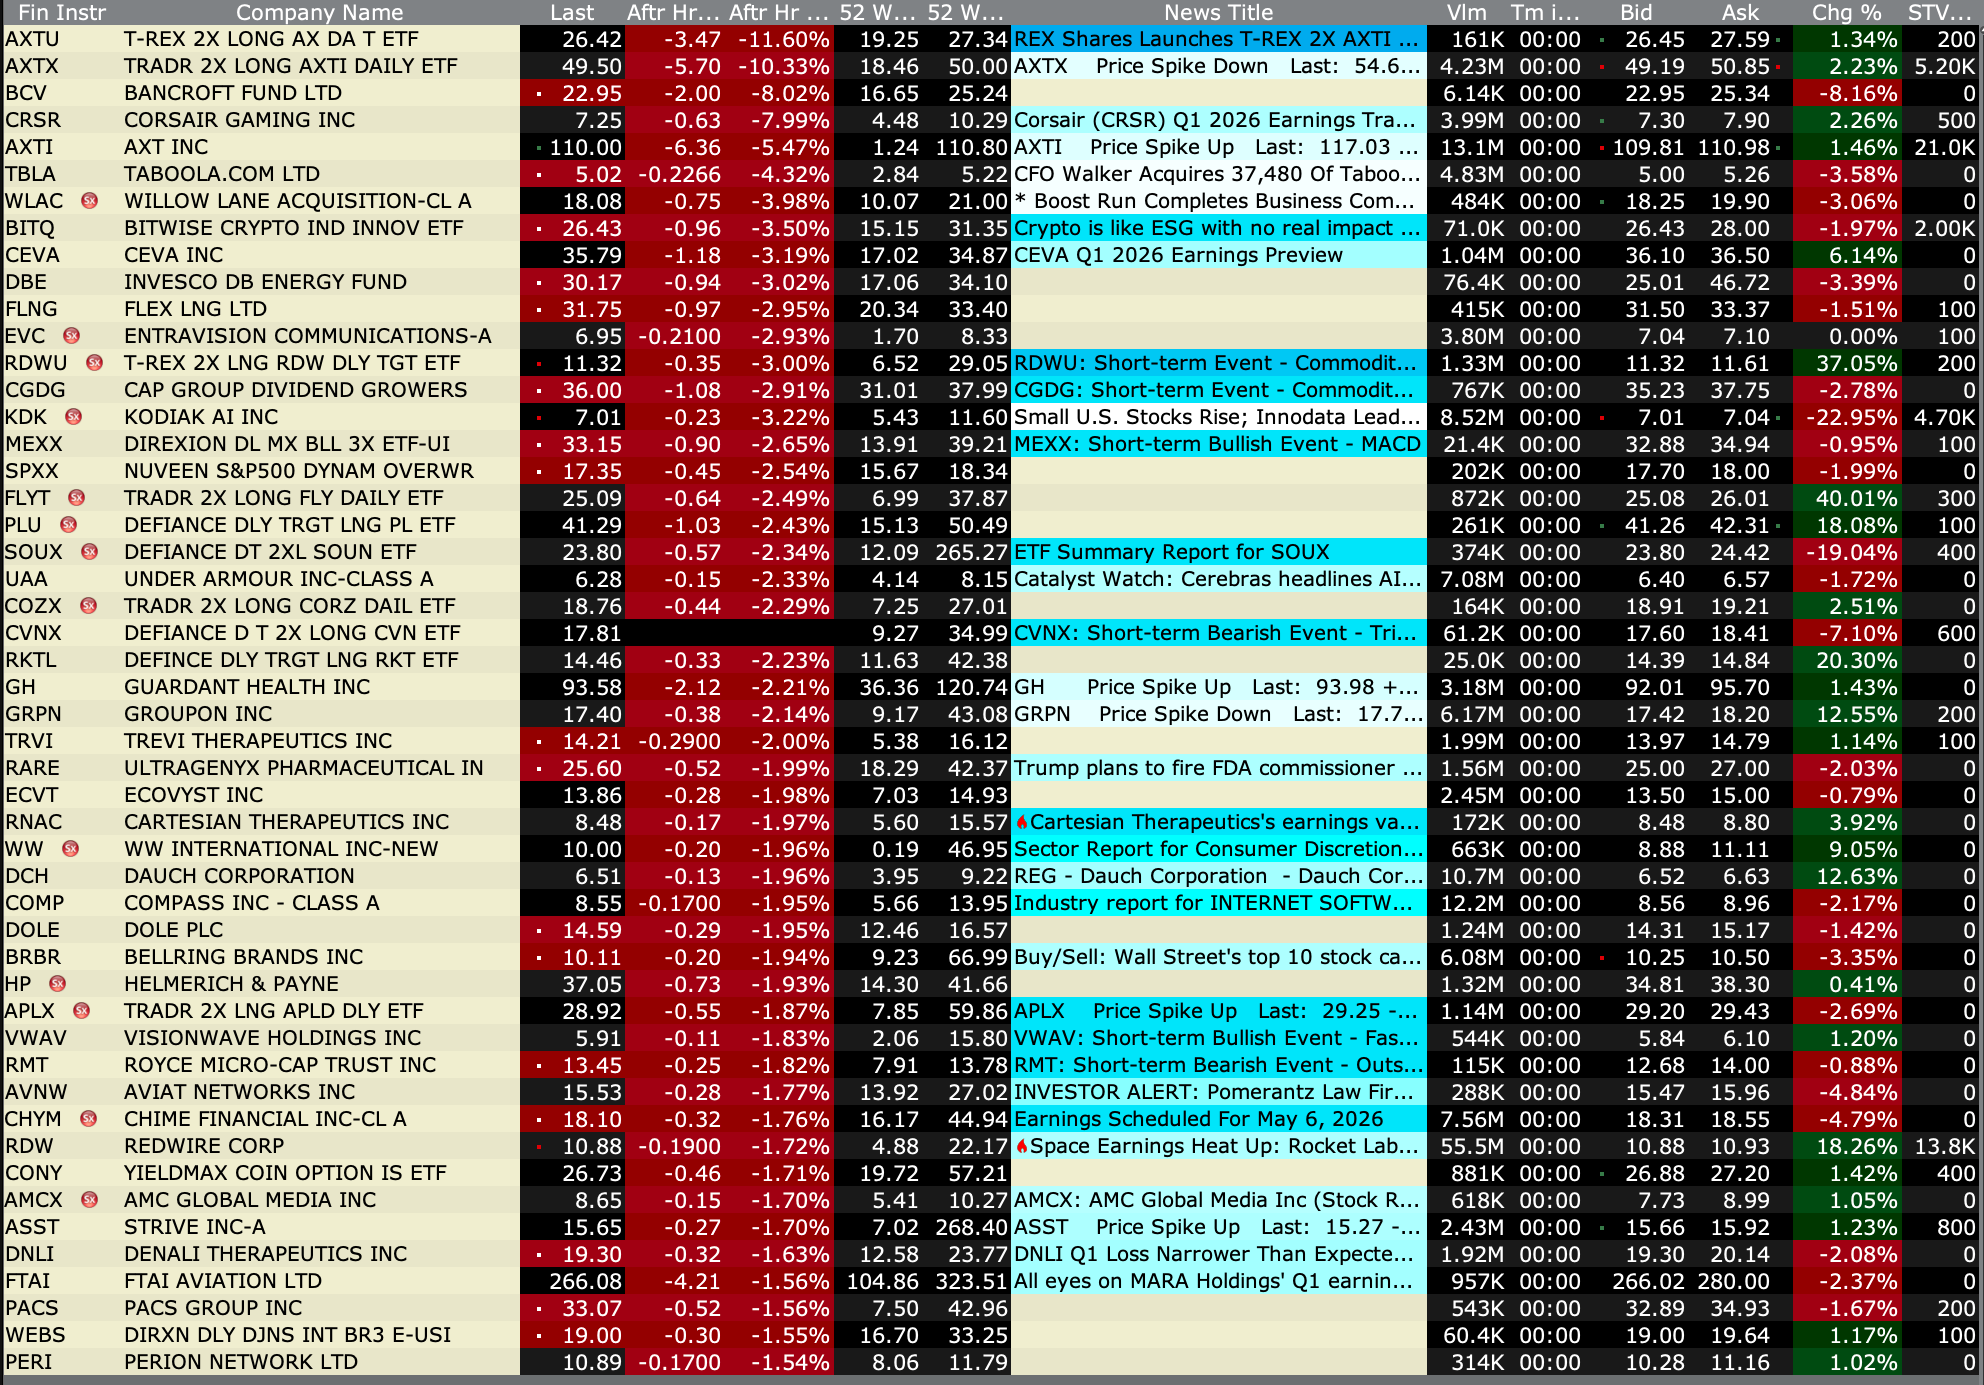
After-Hours % Decliners
BY Doug Kass · May 8, 2026, 4:45 PM EDT
After-Hours % Advancers
After-Hours % Decliners
BY Doug Kass · May 8, 2026, 4:45 PM EDT
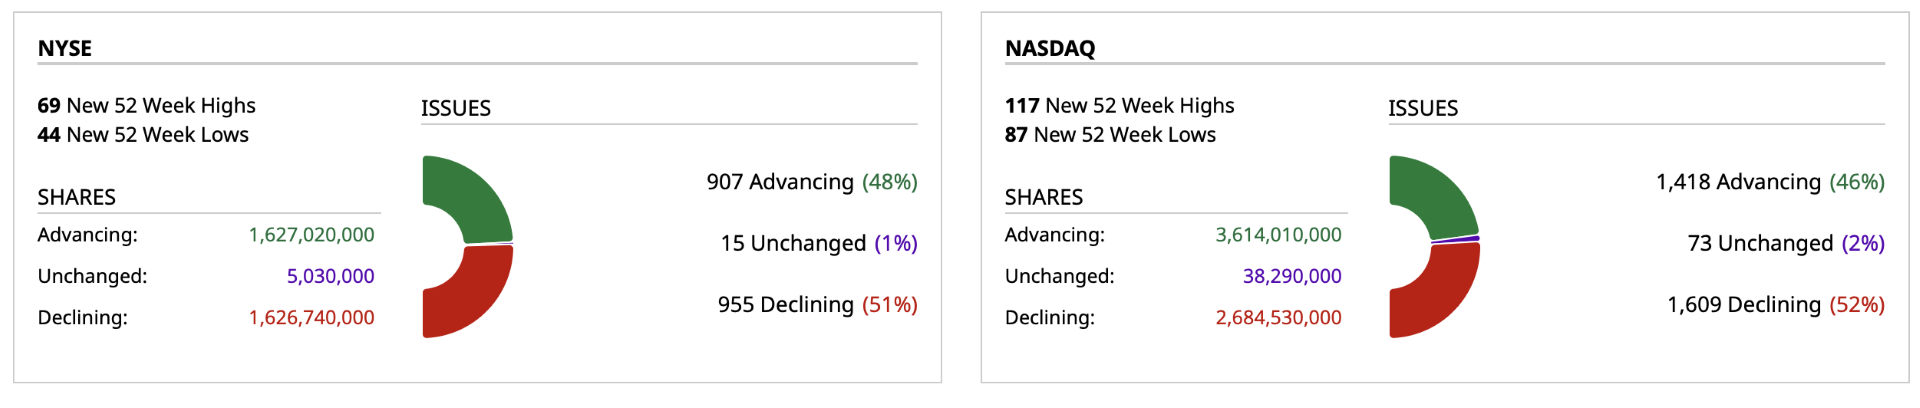
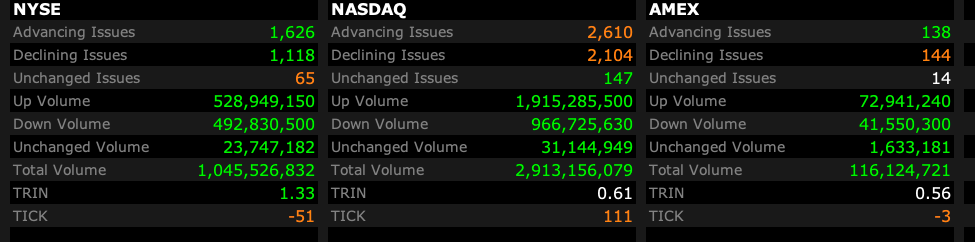
Closing Volume
- NYSE volume 8% above its one-month average
- NASDAQ volume 10% above its one-month average
- VIX index: up 0.23% to 17.12
Breadth
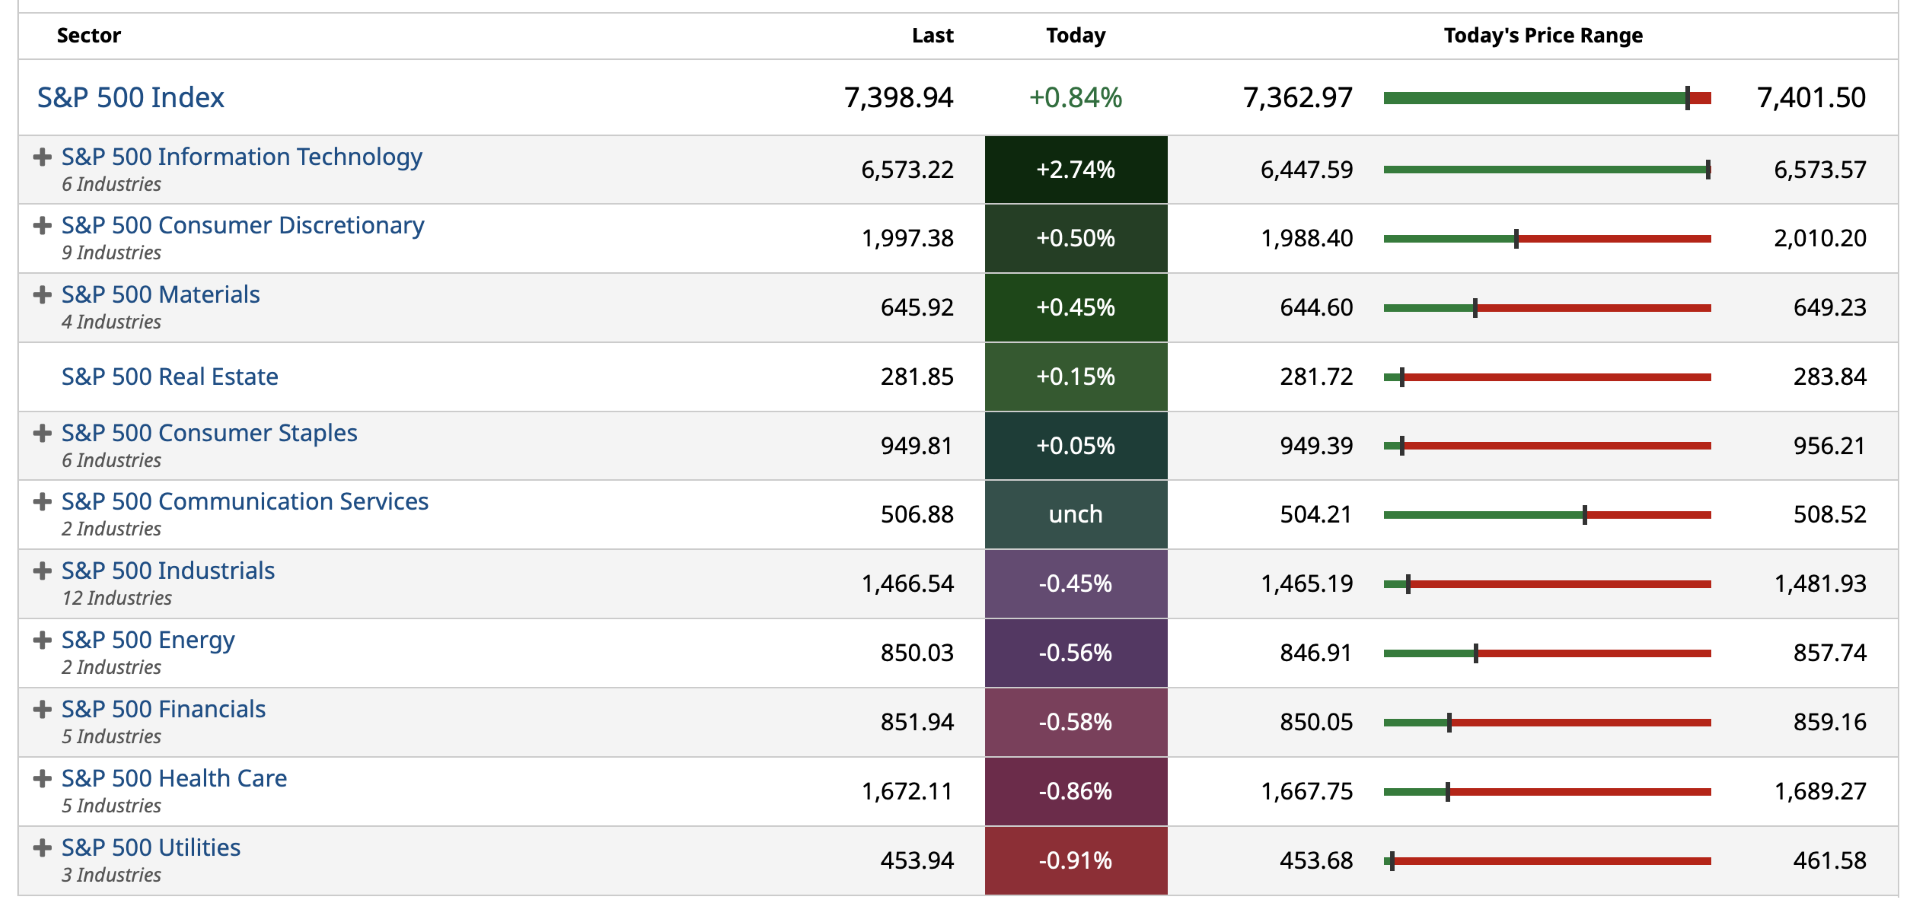
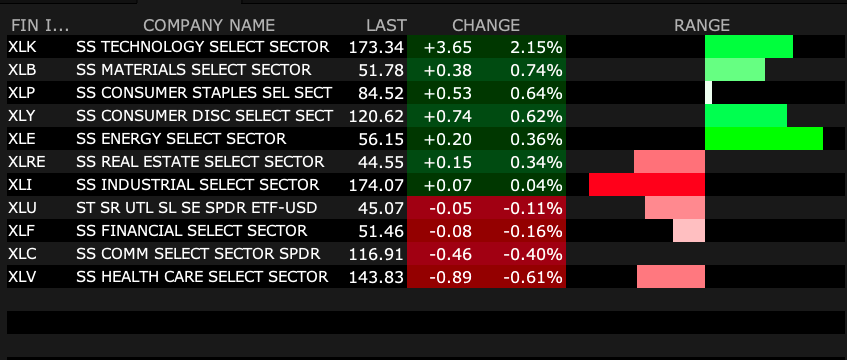
S&P 500 Sectors
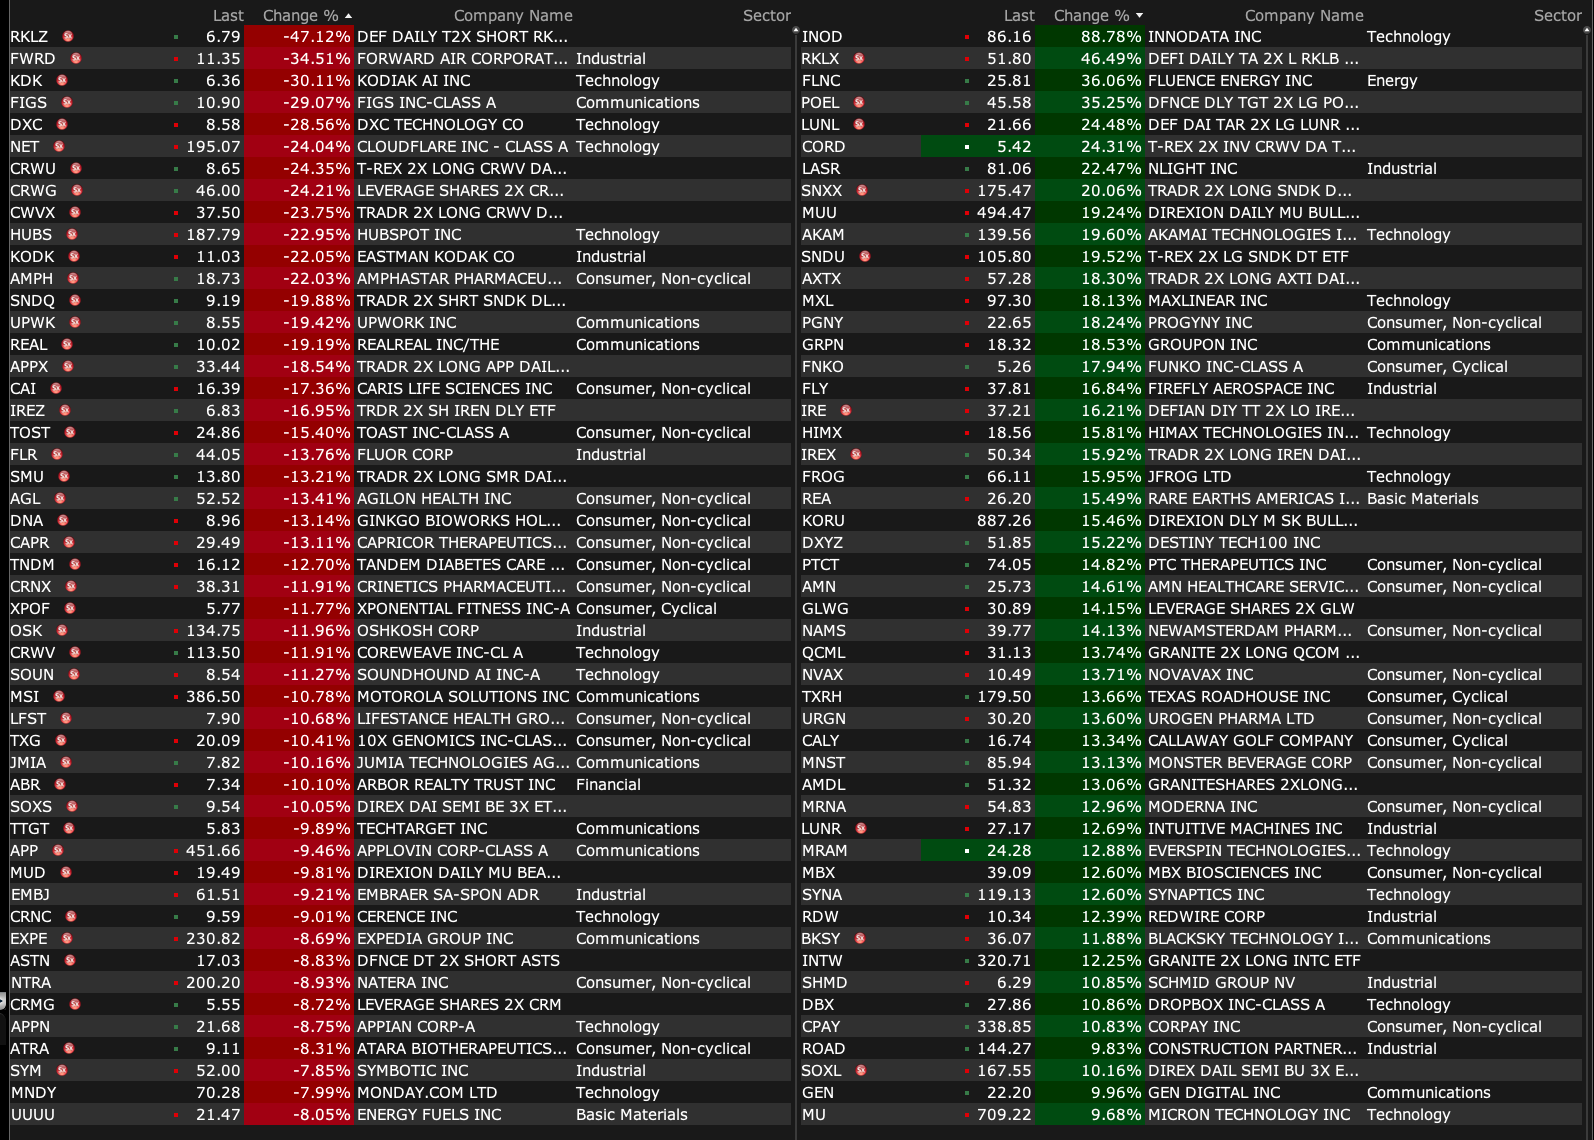
% Movers
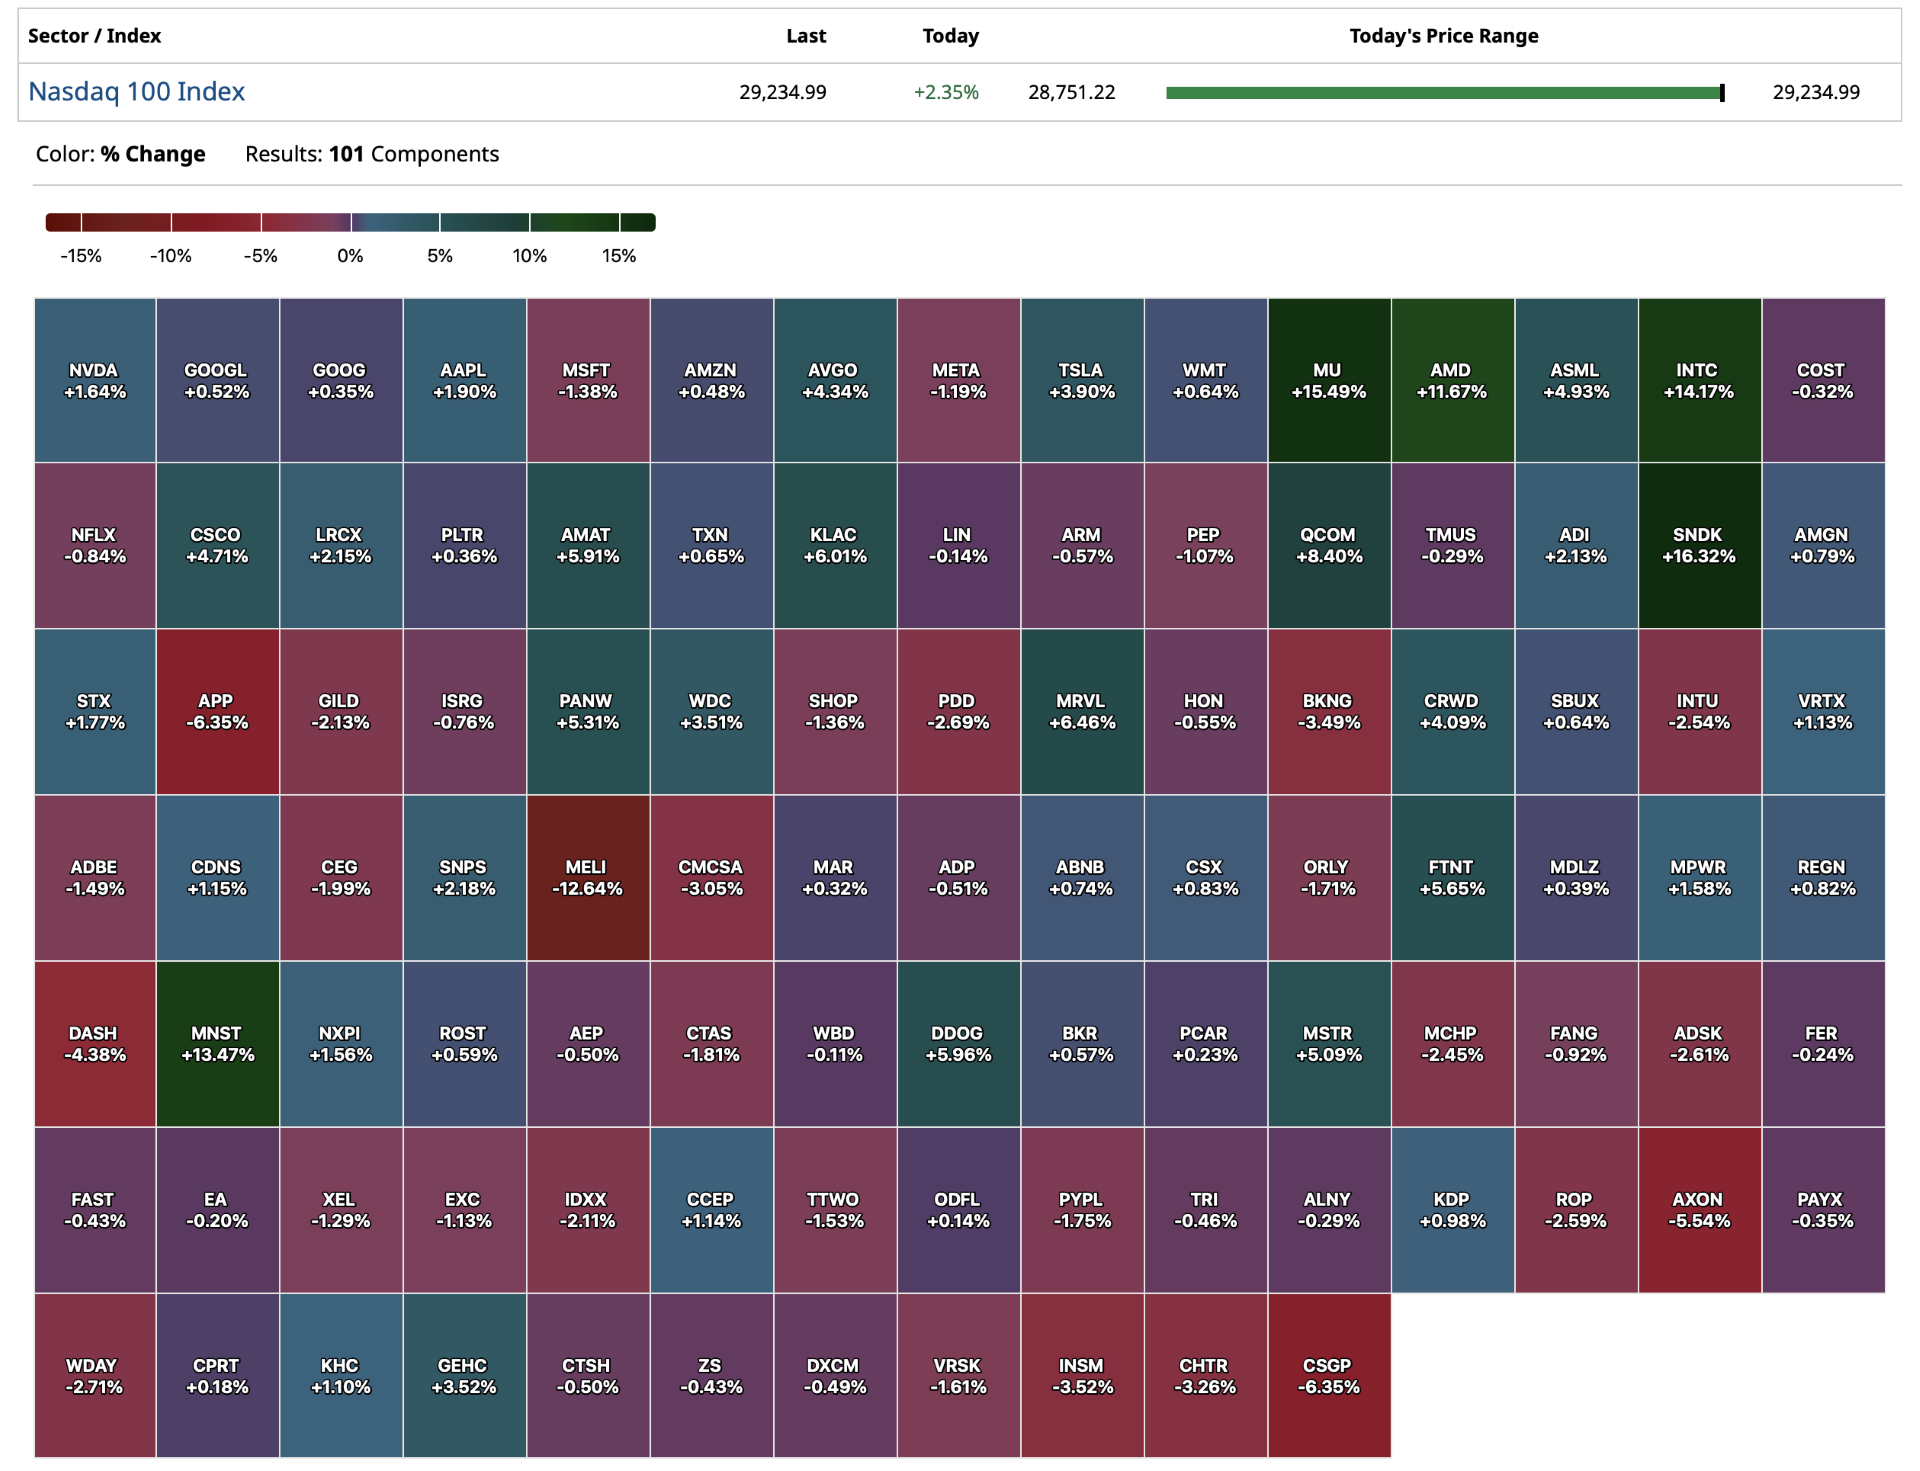
Nasdaq 100 Heat Map
Closing S&P 500 Heat Map
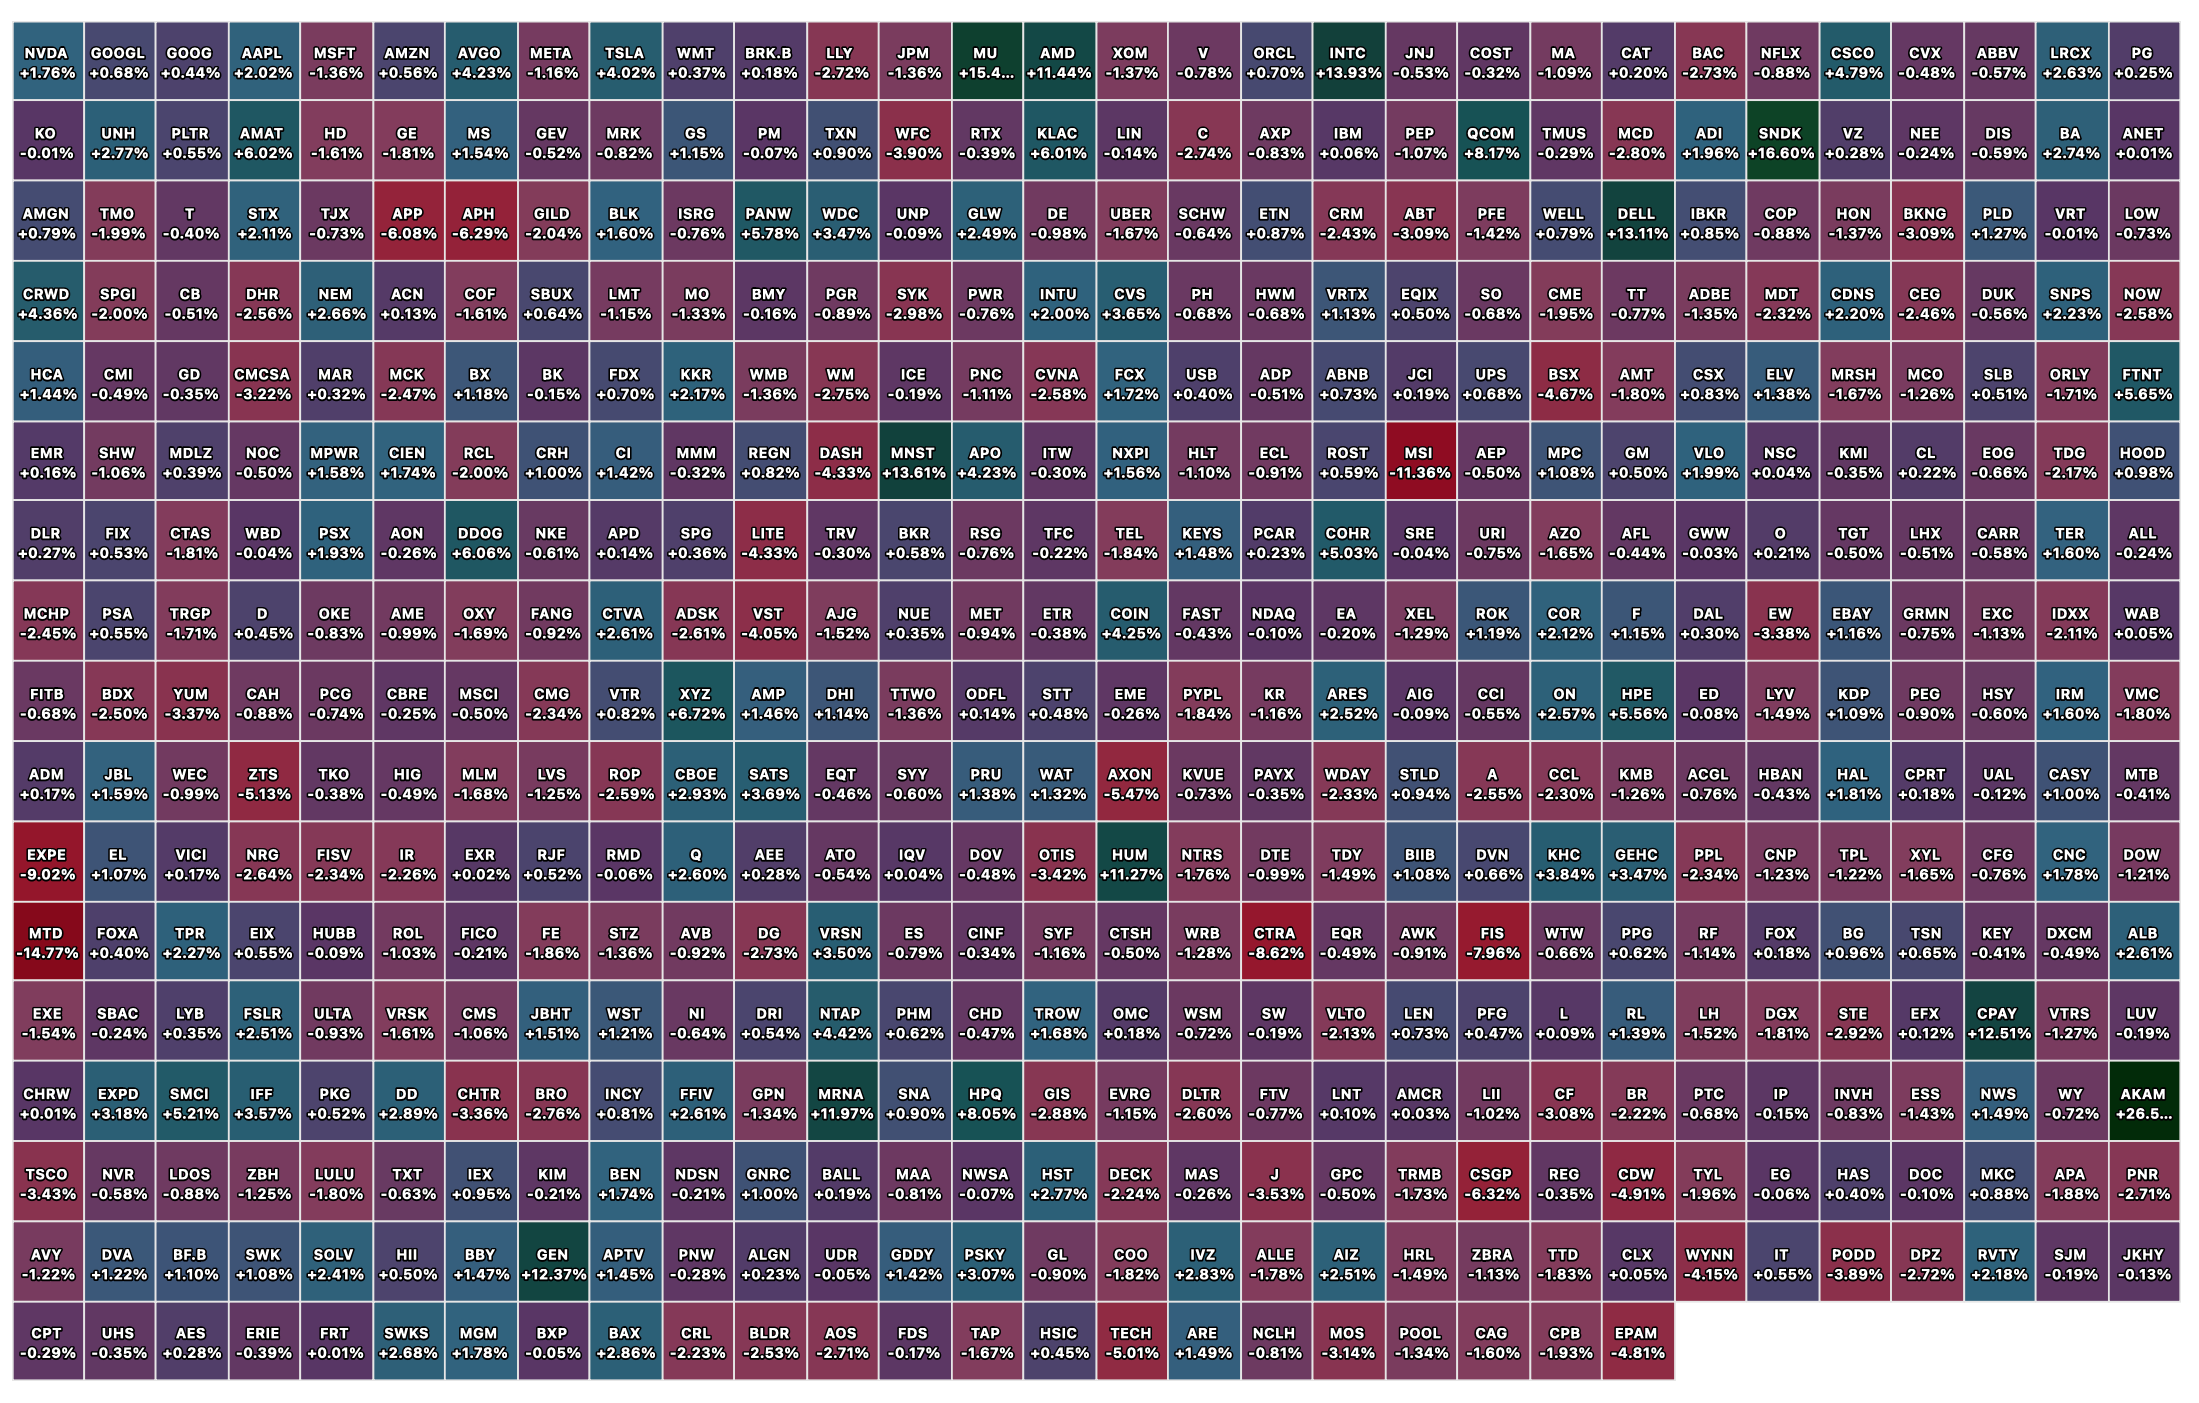
BY Doug Kass · May 8, 2026, 4:26 PM EDT
Thanks for reading my Diary this week.
I haven't done a good job in contributing to the generation of long ideas, but tomorrow is another day and next week is another week and so on and so forth.
Enjoy the weekend.
Be safe.
BY Doug Kass · May 8, 2026, 3:45 PM EDT
Two weeks ago, Paul Tudor Jones was sounding the alarm.
— Milk Road AI (@MilkRoadAI)
He went on record saying the U.S. stock market is at 252% of GDP, a level that makes 1929's peak of 65% and the dot com era's 170% look mild by comparison.
His message was if we mean revert to historical P/E multiples,… https://t.co/5SsZTNsIUb pic.twitter.com/aSowmLbeEp
Position: None
BY Doug Kass · May 8, 2026, 3:04 PM EDT
From Peter Boockvar:
Positives,
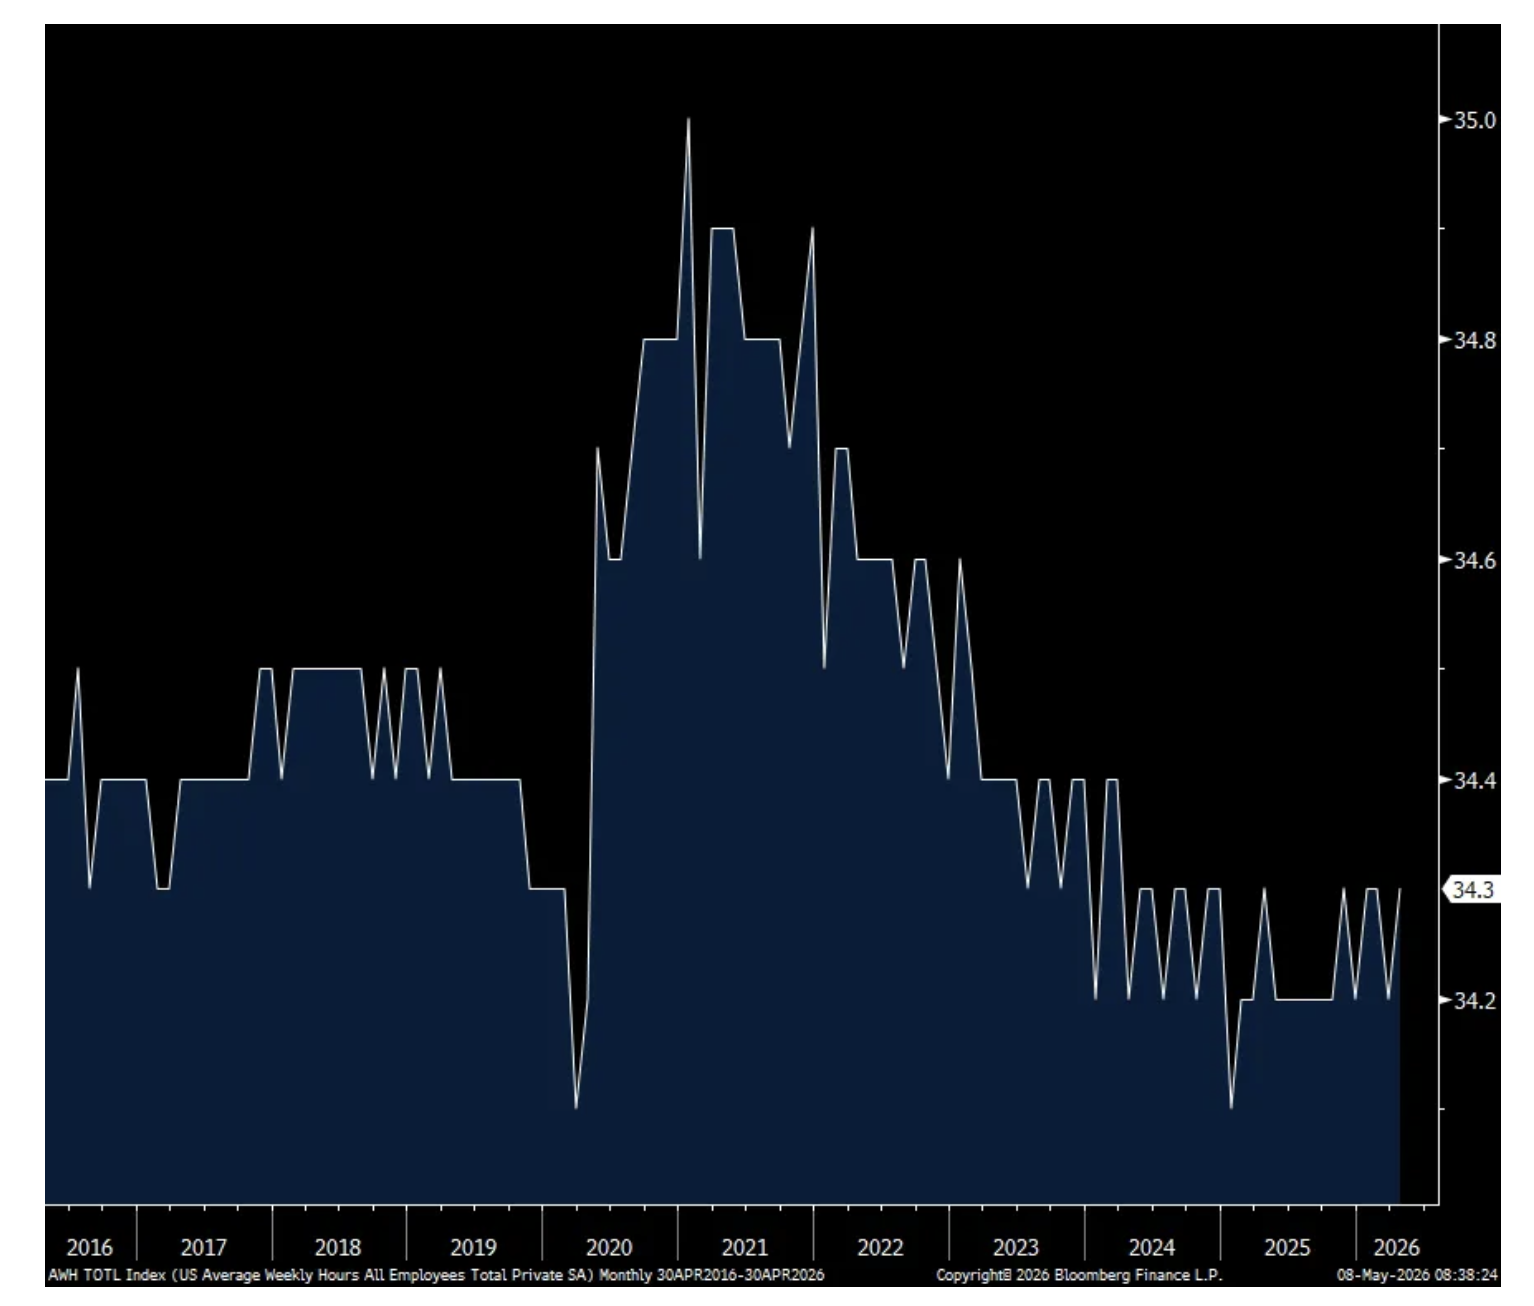
1) April payrolls grew by 115k, almost double the estimate of 65k and only partially offset by a combined downward revision to the two prior months of 16k. Hours worked ticked up to 34.3 from 34.2 and has been vacillating between the two for the past 15 months. Smoothing out the monthly gyrations, the 3 month pace of hiring is now 48k vs the 6 month average of 55k and the 12 month average of 21k.
2) ADP said private sector job growth in April was 109k, just below the estimate of 120k but up from 61k in March. The chief economist did say that part time worker hiring did lift overall small business hiring. Wage growth was still pretty good with ‘job stayers’ seeing pay up 4.4% y/o/y vs 4.5% in the month before. For ‘job changers’, wages grew by 6.6% y/o/y, the same pace seen in March.
3) Initial claims totaled 200k, 5k less than the estimate but up from the very low print of 190k seen last week. The 4 week average fell to 203k from 208k and reflects the current muted pace of firing’s as measured here. Continuing claims were little changed at 1.766mm, down 10k w/o/w.
4) From Live Nation: “We have already booked over 85% of our large venue shows for the year, with show counts up y/o/y across stadiums, arenas, and amphitheaters. Our momentum is clear: we have sold over 107 million tickets to date - an 11% increase - and Venue Nation is on track to grow fan attendance at our owned and operated venues by double digits.” As to the demand side, “we see no slowdown in any genre, no demographic. We see across the board, whether it’s a club show, whether it’s an amphitheater in Indianapolis or an expensive stadium show in New York, we’ve seen no demand pull back anywhere. Same thing in the rest of the world. Argentina to Milan to Singapore, don’t see any pullback. Consumers still consider that live show very, very important in their social calendar for the year. Whether they’re going to one, two, or three shows a year, it’s paramount that they get to that show. So we’ve seen no pullback. Broad, strong demand across the board on all genres, all theater sizes.”
5) From Madison Square Garden Entertainment: “I’m pleased to say that demand for our live entertainment offerings remain strong...Behind these results were a number of important drivers including continued momentum in our concert business at the Garden, growth in marketing, partnerships and suites, and the last shows of this past season’s record setting Christmas Spectacular run…From a demand standpoint, we continue to see the vast majority of concerts at our venues sell out. In addition, food and beverage per caps at concerts were up in the quarter while merchandise per caps were down, both of which we primarily attribute to the mix of events.”
6) From Sphere Entertainment: “Calendar 2026 marks our third full year of operation in the market with our business on track for substantial growth. This is led by The Wizard of Oz at Sphere, which continues to perform well…In addition to higher revenues from the Sphere Experience, we also saw revenue growth in brand events, concert residencies and sponsorship and suite license fees.”
7) From Disney: “No, we haven’t seen any change in consumer behavior from elevated gas prices thus far and aren’t currently seeing a material impact on the remainder of the fiscal year based on forward bookings. Disney World bookings are pacing up strongly. And even with our 40% increase in cruise capacity, booked occupancy remains in line with the prior year…Admissions were stronger. Food and beverage, merch, really everything came in a little bit stronger than expected...Right now, we’re not seeing any macro weakness to point to, including at the international parks.”
8) From Airbnb: “gross booking value grew 19% y/o/y, driven by strong demand and continued pricing strength. And nights and seats booked grew 9% after accounting for an approximate 100 basis point headwind for the conflict in the Middle East. We’re seeing this momentum show up across the business.”
9) From Marriott: “First quarter global RevPAR rose 4.2%. RevPAR in the US and Canada rose 4%. Luxury and resort hotels continued to lead in the region, though strength was broad based across segments and chain scales. While luxury RevPAR rose nearly 7%, select service RevPAR increased 3.5%, a meaningful improvement from the fourth quarter when select service was down more than 1% y/o/y…While the conflict in the Middle East weighed on results in March, first quarter international RevPAR increased 4.6%. RevPAR in APAC rose over 7%, driven by strong ADR growth and an increase in demand from Chinese guests. Beginning in March, Middle East travel corridor disruption started to impact select APAC markets, including India and the Maldives.”
10) From Affirm: On their consumer, “The Affirm consumer remains financially healthy. We see neither a change in demand nor in our consumers’ ability to repay. Delinquencies were up in line with expectations, with roughly half of the increase coming from a reduced denominator primarily due to stronger tax refund seasonality.”
11) From PayPal: “Compared to the fourth quarter, we saw a slight improvement in the US with softer performance continuing in Europe. Pay with Venmo and buy now/pay later continue to outpace the market, taking share from other payment methods and growing 34% and 23% respectively.”
12) From Microchip Technologies: “We are seeing significant momentum across all three major product families within our data center solutions business.”
13) From On Semi: “Turning to the demand environment, we saw a clear improvement as the quarter progressed, with strengthening order patterns and an increase in short lead time orders. Taken together, these signals give us confidence that this cycle has found its low point, and we are now on a path to recovery.”
14) From CDW: “Our first quarter performance was driven primarily by strong underlying demand as well as customer urgency to get ahead of memory related price increases and potential supply chain concerns.” Hangover to come or not after pull forward? “And that leads us to our outlook. We continue to approach the year with discipline and prudence and we are maintaining our view for the US IT addressable market to grow in the low single digits in 2026 on a customer spend basis with 200 bps to 300 bps of CDW outperformance.”
15) From Cummins: “Growth was driven primarily by higher demand and power generation markets, particularly from data centers. This increase was partially offset by weaker North America heavy and medium duty truck demand, with unit volumes down 20% from a year ago.”
16) From Tyson Foods: “Animal protein remains top of mind for consumers and continues to gain momentum as a foundational part of a healthy diet. We are directly tied to and stand to benefit from this long term trend...Consumers are choosing protein, and they’re leaning into brands they trust for quality, taste and convenience.”
17) From Colgate Palmolive: On their consumer in light of what’s going on with energy prices in particular, “I would say currently we’re not seeing a significant impact, but time will tell.”
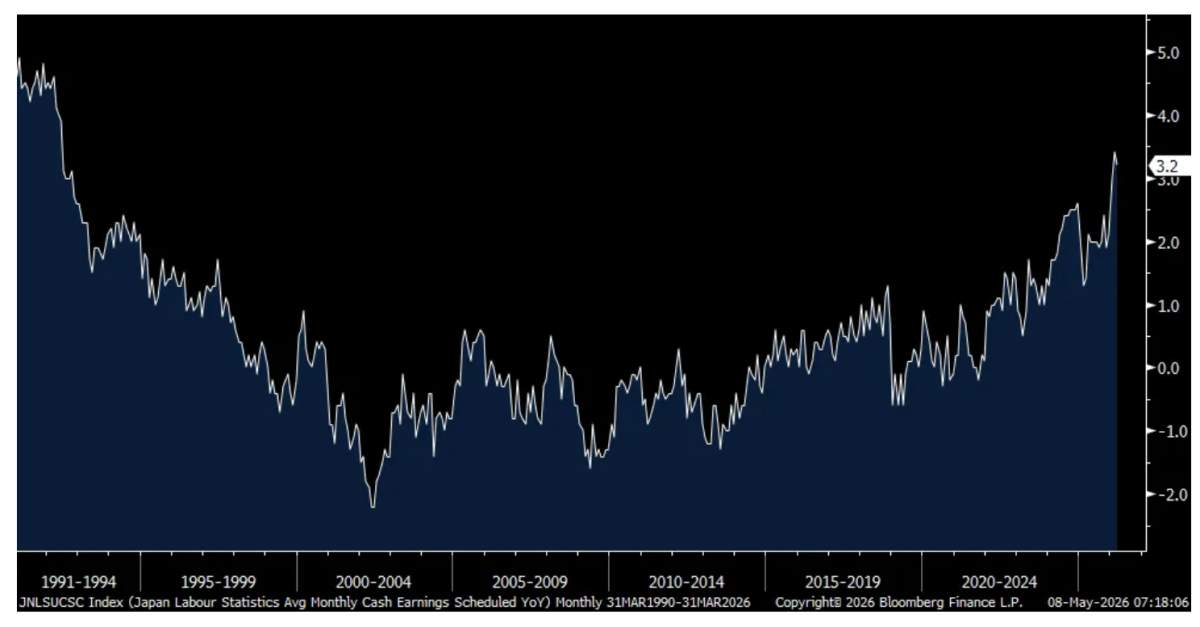
18) Wage growth in Japan remained strong with base pay rising by 3.2% y/o/y in March, and above the rate of inflation. A 3 handle for wage growth for a 3rd month was last seen in 1992.
19) German factory orders in March rose 5% m/o/m, well better than the estimate of 1% but the Economy Ministry said it was most likely due to the pull forward of orders, “The war in Iran has triggered an energy price shock that will eventually feed through to the prices of other, intermediate goods. Against this backdrop, orders were likely placed in greater numbers in March in anticipation of rising prices and potential supply bottlenecks.”
Negatives,
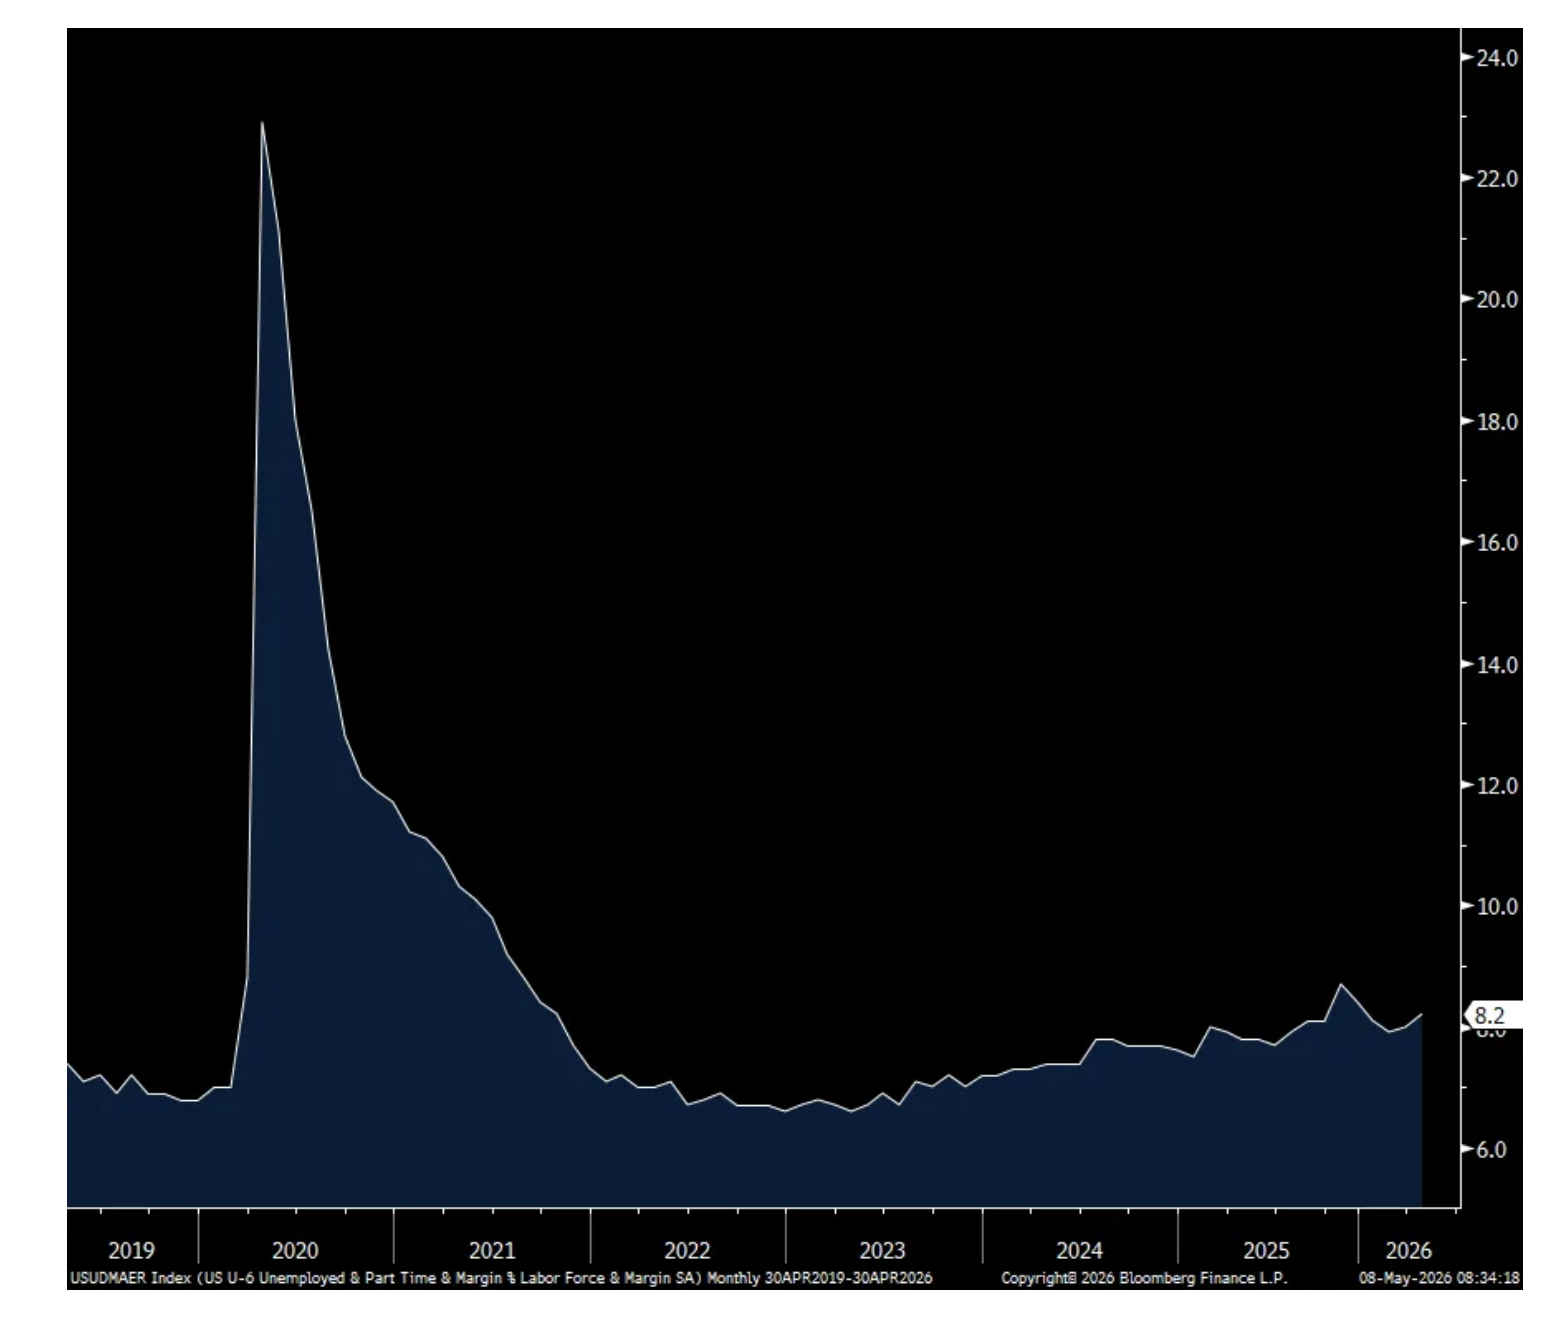
1) In contrast to the better than expected establishment survey, the April BLS household survey saw a jobs decline of 226k and lower for the 4th straight month. Combine this with the decline in the labor force of 92k and the unemployment rate held at 4.3%. However, the all in unemployment rate rose 2 tenths to 8.2% which is the highest since December when it hit 8.4%. The participation rate fell to 61.8% from 61.9% and that is the lowest since September 2021 but the key 25-54 aged cohort saw its participation rate hold at 83.8% which is just 2 tenths off from matching its highest since 2001. Average hourly earnings rose .2% m/o/m, the same pace seen in March but one tenth below the estimate. Versus last year, wages are up 3.6% y/o/y. Combine that with hours worked and weekly earnings were up 3.6% y/o/y too and up .5% m/o/m.
2) Challenger said 83,387 jobs were shed in April which is up 38% m/o/m and compares with 105,441 of cuts in April 2025. They said, “Technology companies continue to announce large-scale cuts and are leading all industries in layoff announcements. They are also often citing AI spend and innovation. Regardless of whether individual jobs are being replaced by AI, the money for those roles is.” On the hiring side, they fell by 69% m/o/m and by 38% y/o/y. Year to date hiring’s are down 13% vs the same period last year.
3) The April ISM services index fell a touch to 53.6 from 54 in March and about as expected. The Business Activity did lift by 2 pts but after falling by 6 in March and the rest of the internals were pretty mixed. With respect to industry breadth, 14 of 18 industries reported growth and 3 are in contraction. That compares with 13 up and 3 down in March with the balance seeing no change in business. ISM said this, “Ongoing commentary that increased ordering is related to getting ahead of future price increases seems to have been more applicable to March than April; however, the Backlog of Orders Index remained in expansion territory, well above its 12-month average of 46.4 percent.”
4) The May UoM consumer confidence index fell further to 48.2 from 49.8 with all of the weakness in the Current Conditions component which dropped to 47.8 from 52.5. Expectations rose a touch by .4 pts to 48.5. One year inflation expectations fell by 20 bps m/o/m to 4.5% after jumping by 110 bps over the prior two months. The 5-10 yr inflation guess was 3.4% vs 3.5% in April and 3.2% in March. The UoM said “About one-third of consumers spontaneously mentioned gasoline prices and about 30% mentioned tariffs. Taken together, consumers continue to feel buffeted by cost pressures, led by soaring prices at the pump. Middle East developments are unlikely to meaningfully boost sentiment until supply disruptions have been fully resolved and energy prices fall.” Those who own assets are feeling good, those that don’t are not but everyone is growing more sensitive to inflation.
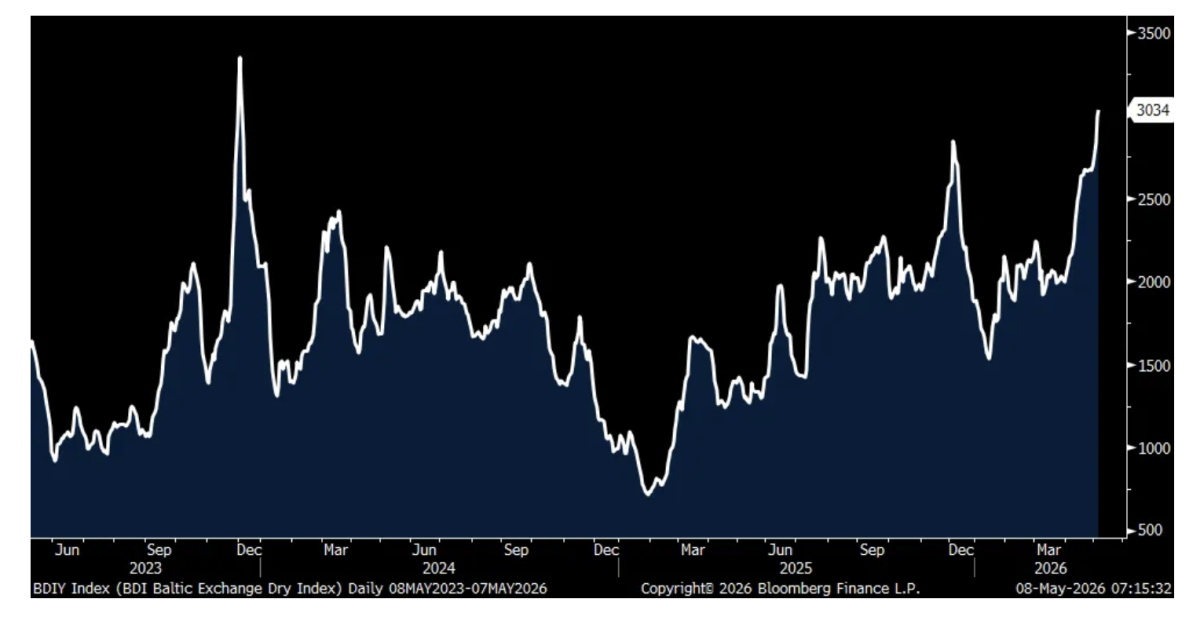
5) The Baltic Dry Index, taking stuff like coal, grains and other bulk things, closed Thursday at the highest level since December 2023.
6) According to AAA, the average gallon of gasoline rose by another $.10 ish w/o/ to above $4.50.
7) With the lift in mortgage rates purchase applications fell 3.7% w/o/w and refi’s were lower by 5%.
8) From McDonald’s: “What’s obviously going on is the macro environment and consumer sentiment. That’s not new news, but I think probably it’s fair to say that it’s certainly not improving and it may be getting a little bit worse. How that plays out in all of this, I think, is an open question.”
9) From Shake Shack: As a result of the weather impact and “our investments in additional new store openings, our first quarter adjusted EBITDA did not meet our short term quarterly expectations.” Their overseas licensed business has been hurt “by the ongoing conflict in the Middle East, driving some of our rationale for a broader adjusted EBITDA guide in 2026. The conflict has led to business disruptions ranging from temporary closures to reduced operating hours and delivery only operations for periods of time. Beyond these impacts, inbound tourism has slowed substantially, which has further pressured sales, particularly at high traffic locations.”
10) From Papa John’s: “As anticipated, North America comparable sales ended the first quarter down mid single digits, primarily driven by declining orders, which were pressured by lower new customer acquisition.”
11) From Dine Brand’s: “As the quarter progressed, the operating environment became more dynamic and in many ways, more challenging as inflation for food away from home and higher gas prices put a strain on households. With consumer sentiment declining to historically low levels, discretionary spending has become harder to justify, prompting some guests to more carefully evaluate lower cost alternatives across restaurants, grocery and other food channels. We’re seeing the most pressure on lower income consumers. And as a result, this is driving abundance and differentiated experiences like Applebee’s two for 25 platform and IHOP’s Everyday Value menu.”
12) From Planet Fitness: They talked about how weather negatively impacted business in January and February and “Yet as we moved through March and into early April, our join trends remained below our plan.” They mentioned some internal execution factors, including misplaced marketing but also said “net member growth was also impacted by higher than expected attrition in the first quarter.” And, “macroeconomic pressures and uncertainty weighed on consumers.”
13) From Whirlpool: “I want to provide a bit of background about the macro environment in North America, not as an excuse, but as context for what happened…We can see that consumer sentiment has dropped to its lowest level in 50 years. Consumer sentiment was already on a very low level by any historical standard, but the war in Iran amplified consumer concerns about the cost of living. As a direct result, the consumer sentiment index in the US plunged, reaching the lowest level on record in March. Now, while our view is that consumer sentiment is unsustainably low and should rebound from here, these events clearly pressured our industry, and particularly discretionary demand.”
14) From Fortune Brand’s: “Macro headwinds and inflation have intensified, which have impacted consumer confidence in housing affordability. This is driving increased market uncertainty, especially for single family new construction, and has resulted in an uncertain start to the spring selling season. In addition, the increase in inflation is causing raw material and commodity prices to rise, with the biggest impact to us being in aluminum, copper and freight.”
15) From Snap: Ad revenue rose 3% y/o/y, “driven primarily by growth in direct response advertising revenue, partially offset by continued headwinds in the North America large client advertising business, and an approximately $20 to $25 million impact from the geopolitical headwinds in the Middle East experienced during March.” They also mentioned those “headwinds” continued into April.
16) From Maersk: “We have seen rate spikes since the outbreak of the conflict, which averages on spot rates up to about 40% since the end of February. It is important to note that this rate increase has been roughly in line with the cost increase we have faced.”
17) From Dupont: “Organic sales growth was led by strength in healthcare and aerospace, partially offset by continued softness in construction markets and logistics disruptions due to the conflict in the Middle East. These disruptions primarily impacted sales in our water business in the quarter.”
18) From LyondellBasell: “This situation in the Middle East has materially disrupted global energy and petrochemicals markets. We expect the impacts will extend beyond the end of the year, with much of the world’s petrochemical capacity constrained or shutdown. LYB’s US and European production capacity is a critical resource for filling the global gap in supply for our essential products.”
19) From Colgate Palmolive: “We now expect more significant raw and packaging material and logistics cost inflation given the impact of the conflict in the Middle East on oil and other commodities.”
20) From Norwegian Cruise Line: “The company is experiencing headwinds related to disruptions in the Middle East, including higher fuel expense and signs of softer demand as consumers reevaluate travel plans, particularly to Europe. As previously noted, the Company entered 2026 behind its targeted booking curve, and these headwinds have hindered the Company’s ability to accelerate bookings and close that gap. These external pressures come as the Company continues to enhance its revenue management system and improve execution, resulting in additional pressure on the business and a reduction in its full year guidance.”
21) From Microchip Technologies: “While lead time for our products have been 4-8 weeks for some time, we are continuing to see lead times increase on many of our products. We are running into challenges on certain kinds of substrates and subcontracting capacity, and also foundry constraints on multiple nodes. These challenges previously were isolated to very specific areas, but are now starting to spread more broadly. Our customer requests for expedited shipments have increased significantly from a couple of quarter ago, pointing to some customers’ inventories running very low.”
22) The Norges Bank in Norway raised interest rates to 4.25% and NOT expected. The Governor said “Inflation is too high, and there are prospects that inflation will remain elevated ahead. The committee judges that a higher policy rate is needed to return inflation to target within a reasonable time horizon.”
23) The Reserve Bank of Australia raised rates again by 25 bps as expected to 4.35%. That now takes back all of their cuts that they started to implement in February 2025 after the aggressive hiking seen in 2022 and 2023.
BY Doug Kass · May 8, 2026, 2:40 PM EDT
BY Doug Kass · May 8, 2026, 2:05 PM EDT
Today's divergence of financials vs. technology is probably unprecedented.
Position: None
BY Doug Kass · May 8, 2026, 1:45 PM EDT
Wolf Street howls about the weird labor market.
Position: None
BY Doug Kass · May 8, 2026, 1:25 PM EDT
I was going to point out the narrowness of the rally but I have sung that song before!
I was going to point out the absurd volume in 0DTE call options on the leading memory/semi stocks, but I have also sung that song before!
And, both, to no avail.
Position: None
BY Doug Kass · May 8, 2026, 1:05 PM EDT
BY Doug Kass · May 8, 2026, 12:50 PM EDT
In reaction to weak guidance, an investment short, (FIGS) , is down by -27%.
Here is the press release. FIGS, Inc. - FIGS Releases First Quarter 2026 Financial Results
I am bidding to cover half of my short.
Position: Short FIGS (S)
BY Doug Kass · May 8, 2026, 12:17 PM EDT
Positions: None.
BY Doug Kass · May 8, 2026, 11:45 AM EDT
- NYSE volume flat to its one-month average;
- Nasdaq volume 3% above its one-month average;
- VIX Index: up 1.70% to 17.37
Positions: None.
BY Doug Kass · May 8, 2026, 11:31 AM EDT
From Peter Boockvar:
The May UoM consumer confidence index fell further to 48.2 from 49.8 with all of the weakness in the Current Conditions component which dropped to 47.8 from 52.5. Expectations rose a touch by .4 pts to 48.5. One year inflation expectations fell by 20 bps m/o/m to 4.5% after jumping by 110 bps over the prior two months. The 5-10 yr inflation guess was 3.4% vs 3.5% in April and 3.2% in March.
The outlook for employment over the coming 12 months improved by 5 pts after dropping by 6 last month. The income situation remained negative.
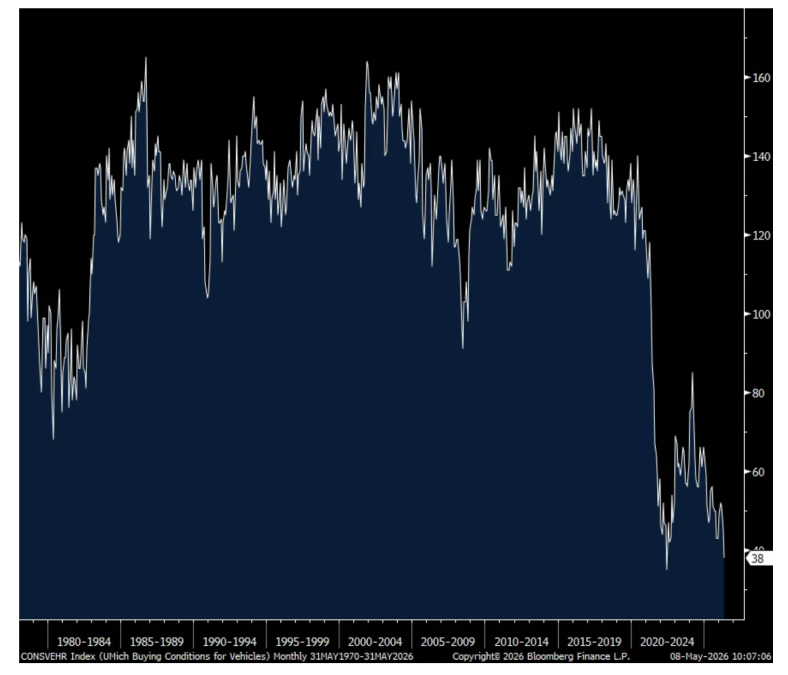
Spending intentions fell for a vehicle to the lowest level since June 2022 and back to at least 1978 that I have data on before that. There was a 6 pt drop in intentions to buy a major household item. After falling by 3 pts last month, plans to buy a home rose 1 pt.
The UoM said “About one-third of consumers spontaneously mentioned gasoline prices and about 30% mentioned tariffs. Taken together, consumers continue to feel buffeted by cost pressures, led by soaring prices at the pump. Middle East developments are unlikely to meaningfully boost sentiment until supply disruptions have been fully resolved and energy prices fall.”
And, do you own stocks or not and where are you on the income spectrum? They also said, “Sentiment trends continue to diverge across the wealth distribution. This month, consumers without stockholdings experienced a 10% decline in sentiment; those with the bottom and middle tercile of stock wealth had sentiment decreases of almost 2 and 6% respectively. In contrast, those with the largest one-third of stock portfolios reported a 7% increase in sentiment. A similar k-shaped pattern is seen by income; sentiment for higher-income consumers rose this month, while it fell for those with middle and lower incomes. These higher-income, wealthier consumers are supported by their greater resources as well as soaring asset values, while rising prices dominate the views of their counterparts.”
But also, the higher cost of living is being felt by everybody, “Still, all four groups have exhibited a steady rise in high-price concerns over the past year; highest-wealth consumers are again moving in parallel with lower-wealth counterparts. This upward trend coincides with the 2025 rollout of new tariffs as well as the supply disruptions from the Iran conflict that continued this month. Although higher-wealth consumers report less influence of high prices on the state of their personal finances than other consumers, the growth in concerns are seen across the board. Moreover, recent declines in year-ahead real income expectations are also shared across the wealth distribution.”
Bottom line, not much to add here but we’re seeing again quite the contrast among different groups in the US economy with respect to their financial situation.
UoM
One yr Inflation Expectations
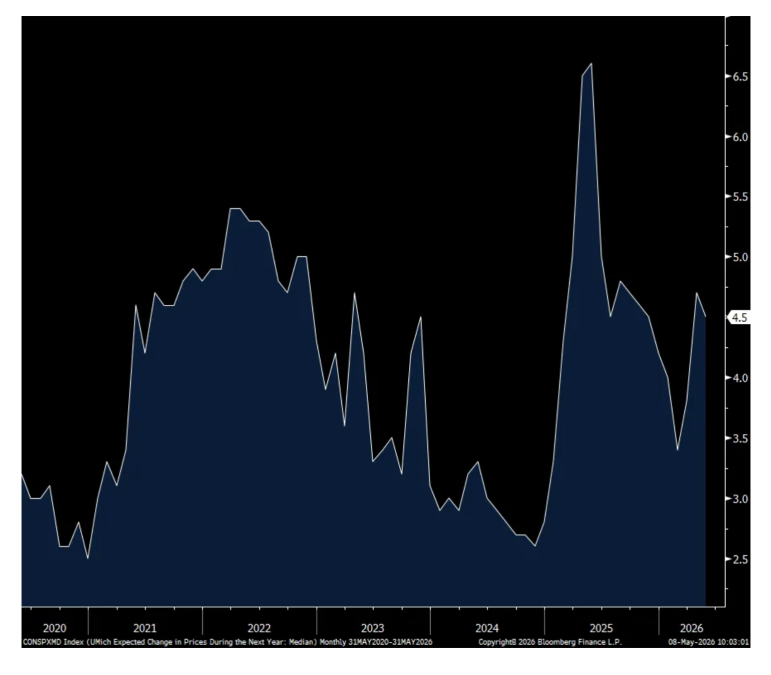
Spending Intention to buy a Vehicle

Positions: None.
BY Doug Kass · May 8, 2026, 11:15 AM EDT
I am bidding a bit under the market on (WYNN) (-$6 today) to cover 1/4 of the short.
Position: Short WYNN S
BY Doug Kass · May 8, 2026, 10:36 AM EDT
With S&P cash +54 handles I shorted more indexes:
* (SPY) $736.91
* QQQ $705.45
Positions: Short SPY S QQQ S
BY Doug Kass · May 8, 2026, 10:29 AM EDT
From Peter Boockvar:
More signs of a stressed consumer (certainly lower to middle income relative to upper) that is getting further squeezed by higher inflation and low confidence as heard from earnings reports yesterday.
From McDonald’s and whose stock was little changed but made some noteworthy comments on the macro:
“Starting with the US, comparable sales grew 3.9% for the quarter, and importantly, we delivered positive comparable sales and guest count gaps to our near-end competitors and maintained market share…Value continued to contribute meaningfully to our growth throughout the quarter, including our Extra Value Meals, which have performed well since the relaunch last September.”
“What’s obviously going on is the macro environment and consumer sentiment. That’s not new news, but I think probably it’s fair to say that it’s certainly not improving and it may be getting a little bit worse. How that plays out in all of this, I think, is an open question.”
“I think at a macro level, it’s largely unchanged and that the higher income continues to have very resilient spending. And that is true for our business as well, where we’re seeing solid growth, good growth with higher income and also gaining share with higher income for us. On that lower income, while the declines are not as pronounced as they were, maybe 6 or 12 months ago, when we were talking about high single digit, the low income is absolutely still declining. Now, I think some of that is probably due to lapping. I think also, in our business, we would look and say, we think we’ve recaptured some of those low income consumers because of our value program. But clearly, when you have elevated gas prices, which is the core issue that I think we’re all seeing about in the press right now, gas prices, inflation, that is going to disproportionately impact low income consumers. And so, we expect the pressures there are going to continue.”
Lastly with Mickey D’s, “there is certainly a lot of activity happening in chicken across the industry…And I do think it is a fair thing to point out that when beef prices are as elevated as they are, chicken becomes a much more attractive value opportunity relative to beef.”
From Shake Shack and whose stock got hit hard by 28%:
Comps grew 4.6%, “including a 1.4% traffic growth. These strong sales and continued traffic growth were achieved despite significant weather impacts that contributed 240 bps of negative comp in the quarter.” As a result of the weather impact and “our investments in additional new store openings, our first quarter adjusted EBITDA did not meet our short term quarterly expectations.”
Their overseas licensed business has been hurt “by the ongoing conflict in the Middle East, driving some of our rationale for a broader adjusted EBITDA guide in 2026. The conflict has led to business disruptions ranging from temporary closures to reduced operating hours and delivery only operations for periods of time. Beyond these impacts, inbound tourism has slowed substantially, which has further pressured sales, particularly at high traffic locations.”
They particularly cite declines in tourism to New York City.
This too, “Obviously beef prices are elevated, continue to be elevated, although the rate of growth on the beef pricing that we’re seeing is less than half it was last year.”
From Papa John’s, down 2.5% yesterday:
“As anticipated, North America comparable sales ended the first quarter down mid single digits, primarily driven by declining orders, which were pressured by lower new customer acquisition.”
“During the quarter, we continued to see resilience in core pizza and customers ordering multiple pizzas, with flat y/o/y pizza volumes, excluding two weeks that were impacted by severe weather, and pies per order increasing 5% versus last year.”
“Outside of pizza, comparable sales were pressured by declines in size and desserts, and lower new customer acquisition compared with last year.”
With guidance, “For North America, we still expect comparable sales to be down 2% to 4% Our guidance reflects both the benefit of our innovation pipeline, and enhanced marketing strategy, and considerations around the current cautious consumer environment. April North American comparable sales are trending slightly worse than Q1 on a y/o/y basis but consistent with Q1 on a 3 year stack.”
Whirlpool had a rough day and said this on their call:
“we finished a tough quarter in our North American business...The month of March, which typically carries the quarter in North America, was exceptionally weak.”
“I want to provide a bit of background about the macro environment in North America, not as an excuse, but as context for what happened…We can see that consumer sentiment has dropped to its lowest level in 50 years. Consumer sentiment was already on a very low level by any historical standard, but the war in Iran amplified consumer concerns about the cost of living. As a direct result, the consumer sentiment index in the US plunged, reaching the lowest level on record in March. Now, while our view is that consumer sentiment is unsustainably low and should rebound from here, these events clearly pressured our industry, and particularly discretionary demand.”
“The US appliance industry demand declined 7.4% in the first quarter, with March being down 10%. This level of industry decline is similar to what we have observed during the global financial crisis and even higher than during other recessionary periods. Keep in mind that we are operating in an environment where the replacement demand drives more than 60% of the industry, and this part of the demand is relatively stable. So this gives you a sense about how dramatic the impact on discretionary demand was.”
“While we do believe that the negative industry demand in March was somewhat of an outlier, we do not anticipate a full recovery and are now forecasting the US as the demand being down by 5% on a full year basis.”
From Fortune Brands, the owner of brands such as Moen on the faucet side and Master Lock on the security side:
“Macro headwinds and inflation have intensified, which have impacted consumer confidence in housing affordability. This is driving increased market uncertainty, especially for single family new construction, and has resulted in an uncertain start to the spring selling season. In addition, the increase in inflation is causing raw material and commodity prices to rise, with the biggest impact to us being in aluminum, copper and freight.”
They are trying to mitigate this all with cost cuts “coupled with additional commercial and operational levels.”
From Planet Fitness:
They talked about how weather negatively impacted business in January and February and “Yet as we moved through March and into early April, our join trends remained below our plan.” They mentioned some internal execution factors, including misplaced marketing but also said “net member growth was also impacted by higher than expected attrition in the first quarter.” And, “macroeconomic pressures and uncertainty weighed on consumers.”
Said and seen again, live entertainment and experiences continue to be a bright side. From Madison Square Garden Entertainment, a stock we own:
“I’m pleased to say that demand for our live entertainment offerings remain strong...Behind these results were a number of important drivers including continued momentum in our concert business at the Garden, growth in marketing, partnerships and suites, and the last shows of this past season’s record setting Christmas Spectacular run.”
“From a demand standpoint, we continue to see the vast majority of concerts at our venues sell out. In addition, food and beverage per caps at concerts were up in the quarter while merchandise per caps were down, both of which we primarily attribute to the mix of events.”
To travel and from Airbnb:
“gross booking value grew 19% y/o/y, driven by strong demand and continued pricing strength. And nights and seats booked grew 9% after accounting for an approximate 100 basis point headwind for the conflict in the Middle East. We’re seeing this momentum show up across the business.”
“When tariff uncertainty led to fewer people traveling to the US last year, they came to Airbnb and found somewhere else to go. And we’re seeing a similar dynamic now. We have millions of homes, everywhere in the world, at nearly every price point. And that’s something most travel companies can’t replicate. And it’s a core reason we’re able to deliver consistent results even in challenging environments.”
“During the quarter, we saw nights growth accelerate from January to February. However, we saw a slight deceleration in March, largely due to conflict related cancellations across EMEA and APAC.”
Affirm said they are not seeing any issues with the consumer but no question more and more are using Buy Now Pay Later for daily necessities.
To the question, “are you guys seeing any issues or changes on the funding side of the business?”, and that is in light of what is going on in private credit, the CEO said “No, we are not. At this point, I think we’ve earned the right to say the Affirm consumer. And so these are not comments on the universe or even North America or United States consumer, but people that we choose to underwrite and lend to, we are not seeing deterioration. We’re not seeing any disturbances in the force, which naturally translated to a very stable and pleasant funding environment for us.”
On their consumer, “The Affirm consumer remains financially healthy. We see neither a change in demand nor in our consumers’ ability to repay. Delinquencies were up in line with expectations, with roughly half of the increase coming from a reduced denominator primarily due to stronger tax refund seasonality.”
From Microchip Technologies, trading up pre-market and we know in the right space right now:
While they sell into a lot of industrial end markets, “We are seeing significant momentum across all three major product families within our data center solutions business.”
This was interesting, “While lead time for our products have been 4-8 weeks for some time, we are continuing to see lead times increase on many of our products. We are running into challenges on certain kinds of substrates and subcontracting capacity, and also foundry constraints on multiple nodes. These challenges previously were isolated to very specific areas, but are now starting to spread more broadly. Our customer requests for expedited shipments have increased significantly from a couple of quarter ago, pointing to some customers’ inventories running very low.” And I’ll add, likely too that customers are trying to pull forward orders ahead of price increases and concerns about shortages.
Moving on.
While container shipping prices globally have remained relatively low post conflict, though have lifted off the lows, the Baltic Dry Index, taking stuff like coal, grains and other bulk things, closed yesterday at the highest level since December 2023.
Baltic Dry Index
Overseas, wage growth in Japan remained strong with base pay rising by 3.2% y/o/y, and above the rate of inflation. A 3 handle for wage growth for a 3rd month was last seen in 1992. JGB yields were little changed but the yen is up and the DXY is at the lowest level since the first trading day in March.
Base Pay y/o/y
Positions: None.
BY Doug Kass · May 8, 2026, 10:20 AM EDT
From Neil The Real Deal:
nsethi9999
Doug on your hyperscaler post thought you'd like this from the FT talking about the jump in "other income" from other companies in the AI economy:
This is another sign of just how comically codependent the AI tech industry has become. Not only have private investments and increasingly engorged funding rounds become a meaningful driver of the hyperscalers’ aggregate earnings, but the money the hyperscalers have pumped into the likes of Anthropic and OpenAI has allowed the AI companies to sign huge computing deals with Alphabet’s Google Cloud, Microsoft’s Azure and Amazon Web Services. In fact, The Information has crunched the numbers, and OpenAI and Anthropic now make up about half of the entire cloud computing order books at Oracle, Alphabet, Amazon and Microsoft.
https://www.ft.com/content/be97df0a-76b1-4cb0-9ba4-d1117d8d1450
Position: None
BY Doug Kass · May 8, 2026, 10:15 AM EDT
From Peter Boockvar:
April payrolls grew by 115k, almost double the estimate of 65k and only partially offset by a combined downward revision to the two prior months of 16k. In contrast, the household survey saw a jobs decline of 226k and lower for the 4th straight month. Combine this with the decline in the labor force of 92k and the unemployment rate held at 4.3%. However, the all in unemployment rate rose 2 tenths to 8.2% which is the highest since December when it hit 8.4%. There was a 4 month high in those working part time because of ‘slack’ work and a 3 month high in those working part time because they can’t find full time work.
Driving the job gains were health/social assistance, again, of 54k and transportation/warehouse which contributed 30k. Retail hired a net 22k. Leisure/hospitality added 14k. Jobs were lost in financial services and information. The federal government too shed jobs.
On the goods side, manufacturing cut 2k jobs while construction hired 9k.
Hours worked ticked up to 34.3 from 34.2 and has been facilitating between the two for the past 15 months. The participation rate fell to 61.8% from 61.9% and that is the lowest since September 2021 and continues to be a fly here but a lot of this is due to retiring boomers. The key 25-54 aged cohort saw its participation rate hold at 83.8% which is just 2 tenths off from matching its highest since 2001. Average hourly earnings rose .2% m/o/m, the same pace seen in March but one tenth below the estimate. Versus last year, wages are up 3.6% y/o/y. Combine that with hours worked and weekly earnings were up 3.6% y/o/y too and up .5% m/o/m.
Smoothing out the monthly gyrations, the 3 month pace of hiring is now 48k vs the 6 month average of 55k and the 12 month average of 21k.
Bottom line, the headline number looks good but as seen right above, the last two months just help to offset the February weakness. And, the household survey has 4 months in a row of job declines and the labor force has shrunk by 488k in the past two months. Also, we know the headline data will get revised multiple times before we actually know how things settle out.
The 2 yr Treasury yield, maybe looking at the household survey, fell 2 bps in response to 3.89% while the 10s and 30s are down 1 bp post data release.
U6 Unemployment Rate
Hours Worked
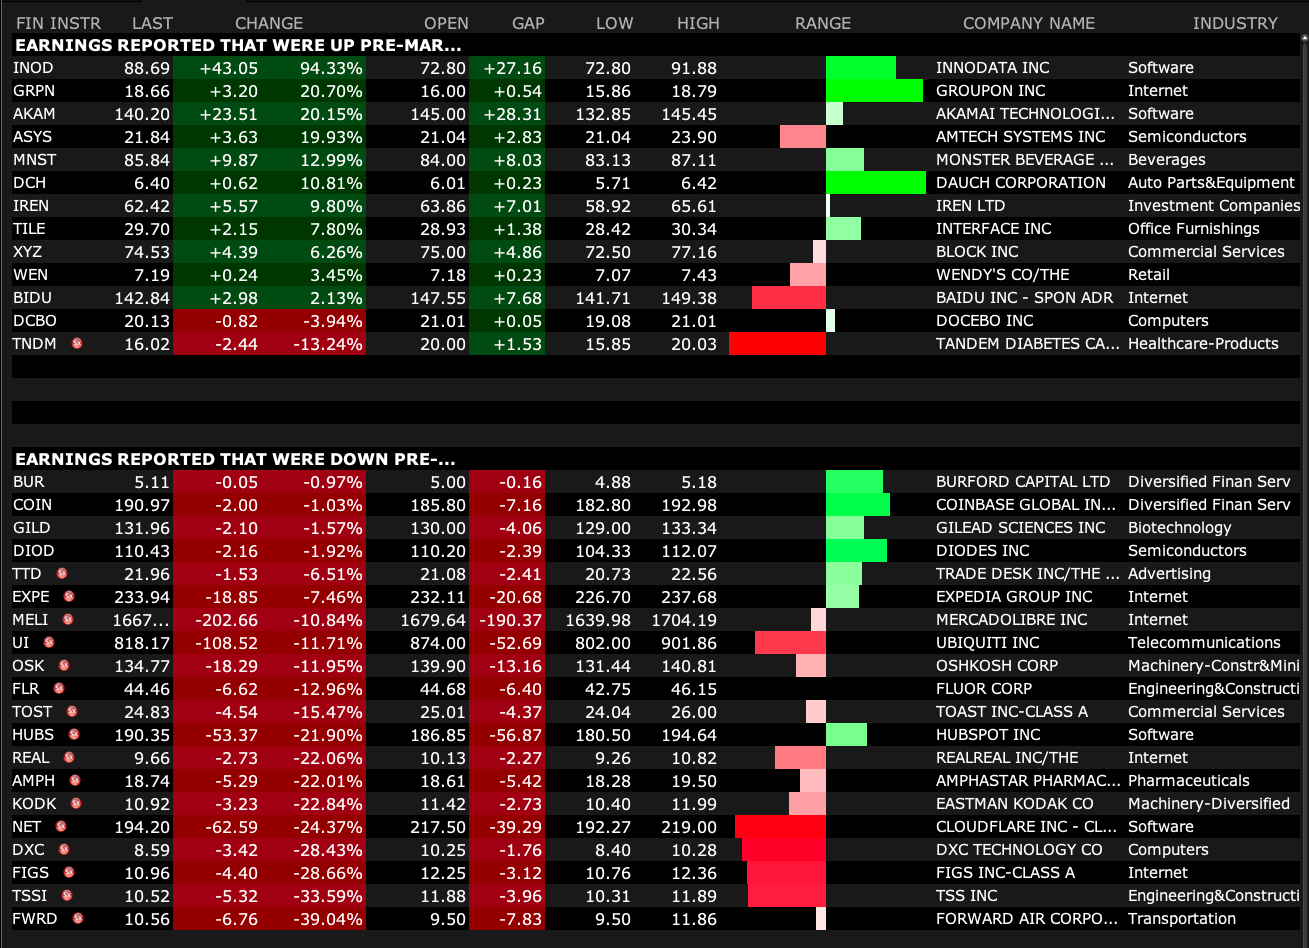
BY Doug Kass · May 8, 2026, 9:50 AM EDT
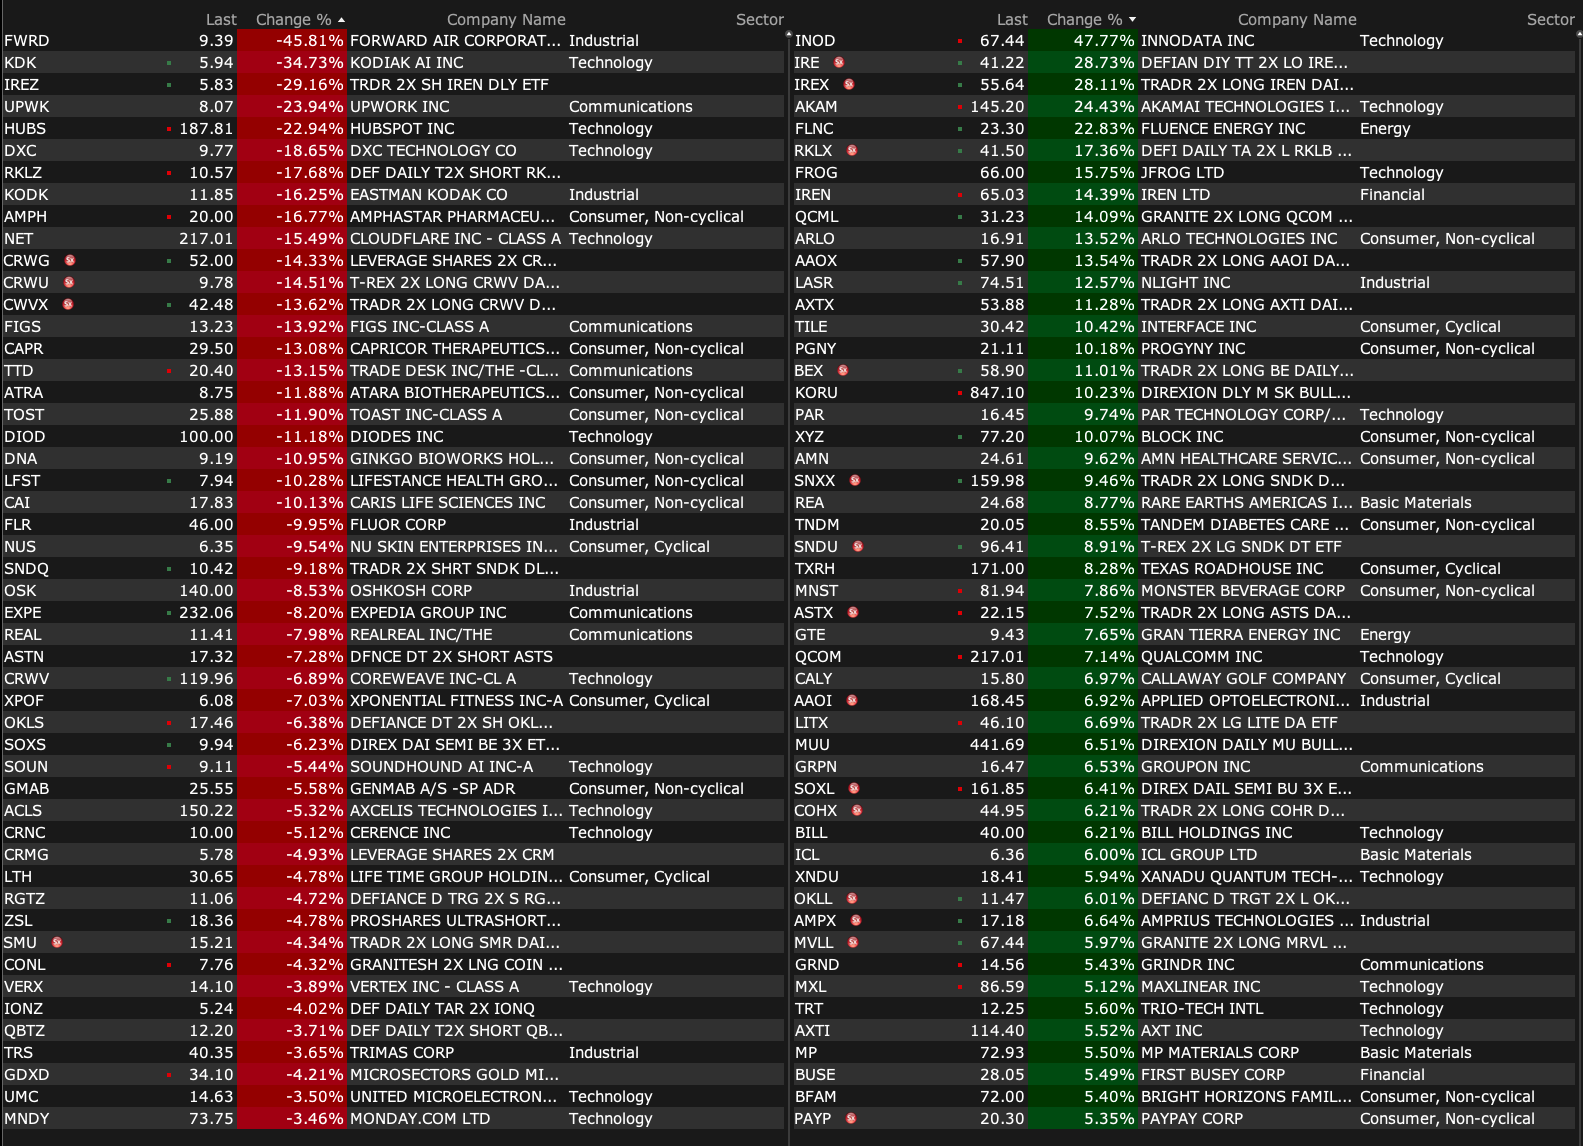
-INOD +48% (earnings, guidance)
-AKAM +24% (earnings, guidance)
-FROG +16% (earnings, guidance)
-ASYS +12% (earnings, guidance)
-IREN +12% (earnings, color)
-TILE +11% (earnings, guidance)
-XYZ +9.9% (earnings, guidance)
-TNDM +8.6% (earnings, guidance)
-MNST +7.3% (earnings, color)
-QCOM +7.0% (hearing Daiwa Securities Raised QCOM to Outperform from Neutral, price target: $225 from $140)
-WEN +5.5% (earnings, guidance)
-BIDU +5.1% (hearing AI chip division considering IPO in Hong Kong)
-DCH +4.0% (earnings, guidance)
-DCBO +3.1% (earnings, guidance)
-GRPN +3.0% (earnings, guidance)
-FWRD -46% (earnings, color)
-HUBS -24% (earnings, guidance)
-TSSI -24% (earnings, guidance)
-DXC -19% (earnings, guidance)
-AMPH -17% (earnings, color)
-KODK -15% (earnings, color)
-NET -15% (earnings, guidance)
-FIGS -14% (earnings, guidance)
-TOST -13% (earnings, guidance)
-TTD -13% (earnings, guidance)
-CAPR -12% (takes Legal Action to Protect Patient Access to Deramiocel for Duchenne Muscular Dystrophy)
-BUR -11% (earnings, guidance)
-FLR -11% (earnings, guidance)
-DIOD -9.2% (earnings, guidance)
-OSK -9.0% (earnings, guidance)
-EXPE -8.0% (earnings, guidance)
-UI -8.0% (earnings, color)
-REAL -7.7% (earnings, guidance)
-MELI -5.5% (earnings, color)
-COIN -2.9% (earnings, guidance)
-GILD -2.3% (earnings, guidance)
Positions: none.
BY Doug Kass · May 8, 2026, 9:28 AM EDT
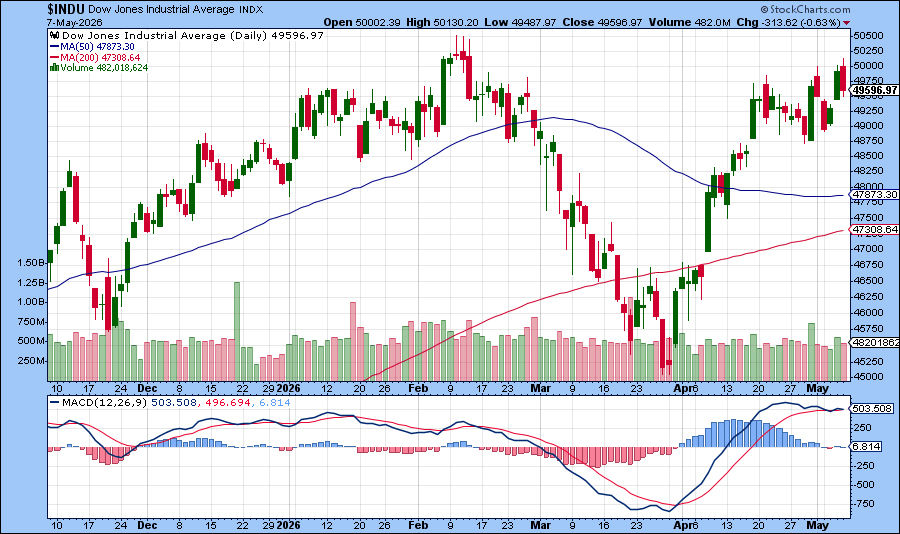
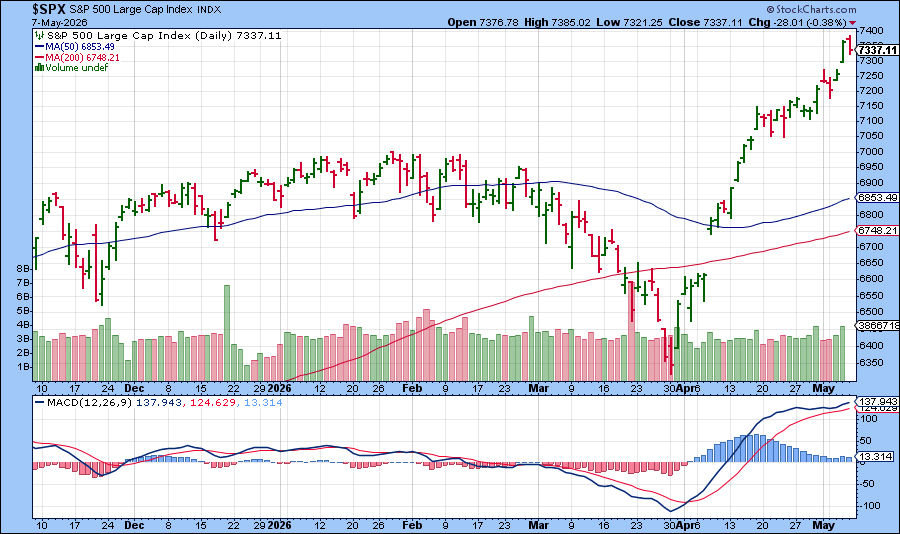
Wall Street’s rebound since late March has been driven by the smallest number of stocks on record, pushing US market concentration to an all-time high-FT pic.twitter.com/W4dIFEVKnC
— Tracy Shuchart (𝒞𝒽𝒾 ) (@chigrl)
Positions: None.
BY Doug Kass · May 8, 2026, 9:23 AM EDT
Positions: None.
BY Doug Kass · May 8, 2026, 8:58 AM EDT
With S&P futures +46 handles I just added to my index shorts:
* (SPY) $736.48
* (QQQ) $701.66
Positions: Short SPY S QQQ S
BY Doug Kass · May 8, 2026, 8:43 AM EDT
Position: None.
BY Doug Kass · May 8, 2026, 8:38 AM EDT
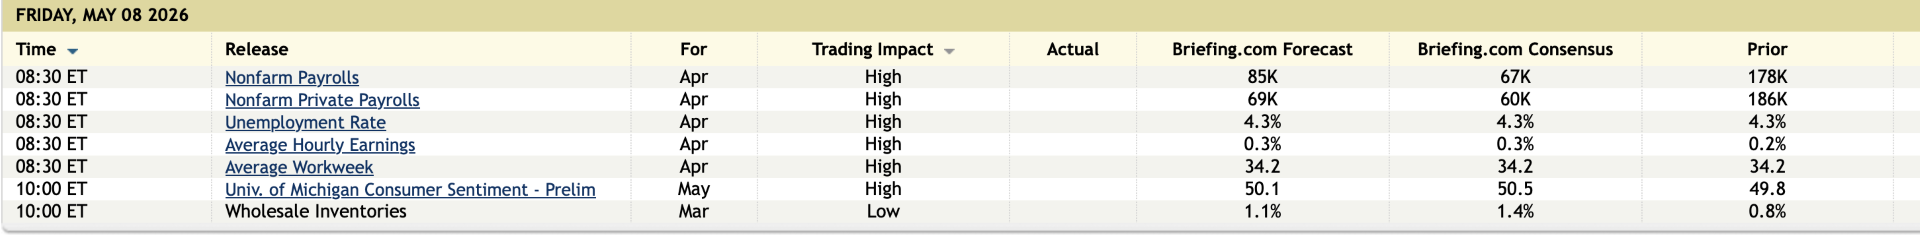
Fed Speakers:
5:45AM: Fed Board of Governor Cook (Voter) speaks about tokenization at the Central Bank of West African StatesConference on Digital Assets, Dakar; 11:05AM: Fed Bank of Chicago President Goolsbee (Non-Voter) Television Appearance -- CNBC;
2:20PM: Fed Bank of Chicago President Goolsbee (Non-Voter) Television Appearance -- Bloomberg Television;
7:30PM: Fed Bank of Chicago President Goolsbee (Non-Voter); Fed Bank of San Francisco President Daly (Non-Voter), FOMC Member Waller (Voter)and FOMC Member Bowman (Voter) participate in panel before the Hoover Institution Monetary Policy Conference 2026, "Independence,Structure, and Risks Ahead for Central Banks," Stanford, CA (Goolsbee embargoed text TBD. Livestream available. Other details TBA);
Time: Episode to publish across podcast platforms early Friday morning.
Fed Bank of Chicago President Goolsbee (Non-Voter)Podcast Appearance -- The Economics Show (Financial Times).
Economic Calendar
BY Doug Kass · May 8, 2026, 8:25 AM EDT
The risk-free rate of return (use the 10-year yield) is now over 90 basis points higher than the S&P index's earnings yield (the inverse of the S&P price-earnings ratio).
That is the second deepest discount in the last 24 years.
This means that market participants are suggesting there is more risk in holding bonds than in holding equities!
If one wants to distill the Bear Argument down to one chart, here it is...
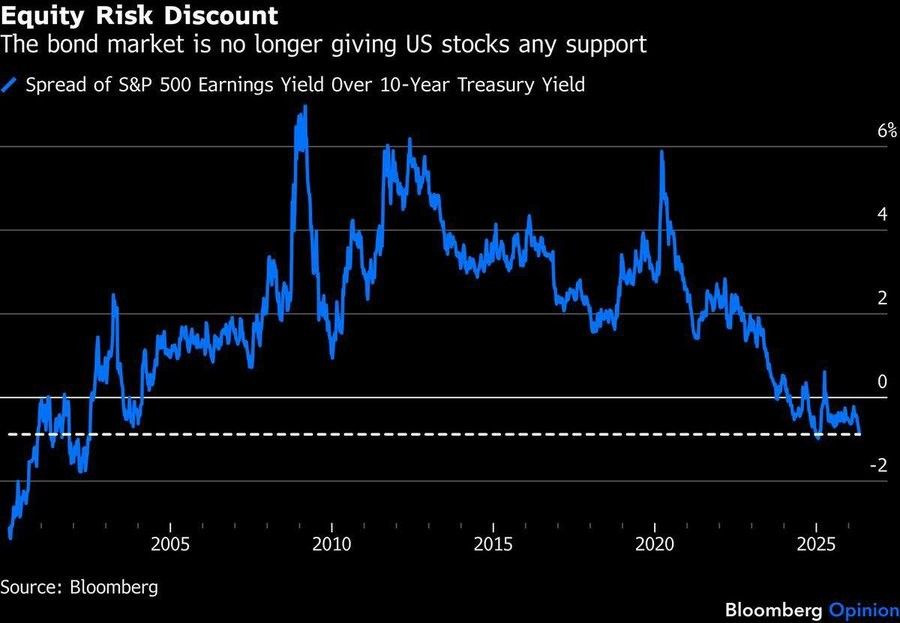
More bear (valuation) fodder:
‼️The US stock market has almost never been this expensive in 150 years of data:
— Global Markets Investor (@GlobalMktObserv)
The P/E10 ratio is currently at 37.9, the 2nd highest reading in history, surpassed only by the March 2000 Dot-Com peak of 44.2.
This measures stock prices against the average of 10 years of… pic.twitter.com/zxMHYn7gyK
Position: None
BY Doug Kass · May 8, 2026, 7:30 AM EDT
From Jazzy Jeff Hirsch's Stock Trader's Almanac:
Even though it has been a week since S&P 500 finished April with an impressive 10.42%, there is still an ongoing discussion about the abrupt reversal and what to expect in the near term. Take the gains and “sell in May” or will this strength continue? First let’s put some context around this year’s April S&P 500 gain. It was the fourth best April for S&P 500 since 1930. The closest comparable April in recent years was in 2020 when S&P 500 jumped 12.7%. Prior to that, the last time S&P 500 climbed double digits in April was way back in 1938 (+14.1%). The best April ever…+42.2% in 1933.
For our research today, a “big” April is defined as a gain of at least three times April’s average (mean) monthly performance since 1950. This works out to be a 4.67% gain when April 2026 is included. Since 1950, there have been 15 other years when S&P 500 gained 4.67% or more. When compared to the other 61 years, big April gains were broadly bullish for May, the remainder of the year, and the full year with average performance essentially double “All Other Years.” Performance in May saw the biggest improvement jumping to a 2.12% gain following Big Aprils versus a –0.07% decline in “All Other Years.” Frequency of gains (% Higher) also improved across the board.
There was also a modest improvement in the Max Drawdown that occurred during May to December. Following Big Aprils, the subsequent drawdown tended to begin around the same time but ended earlier and resulted in lower Median drawdown. The worst years that had Big Aprils were 2001 (2nd year of tech bubble and 9/11) and 2008 (financial crisis). In both of those years the bulk of the damage was during the “Worst Six Months.”

For those of us that enjoy a quick graphic, we have plotted the 15 Big April years in the following S&P 500 Seasonal Pattern chart. We have included the 6th Year of Presidency, Trump Presidency Years, and 2026 as of today’s close for comparison. All three patterns end the year at approximately the same level, around 12-15%, pushing the upper range of our Base case 2026 forecast. Along the way, we still cannot rule out the possibility of some volatility due to the Iran conflict, high crude oil price, tepid seasonal factors, and midterm elections.

Seasonal MACD Sell Signal Update
As of today’s close, MACD indicators applied to DJIA and S&P 500 are positive. S&P 500 would need to decline 173.01 points (–2.36%) in a single day to turn its MACD indicator negative while DJIA needs to gain at least 54.13 points (+0.11%) tomorrow for its MACD indicator to remain positive. Continue to hold long positions associated with DJIA’s and S&P 500’s “Best Six Months.” We will issue the Seasonal MACD Sell signal when corresponding MACD Sell indicators applied to DJIA and S&P 500 both crossover and issue a new sell signal.
We have been reminding everyone that a key criterion to issue our Seasonal MACD Sell signal for DJIA and S&P 500 is that both their MACD indicators must agree. Earlier this week was an example of DJIA’s MACD indicator briefly turning negative, but S&P 500 MACD remained positive. As a result, there was no signal issued on Tuesday, May 5. Both MACD indicators must be negative when the market closes.
You can track MACD using your preferred charting platform. Our Seasonal MACD Sell indicator is calculated using daily closing prices with a short exponential moving average (ema) of 12, a long ema of 26 and a 9-period ema for the signal line. This is frequently written as 12-26-9 or in the accompanying charts as 12, 26, 9.
Position: None
BY Doug Kass · May 8, 2026, 7:10 AM EDT
Citigroup cuts Wynn Resorts' (WYNN) price target to $132 from $145.
Position: Short WYNN (VS)
BY Doug Kass · May 8, 2026, 6:55 AM EDT
The S&P Short Range Oscillator remains in overbought at 1.60% vs. 2.22%.
Position: Short SPY (VS), QQQ (VS)
BY Doug Kass · May 8, 2026, 6:45 AM EDT
Here is an indicator that The Divine Ms M often looks at:
I'm thinking the sentiment has gotten way too frothy?
— Seth Golden (@SethCL)
Nobody wants Puts on Nasdaq 100 $NDX $QQQ
NDX P/C Ratio is lowest level since 2023, and has fallen off a cliff.
Near-term mean reversion in sentiment; price consolidation? $COMPQ $TQQQ pic.twitter.com/bVm8vs8IiL
Position: None
BY Doug Kass · May 8, 2026, 6:35 AM EDT
The market just did something it has literally NEVER done before.
— The Assembly (@InTheAssembly)
The S&P 500 traded $2.6 trillion in call options yesterday.
The highest single day call volume in market history.
When traders buy massive amounts of calls, the market makers selling those calls are forced to… https://t.co/v1zFr6jBZU pic.twitter.com/ONgwYN010g
Position: None
BY Doug Kass · May 8, 2026, 6:25 AM EDT
Wells Fargo downgrades Nike (NKE) from overweight to neutral.
Position: None
BY Doug Kass · May 8, 2026, 6:15 AM EDT
‼️Big Tech cash is disappearing at a RAPID PACE:
— Global Markets Investor (@GlobalMktObserv)
Combined free cash flow across Microsoft, Alphabet, Amazon, Meta, and Oracle is projected to FALL more than -70%, to ~$100 billion, by the end of 2026.
This figure peaked at ~$250 billion in early 2024, even as trailing net… pic.twitter.com/RT1HA859Pm
Bye bye Big Tech buybacks.
— Brian Sozzi (@BrianSozzi)
Says Goldman Sachs:
"The hyperscalers now allocate 20% of total spending to buybacks and dividends compared with an average of 34% from 2017-2022. We expect minimal hyperscaler buyback growth through 2027. Consensus estimates show hyperscaler capex… pic.twitter.com/2amZgwqwtb
AI is driving US economic growth:
— The Kobeissi Letter (@KobeissiLetter)
Investment in software and IT equipment contributed +134 basis points to Q1 2026 GDP growth of 2.0%, the largest quarterly contribution in history.
This means that 67% of last quarter's economic growth was driven by AI.
To put this… pic.twitter.com/ZbOFvbHrP0
Just five companies - Alphabet, Nvidia, Amazon, Broadcom and Apple - have accounted for half of the S&P 500's growth since April. https://t.co/pOqEyV65hM pic.twitter.com/yQNbb91Y6x
— Lisa Abramowicz (@lisaabramowicz1)
It continues to be a market of AI vs. not AI.
— Liz Thomas (@LizThomasStrat)
47 stocks in the S&P 500 are currently at or within 2% of a 52-week high. 31 of them are in AI-sensitive industry groups, or roughly two-thirds. pic.twitter.com/KhTJejSyj3
JPM (Schilsky): AI Token Costs are Eating Internet Profits Alive:
— Neil Sethi (@neilksethi)
"My title is a tad bombastic, but it’s worth noting that several Internet companies this quarter explicitly called out rising LLM/token costs as part of their expense outlook.
"I have a VERY sneaking suspicion… pic.twitter.com/TPrrBPtCxH
Morgan Stanley sees capital spending by the five largest AI hyperscalers topping $800 billion this year and $1.1 trillion next year. At 3.3% of gross domestic product, next year’s figure would exceed projected spending on national defense. https://t.co/s1TohsgmPg pic.twitter.com/QgDuMEeMPV
— Lisa Abramowicz (@lisaabramowicz1)
Position: None
BY Doug Kass · May 8, 2026, 6:05 AM EDT
After covering most of my index shorts on the fall in futures last evening, I have added back to the index shorts. I have also put on these additional shorts in the premarket (at around 530 AM):
* (SPY) $735.07
* (QQQ) $699.41
* (AMD) $414.20
* (MU) $661.92
* (INTC) $111.61
Position: Short SPY (VS), QQQ (VS), AMD (VS), MU (VS), INTC (VS)
BY Doug Kass · May 8, 2026, 5:55 AM EDT
* As futures fell by about -40 handles in the after market...
Dougie Kass
At the sounds of firing in the Strait, futures lower.
Covering some Indices (moving from small to very small sized) at 555PM:
SPY $728.61 QQQ $691.01
From right after the close:
On the run off higher after the close, I'm back shorting the indices:
* (SPY) $732.15
* (QQQ) $696.82
Position: Short SPY (S), QQQ (S)
BY Doug Kass · May 7, 2026, 4:10 PM EDT
Position: Short SPY (VS), QQQ (VS)
BY Doug Kass · May 8, 2026, 5:45 AM EDT
The embedded tweet could not be found…
Bye bye Big Tech buybacks. Says Goldman Sachs: "The hyperscalers now allocate 20% of total spending to buybacks and dividends compared with an average of 34% from 2017-2022. We expect minimal hyperscaler buyback growth through 2027. Consensus estimates show hyperscaler capex Show more

Wall Street’s rebound since late March has been driven by the smallest number of stocks on record, pushing US market concentration to an all-time high-FT

‼️The US stock market has almost never been this expensive in 150 years of data: The P/E10 ratio is currently at 37.9, the 2nd highest reading in history, surpassed only by the March 2000 Dot-Com peak of 44.2. This measures stock prices against the average of 10 years of Show more

Two weeks ago, Paul Tudor Jones was sounding the alarm. He went on record saying the U.S. stock market is at 252% of GDP, a level that makes 1929's peak of 65% and the dot com era's 170% look mild by comparison. His message was if we mean revert to historical P/E multiples, Show more
Paul Tudor Jones just went on CNBC and said three words that matter: "I bought more." This is the man who called Black Monday in 1987, who has run his fund for 46 years and who currently manages over $83 billion. When he buys, it's worth understanding why. His thesis was
The embedded tweet could not be found…
‼️Big Tech cash is disappearing at a RAPID PACE: Combined free cash flow across Microsoft, Alphabet, Amazon, Meta, and Oracle is projected to FALL more than -70%, to ~$100 billion, by the end of 2026. This figure peaked at ~$250 billion in early 2024, even as trailing net Show more


Morgan Stanley sees capital spending by the five largest AI hyperscalers topping $800 billion this year and $1.1 trillion next year. At 3.3% of gross domestic product, next year’s figure would exceed projected spending on national defense. wsj.com/tech/ai/ai-is-…

AI is driving US economic growth: Investment in software and IT equipment contributed +134 basis points to Q1 2026 GDP growth of 2.0%, the largest quarterly contribution in history. This means that 67% of last quarter's economic growth was driven by AI. To put this Show more

Just five companies - Alphabet, Nvidia, Amazon, Broadcom and Apple - have accounted for half of the S&P 500's growth since April. ft.com/content/7599af…

The market just did something it has literally NEVER done before. The S&P 500 traded $2.6 trillion in call options yesterday. The highest single day call volume in market history. When traders buy massive amounts of calls, the market makers selling those calls are forced to Show more

🚨 Something very unusual just happened. Someone purchased an insane amount of VIX calls. In other words, a big player is betting the market will crash soon and he's doing it with a lot of money. Nobody drops millions on VIX calls unless they know something we don’t. VIX

