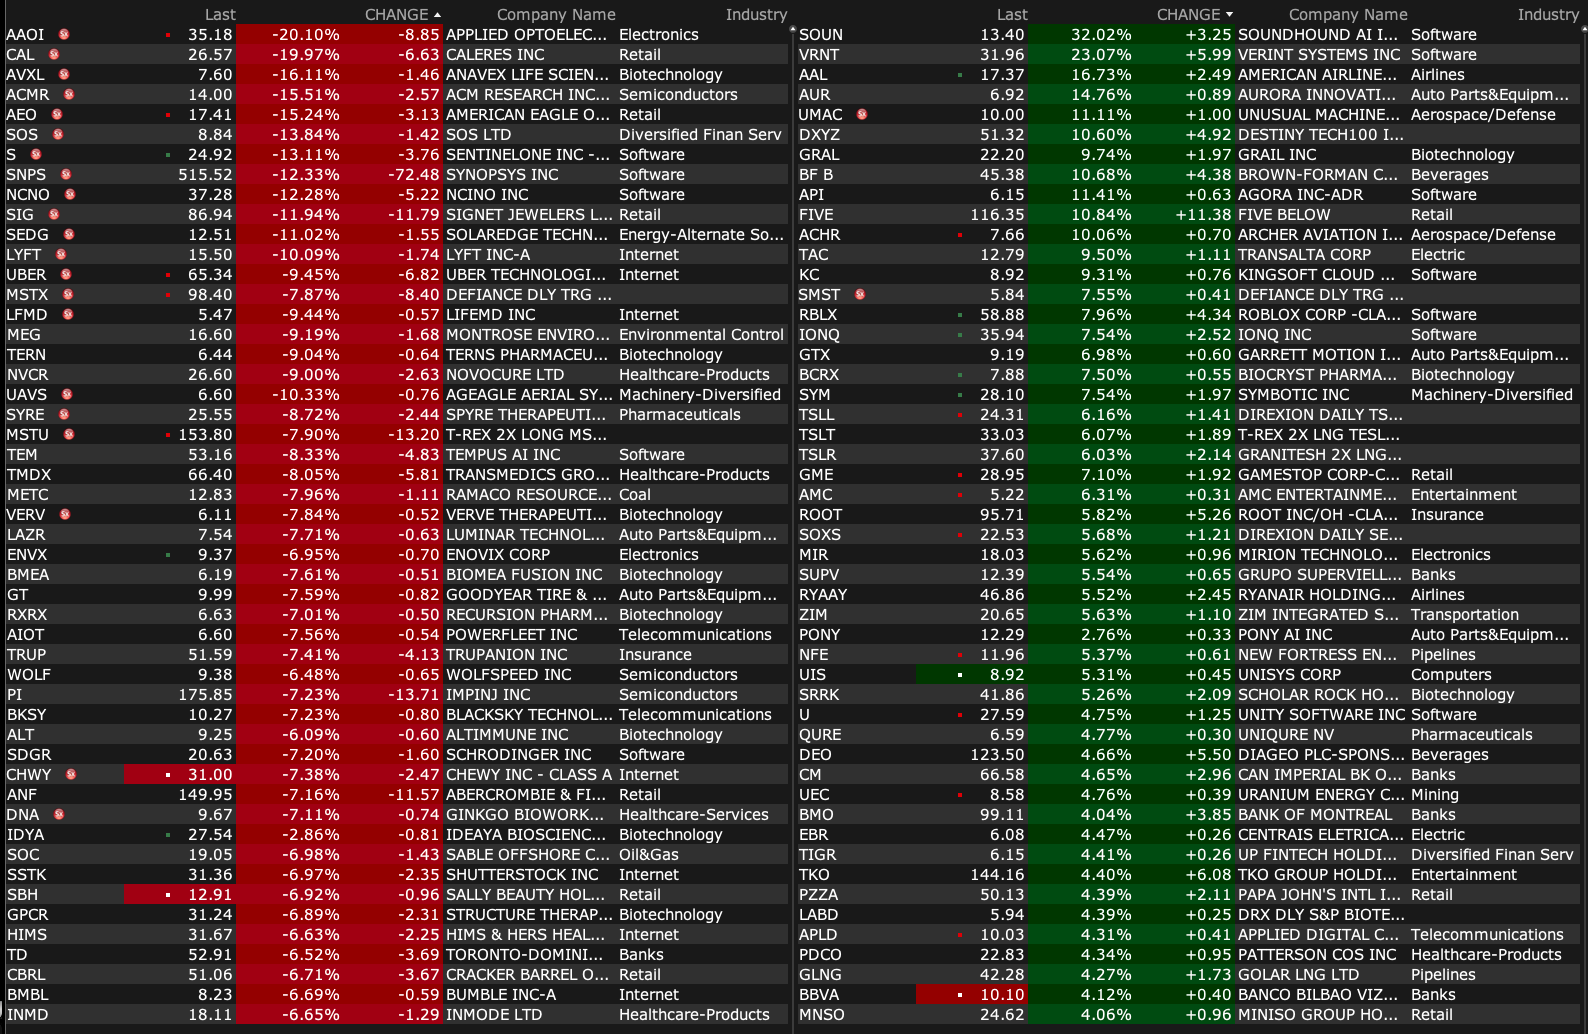
Thursday's After-Hours Movers
As of 4:19 p.m.:
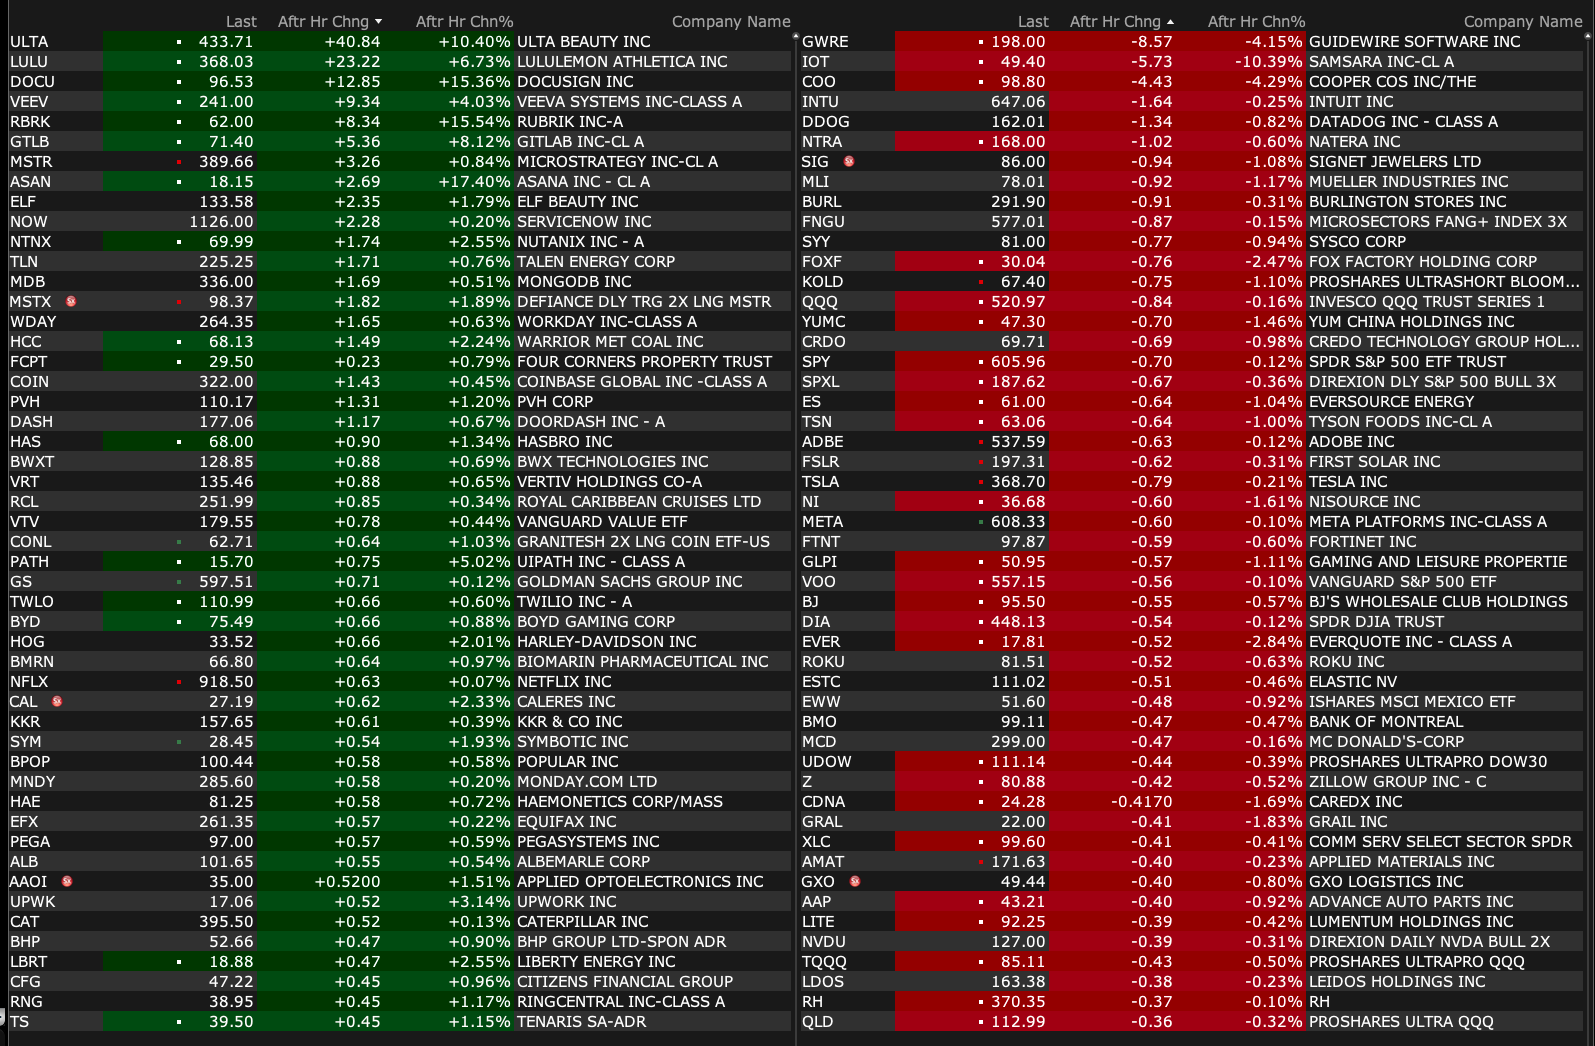
BY Doug Kass · Dec 5, 2024, 5:15 PM EST
As of 4:19 p.m.:
BY Doug Kass · Dec 5, 2024, 5:15 PM EST
BY Doug Kass · Dec 5, 2024, 5:09 PM EST
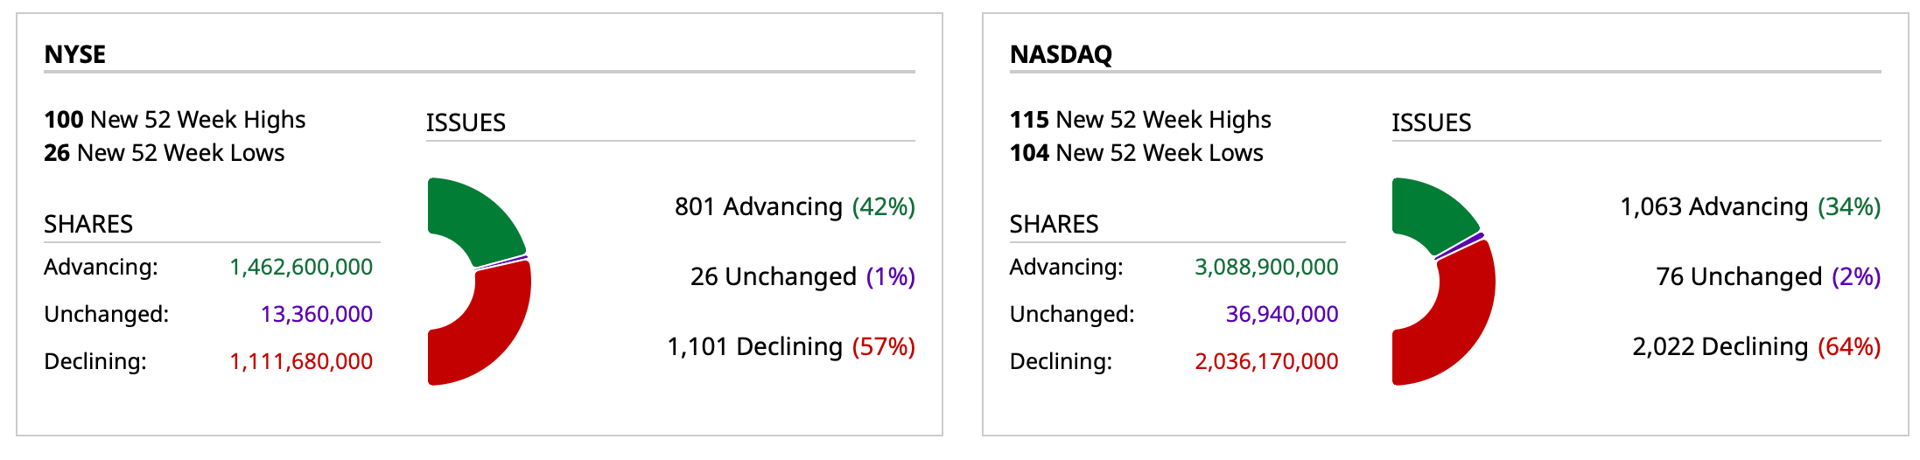
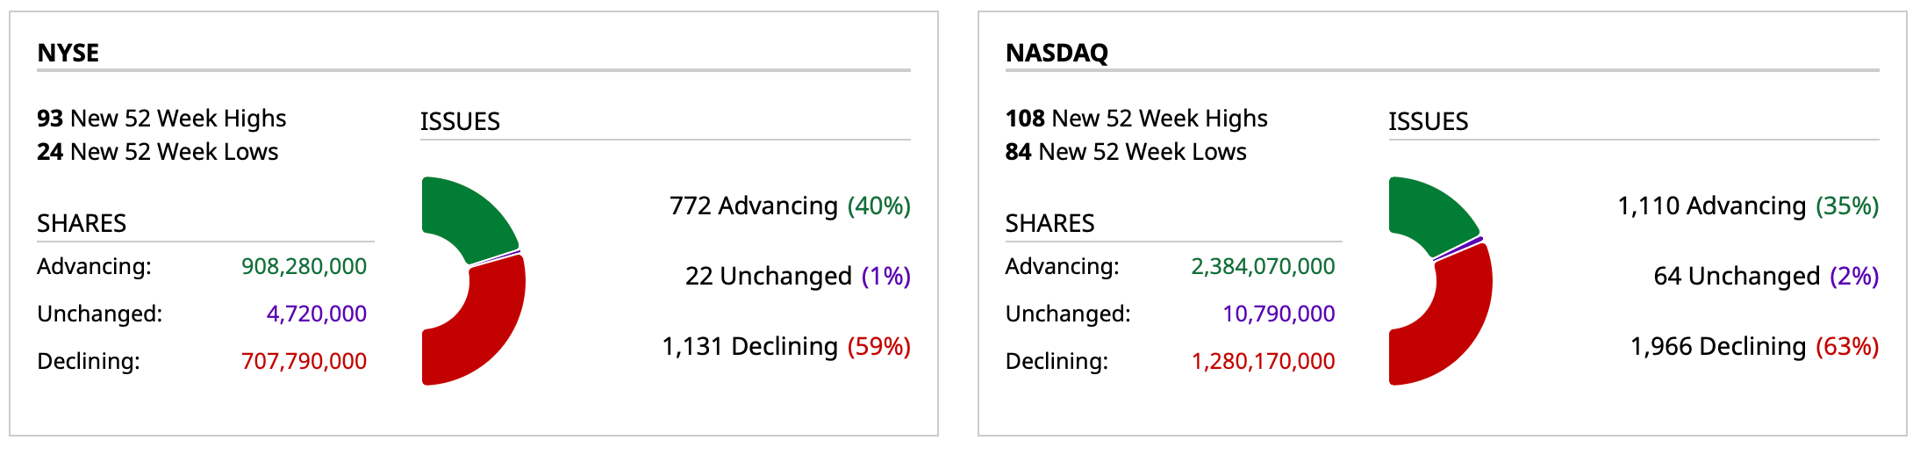
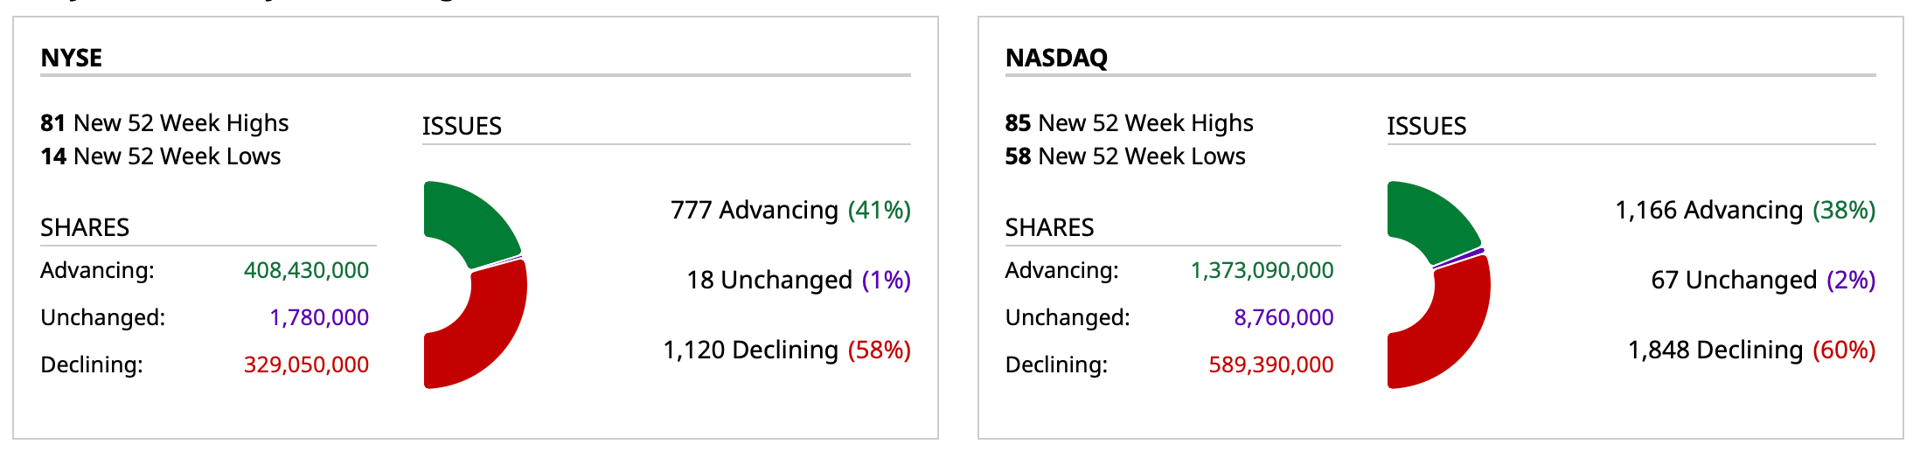
- NYSE volume 5% below its one-month average.
- NASDAQ volume 1% below its one-month average.
BY Doug Kass · Dec 5, 2024, 5:02 PM EST
No trades since my last post.
Enjoy the evening and weekend.
See you back here Monday.
BY Doug Kass · Dec 5, 2024, 4:00 PM EST
BY Doug Kass · Dec 5, 2024, 1:58 PM EST
BY Doug Kass · Dec 5, 2024, 11:57 AM EST
From Peter Boockvar:
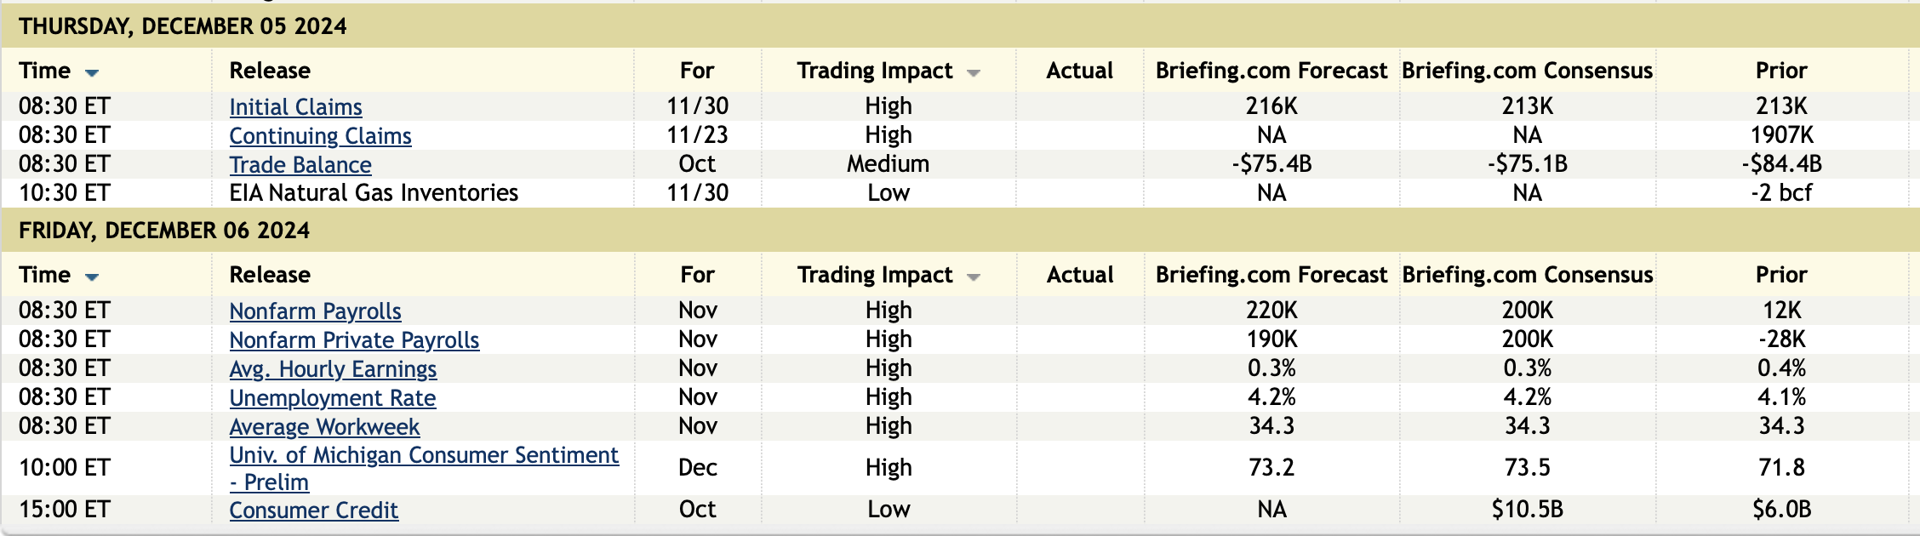
Claims data and the Challenger report
Initial jobless claims rose to 224k from 215k and that was 9k more than expected and last week was revised up by 2k. Around the holidays is a always a quirk with this data so I won’t make anything of the lift. Continuing claims, delayed by a week but also subject to seasonal issues depending on the timing of Thanksgiving (early last year, latter this year), totaled 1.871mm which is down from a revised 1.896mm in the week before which was just below the highest since November 2021.
Bottom line, putting aside the holiday seasonal adjustment issues, the level of firing’s as measured here is low but the rate of hiring’s has certainly moderated.
Challenger had an opinion on this too today with the release of their November data and they reported a lift in job cuts and still muted hiring’s. They saw a 3.8% sequential rise in job cuts and higher by 27% y/o/y. They said “November saw downstream cuts to Automotive suppliers and parts manufacturers, as well as ongoing cuts in Consumer and Industrial Manufacturing. Technology also saw a high number of layoff announcements, as that sector continues to undergo significant changes.”
On the hiring side, “US employers have announced 761,954 hiring plans, down 2% from the 777,101 plans recorded through November last year.” And this year to date total is the lowest since 2015.
BY Doug Kass · Dec 5, 2024, 11:12 AM EST
I will be out of the office most of the afternoon - so my posts will be infrequent and shorter.
BY Doug Kass · Dec 5, 2024, 10:58 AM EST
* The entirety of the recent four-week market advance has been based on an expansion in price earnings multiples.
* As narratives multiply and fear/doubt disappear, guards and disciplines are dropped with many asset classes at all-time highs.
* But as asset prices rise, diligence and the assessment of reward vs. risk should take on greater irrelevance - unfortunately just the opposite is occurring.
* And so should the concept of "a margin of safety" be evermore embraced - as it is an essential and integral ingredient to investing over a "market cycle."
* As the late but great Sir Arthur Cashin would often write - in the current euphoria - one should pay strict heed to Bob Farrell's "Lessons of Investing."
* Expect the unexpected...in the corners of leverage and those that are endorsing the narrative of a "new paradigm" (of higher valuations).
"What the wise man does in the beginning, the fool does in the end."
- Warren Buffett
"A bull market is like sex, it feels best just before it ends."
- Barton Biggs
Over history, market inflection points and economic dislocations often come from places not anticipated. Indeed, the most important turning points in markets (and in life) often come at the most unexpected times and in the most unexpected ways. In particular, leverage, as proven by history, is often uncovered in unexpected places. Think about the collapse of a generally unknown currency, the Thai Bhat that gripped Asia in 1997 and then spread to other countries (with a ripple effect), raising fears of a financial contagion and a worldwide economic meltdown. Or the failure of the highly leveraged (and formerly successful) Long Term Capital hedge fund (managed by several Nobel Prize winners in economics) in the following year -- which was, in part precipitated by the Russian Debt crisis in 1998 and required a multi billion dollar bailout by 14 banks (orchestrated by The New York Federal Reserve). But the best example of hidden leverage (where no one was looking) was seen in The Great Financial Crisis of 2007-09 when one overleveraged segment, real estate, proved to be the Achilles Heel for the global economy.
Indeed, what started out as what many believed to be only a few California mortgages under water, multiplied geometrically and almost bankrupted our worldwide financial system -- as the layers of leverage were swiftly uncovered and spread rapidly. This morning's market commentary will highlight several significant market (and economic) risks that are not regularly discussed.
The "failure" or combustion of any of these factors could have a most adverse impact on equities and on the domestic economy.
* The U.S. economy has never been more levered to the U.S. stock market. Indeed, one can argue that -- with household ownership of equities at an all-time high, with a chorus of "its different this time" and with dreams of a new investing paradigm (of higher valuations) dominating the narrative. As discussed below, it is almost as if the domestic economy is being collateralized by a foundation asset, equities.
From Tom Dyson:
The US stock market is such a foundational asset. You could say, the US stock market has become the collateral that backs the world economy, and all its debt. As long as the stock market keeps rising, everything’ll be okay. But as soon as it turns down, things will start breaking. Employment, real estate values, consumption, trade… and even the government’s finances. It’s the wealth effect, when the stock market is such an important store of wealth. They all rely on a strong stock market to function. The fact that the world’s prosperity has one single point of failure – even as it rises day after day – should terrify you. The market’s function should be to allocate scarce capital efficiently… not collateralise the entire system. In effect, it’s become too big to fail, which is an acute fragility for our capitalist system. As allocators of capital ourselves, how should we approach our investment discipline in a market where expectations (and stock market values) are literally “off the charts”? The bears say "every other time this has happened, there's been a big wreck." The bulls say "this time is different, and besides, the trend is your friend and getting the timing wrong is the same as being wrong."What do you do? Neither position is falsifiable. Which means there is no way to figure out the correct answer with logic… or research… or data. So it comes down to philosophy. Are you a contrarian? Or are you a trend-follower?... The global debt stock surged by over $12 trillion in the first three quarters of 2024 to a record high of nearly $323 trillion. It’s a huge wealth bubble and when it pops, $400 trillion or $500 trillion of (mostly) paper claims ($323 trillion in debt plus whatever owners’ equity the system has) will rush for the exits and seek safety. And policy makers won’t be able to stop it.
* Elon Musk's health and business/innovative successes are critical to a continuation of economic growth and stock market gains. Musk's broad reach -- on the road, under ground, in space, over the internet, in defense, in artificial intelligence -- has now advanced into Washington, and in the formulation and implementation of policy. To have one person so immersed and involved in all these critical areas could pose broad risks -- in many ways.
* An extremely leveraged cryptocurrency market represents potential systemic risks. It is my view that cryptocurrency is "the mother of all bubbles" perpetuated by a number of factors (including the rejection of fiat money) and developing digital narratives -- many of which have a weak foundation of logic. The absurd notion that the limiting of supply of bitcoin is as stupid as it is damning -- as there is no limit to the supply of other cryptocurrencies. To this observer, the sheet market size of bitcoin and other cryptocurrencies is a manifestation of the risks.
See: Crypto Market Cap Charts | CoinGecko
And, as I have written, MicroStratetgy MSTR (with its "math" in expressing the case of buying $1 bills for $3 and MSTR's multiple derivative plays), is the standard bearer of the digital speculation today. See: TheStreet Pro
When the cryptocurrency markets implodes, which is my baseline expectation, the contagion effect will likely be pronounced on all of the capital markets.
* Both fiscal and monetary policy - which is needed to secure the foundation of growth -- are travesties. Neither political party has been fiscally responsible -- the profligate spending over the last few decades continues apace. (I do not, in any way, buy Elon Musk's objective of cutting $2 trillion from the U.S. budget, as when you go over the numbers only about $1.5 trillion can be cut (and that is if one cut all that was "available" to be cut in total). As well, the Federal Reserve has been guilty of reckless, feckless and fatuous policy in its delayed response to inflation and, then, in effecting a rapid rise in interest rates. I have little confidence in Powell's Fed steering clear of debris in his remaining time at that institution. Nor am I confident in any Fed chairman that might replace him.
* Changing market structure poses a significant market risk. Passive investing has engulfed the stock market landscape. We are all traders now, on the same side of the boat and worshipping at the altar of price momentum. (See the first bullet point!) Massive inflows into passive strategies and products have been the straw that has stirred the market's drink:
In part, those inflows, have contributed to a near unprecedented narrowing in the equity risk premium (to 20-year lows) while the risk to earnings growth are at 20-year highs:
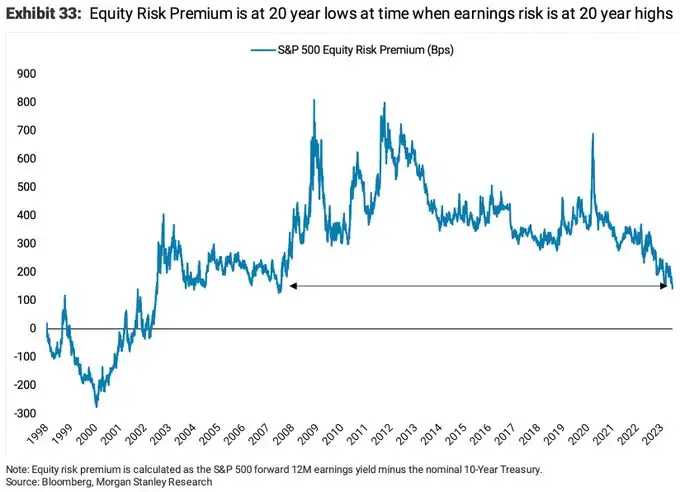
I can guarantee you (and history has proven) that these inflows - as well as FOMO and the animal spirits - will not be permanent conditions.
"We must stop regarding unpleasant or unexpected things as interruptions of real life. The truth is that interruptions are real life."- C.S. Lewis
The history of speculation is that it resides in areas that are rationalized (with broadening acceptance of a new paradigm).
It is also the condition of history that it is fueled by leverage and lasts longer than most expect. But excesses are never permanent. They become ever more dangerous when markets are consumed with optimism, are no longer fearful and are levered up.
To end today's opening missive, it is now time to pay heed to Bob Farrell's ten rules of investing (Sir Arthur Cashin would want it this way):
Markets tend to return to the mean over time.
Translation: Trends that get overextended in one direction or another return to their long-term average. Even during a strong uptrend or strong downtrend, prices often move back (revert) to a long-term moving average. The chart below shows the S&P 500 over a 15-year period with a 52-week exponential moving average. The blue arrows show several reversions back to this moving average in both uptrends and downtrends. The indicator window shows the Percent Price Oscillator (1,52,1) reverting back to the zero line.
Excesses in one direction will lead to an opposite excess in the other direction.
Translation: Markets that overshoot on the upside will also overshoot on the downside, kind of like a pendulum. The further it swings to one side, the further it rebounds to the other side. The chart below shows the Nasdaq bubble in 1999 and the Percent Price Oscillator (52,1,1) moving above 40%. This means the Nasdaq was over 40% above its 52-week moving average and way overextended. This excess gave way to a similar excess when the Nasdaq plunged in 2000-2001 and the Percent Price Oscillator moved below -40%.
There are no new eras -- excesses are never permanent.
Translation: There will be a hot group of stocks every few years, but speculation fads do not last forever. In fact, over the last 100 years we have seen speculative bubbles involving various stock groups. Autos, radio and electricity powered the roaring 20s. The nifty-fifty powered the bull market in the early 70s. Biotechs bubble up every 10 years or so and there was the dot-com bubble in the late 90s. "This time it is different" is perhaps the most dangerous phrase in investing. As Jesse Livermore puts is:
A lesson I learned early is that there is nothing new in Wall Street. There can't be because speculation is as old as the hills. Whatever happens in the stock market today has happened before and will happen again.
Exponential rapidly rising or falling markets usually go further than you think, but they do not correct by going sideways.
Translation: Even though a hot group will ultimately revert back to the mean, a strong trend can extend for a long time. Once this trend ends, however, the correction tends to be sharp. The chart below shows the Shanghai Composite ($SSEC) advancing from July 2005 until October 2007. This index was overbought in July 2006, early 2007 and mid 2007, but these levels did not mark a top as the trend extended with a parabolic move.
The public buys the most at the top and the least at the bottom.
Translation: The average individual investor is most bullish at market tops and most bearish at market bottoms. The survey from the American Association of Individual Investors is often cited as a barometer for investor sentiment. In theory, excessively bullish sentiment warns of a market top, while excessively bearish sentiment warns of a market bottom.
Fear and greed are stronger than long-term resolve.
Translation: Don't let emotions cloud your decisions or affect your long-term plan. Plan your trade and trade your plan. Prepare for different scenarios so you will not be taken by surprise with sharp adverse price movement. Sharp declines and losses can increase the fear factor and lead to panic decisions in the heat of battle. Similarly, sharp advances and outsized gains can lead to overconfidence and deviations from the long-term plan. To paraphrase Rudyard Kipling, you will be a much better trader or investor if you can keep your head about you when all about are losing theirs. When the emotions are running high, take a breather, step back and analyze the situation from a greater distance.
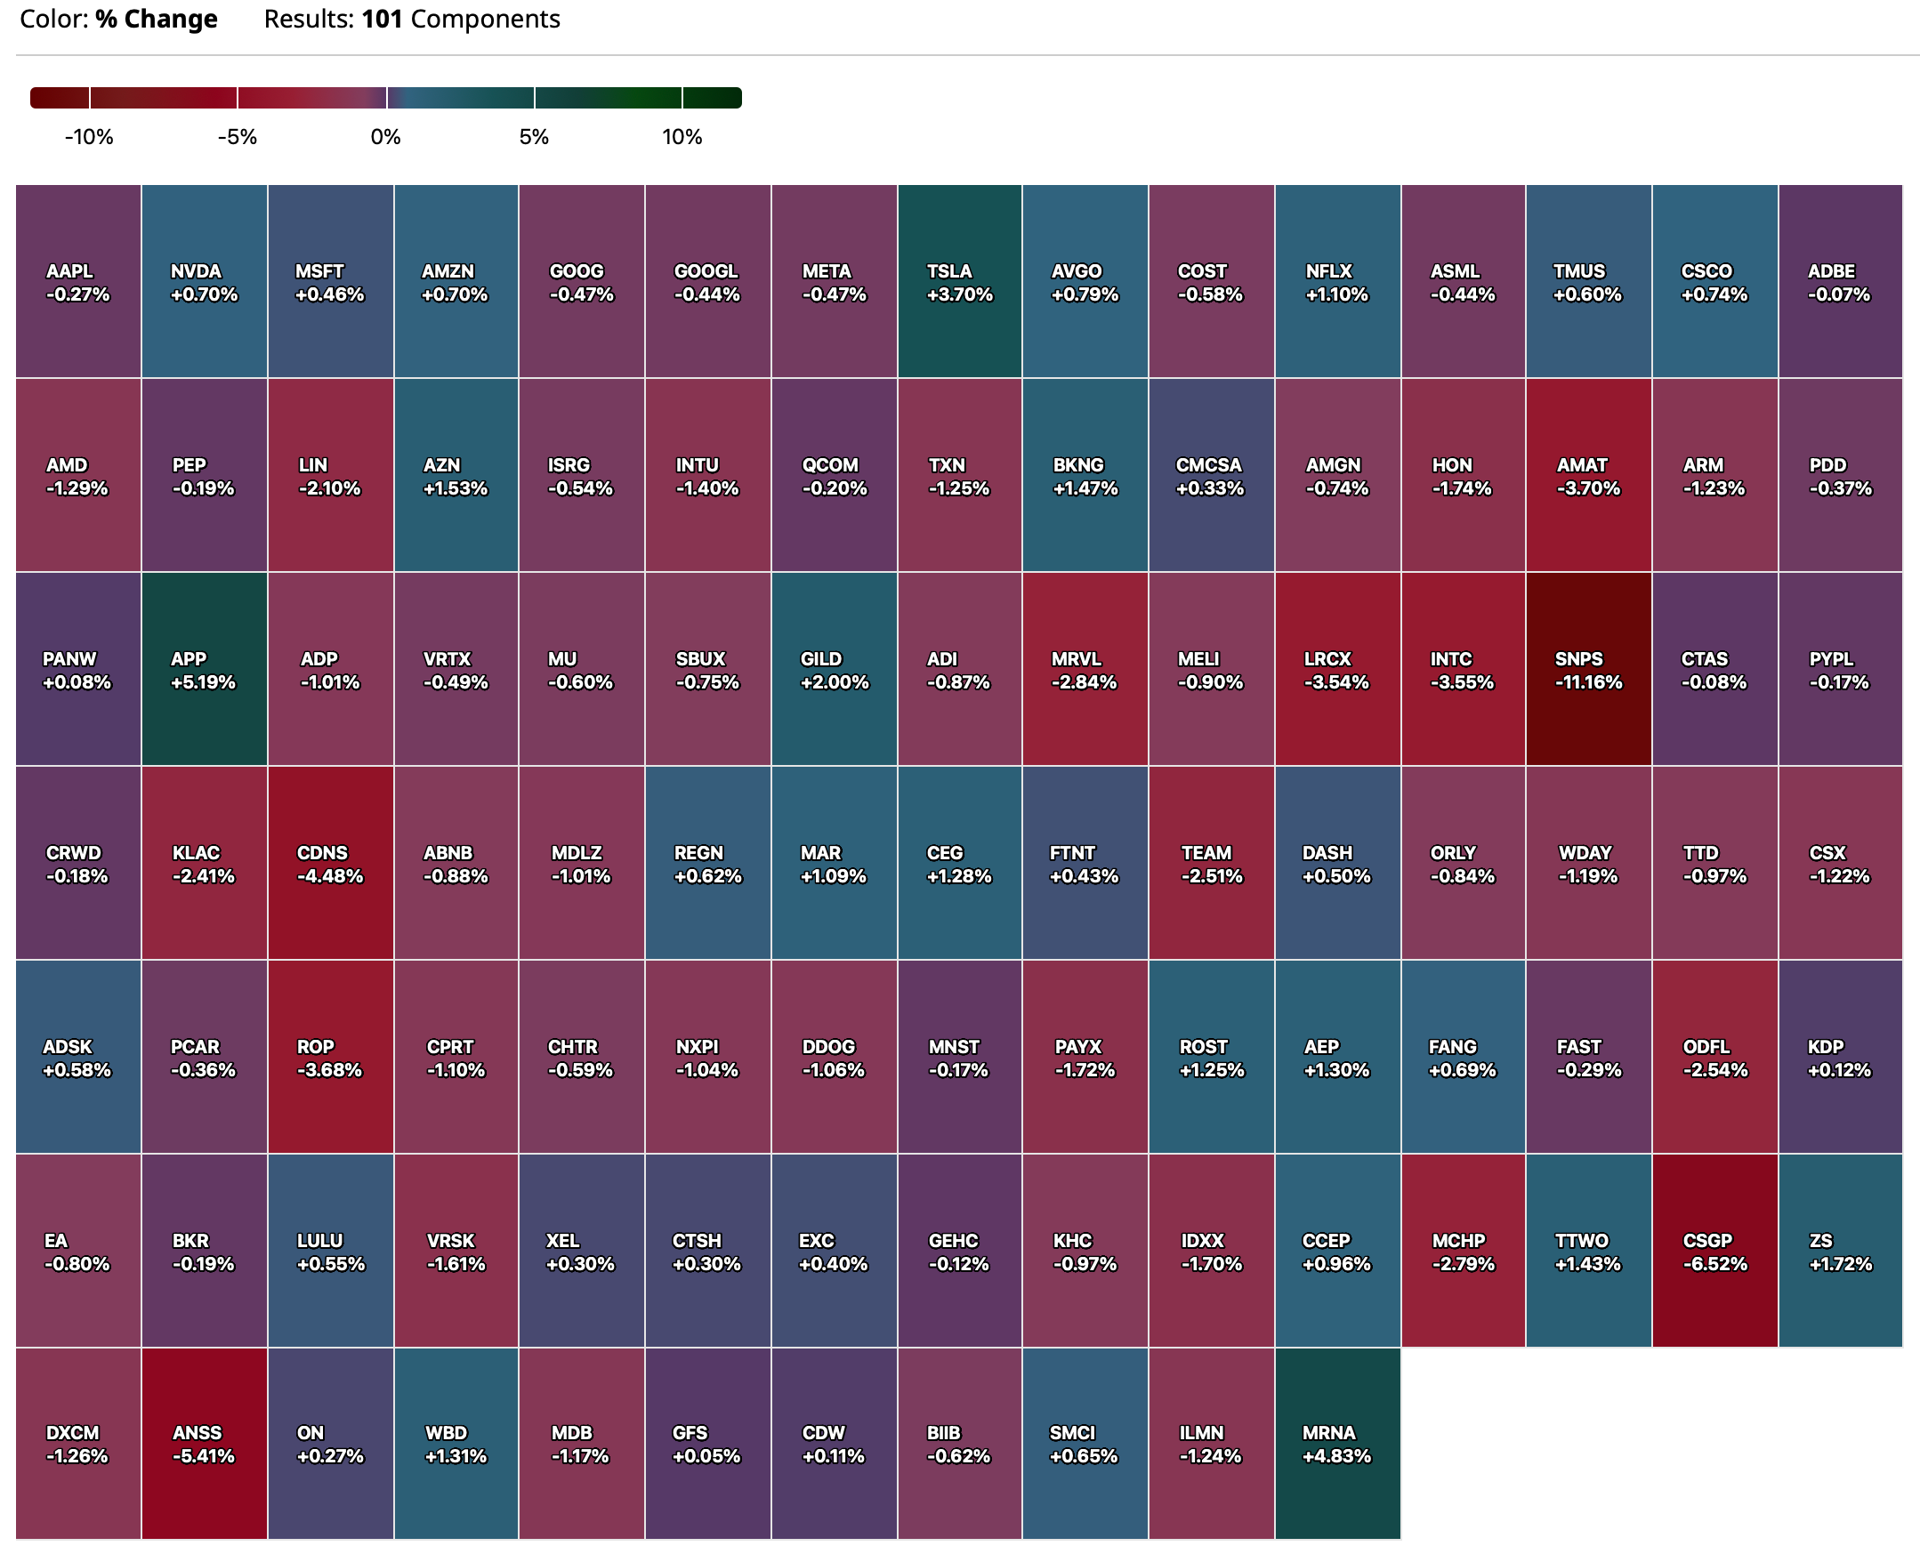
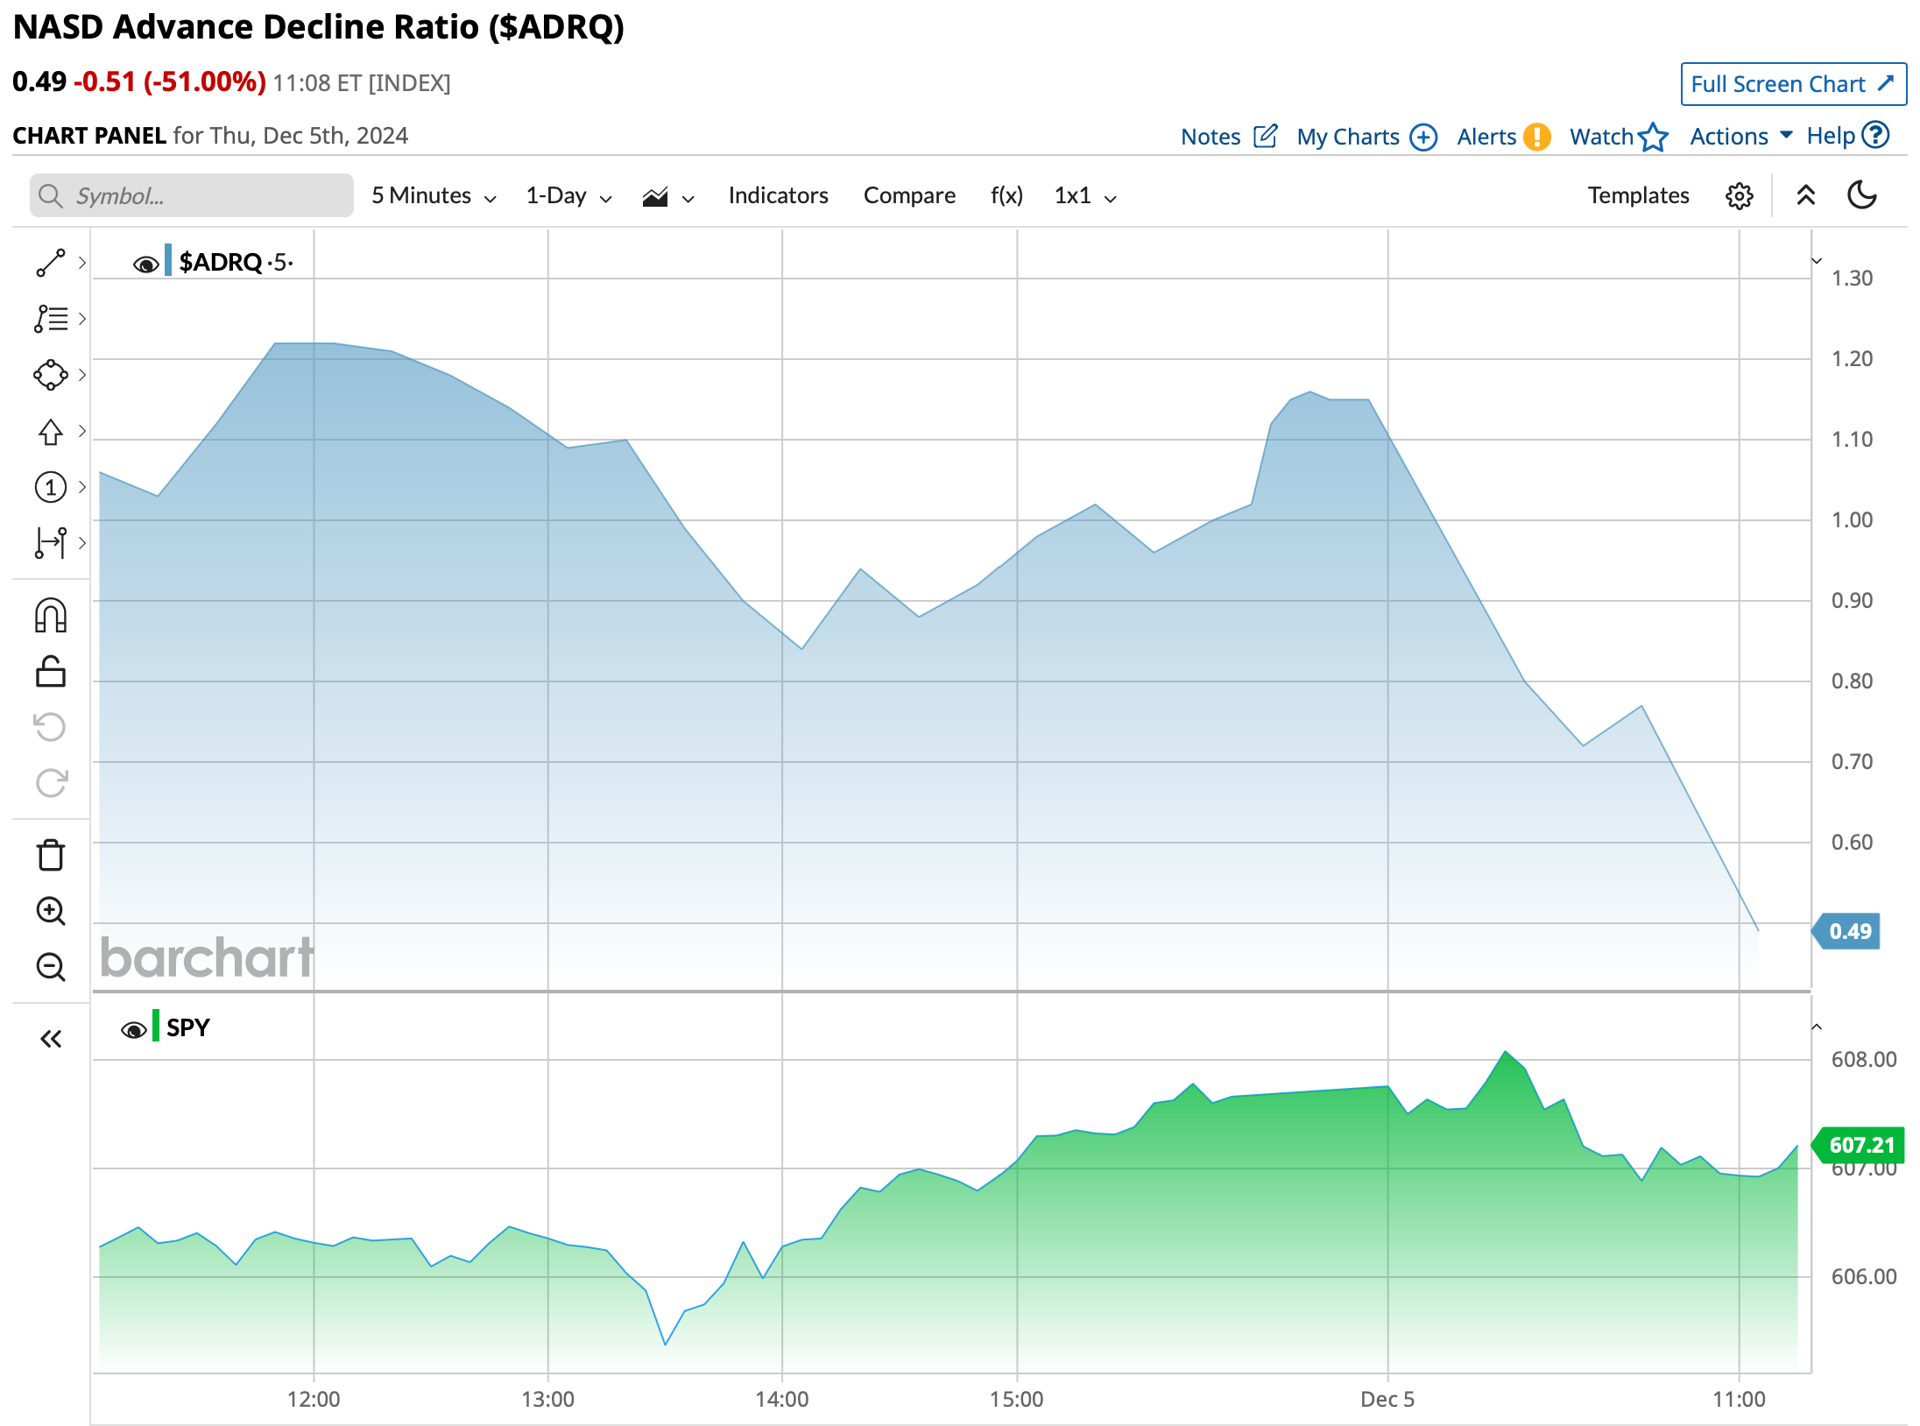
Markets are strongest when they are broad and weakest when they narrow to a handful of blue-chip names.
Translation: Breadth is important. A rally on narrow breadth indicates limited participation and the chances of failure are above average. The market cannot continue to rally with just a few large-caps (generals) leading the way. Small and mid caps (troops) must also be on board to give the rally credibility. A rally that lifts all boats indicates far-reaching strength and increases the chances of further gains.
Bear markets have three stages - sharp down, reflexive rebound and a drawn-out fundamental downtrend.
Translation: Bear markets often start with a sharp and swift decline. After this decline, there is an oversold bounce that retraces a portion of that decline. The decline then continues, but at a slower and more grinding pace as the fundamentals deteriorate. Dow Theory suggests that bear markets consists of three down legs with reflexive rebounds in between.
When all the experts and forecasts agree - something else is going to happen.
Translation: This rule fits with Farrell's contrarian streak. When all analysts have a buy rating on a stock, there is only one way left to go (downgrade). Excessive bullish sentiment from newsletter writers and analysts should be viewed as a warning sign. Investors should consider buying when stocks are unloved and the news is all bad. Conversely, investors should consider selling when stocks are the talk of the town and the news is all good. Such a contrarian investment strategy usually rewards patient investors.
Bull markets are more fun than bear markets.
Translation: Wall Street and Main Street are much more in tune with bull markets than bear markets.
BY Doug Kass · Dec 5, 2024, 10:00 AM EST
-RKDA +177% (to combine with Roosevelt Resources LP in an all-stock transaction)
-MIGI +32% (responds to recent report and clarifies Chapter 11 petition filing from Australian entities)
-VRNT +19% (earnings, guidance)
-FIVE +15% (earnings, guidance)
-PRE +11% (Prenetics’ IM8 and University of Oxford Begin Groundbreaking Space Experiment to Study Accelerated Aging and Longevity on the ISS with SpaceX, Supported by Space Applications Services)
-SBFM +9.4% (launches new prescription drug Bilastine)
-CHPT +9.0% (earnings, guidance)
-SAIC +8.1% (earnings, guidance)
-BF.B +6.8% (earnings, guidance)
-AAL +6.3% (raises guidance)
-CXM +4.4% (earnings, guidance)
-ANNX +3.7% (to present Phase 2 ARCHER Data on Protection of Vision and Photoreceptors with ANX007 in Geographic Atrophy at the Floretina-ICOOR 2024 Meeting)
-ASO +3.1% (announces new $700M share repurchase program)
-LUV +2.9% (raises guidance)
-OOMA +2.7% (earnings, guidance)
-CAL -16% (earnings, guidance)
-NCNO -16% (earnings, guidance)
-SIG -15% (earnings, guidance)
-AEO -14% (earnings, guidance)
-S -14% (earnings, guidance)
-AVAV -12% (earnings, guidance)
-SNPS -7.8% (earnings, guidance)
-FI -6.9% (confirms Fiserv Chairman, President and CEO Frank Bisignano Nominated as Commissioner of US Social Security Administration)
-LE -6.9% (earnings, guidance)
-GEF -5.2% (earnings, guidance)
-MOV -4.8% (earnings, guidance)
-KR -2.1% (earnings, guidance)
BY Doug Kass · Dec 5, 2024, 9:15 AM EST
I added to my WMT short in the premarket at $94.69 and to TSLA short at $358.39.
BY Doug Kass · Dec 5, 2024, 9:10 AM EST
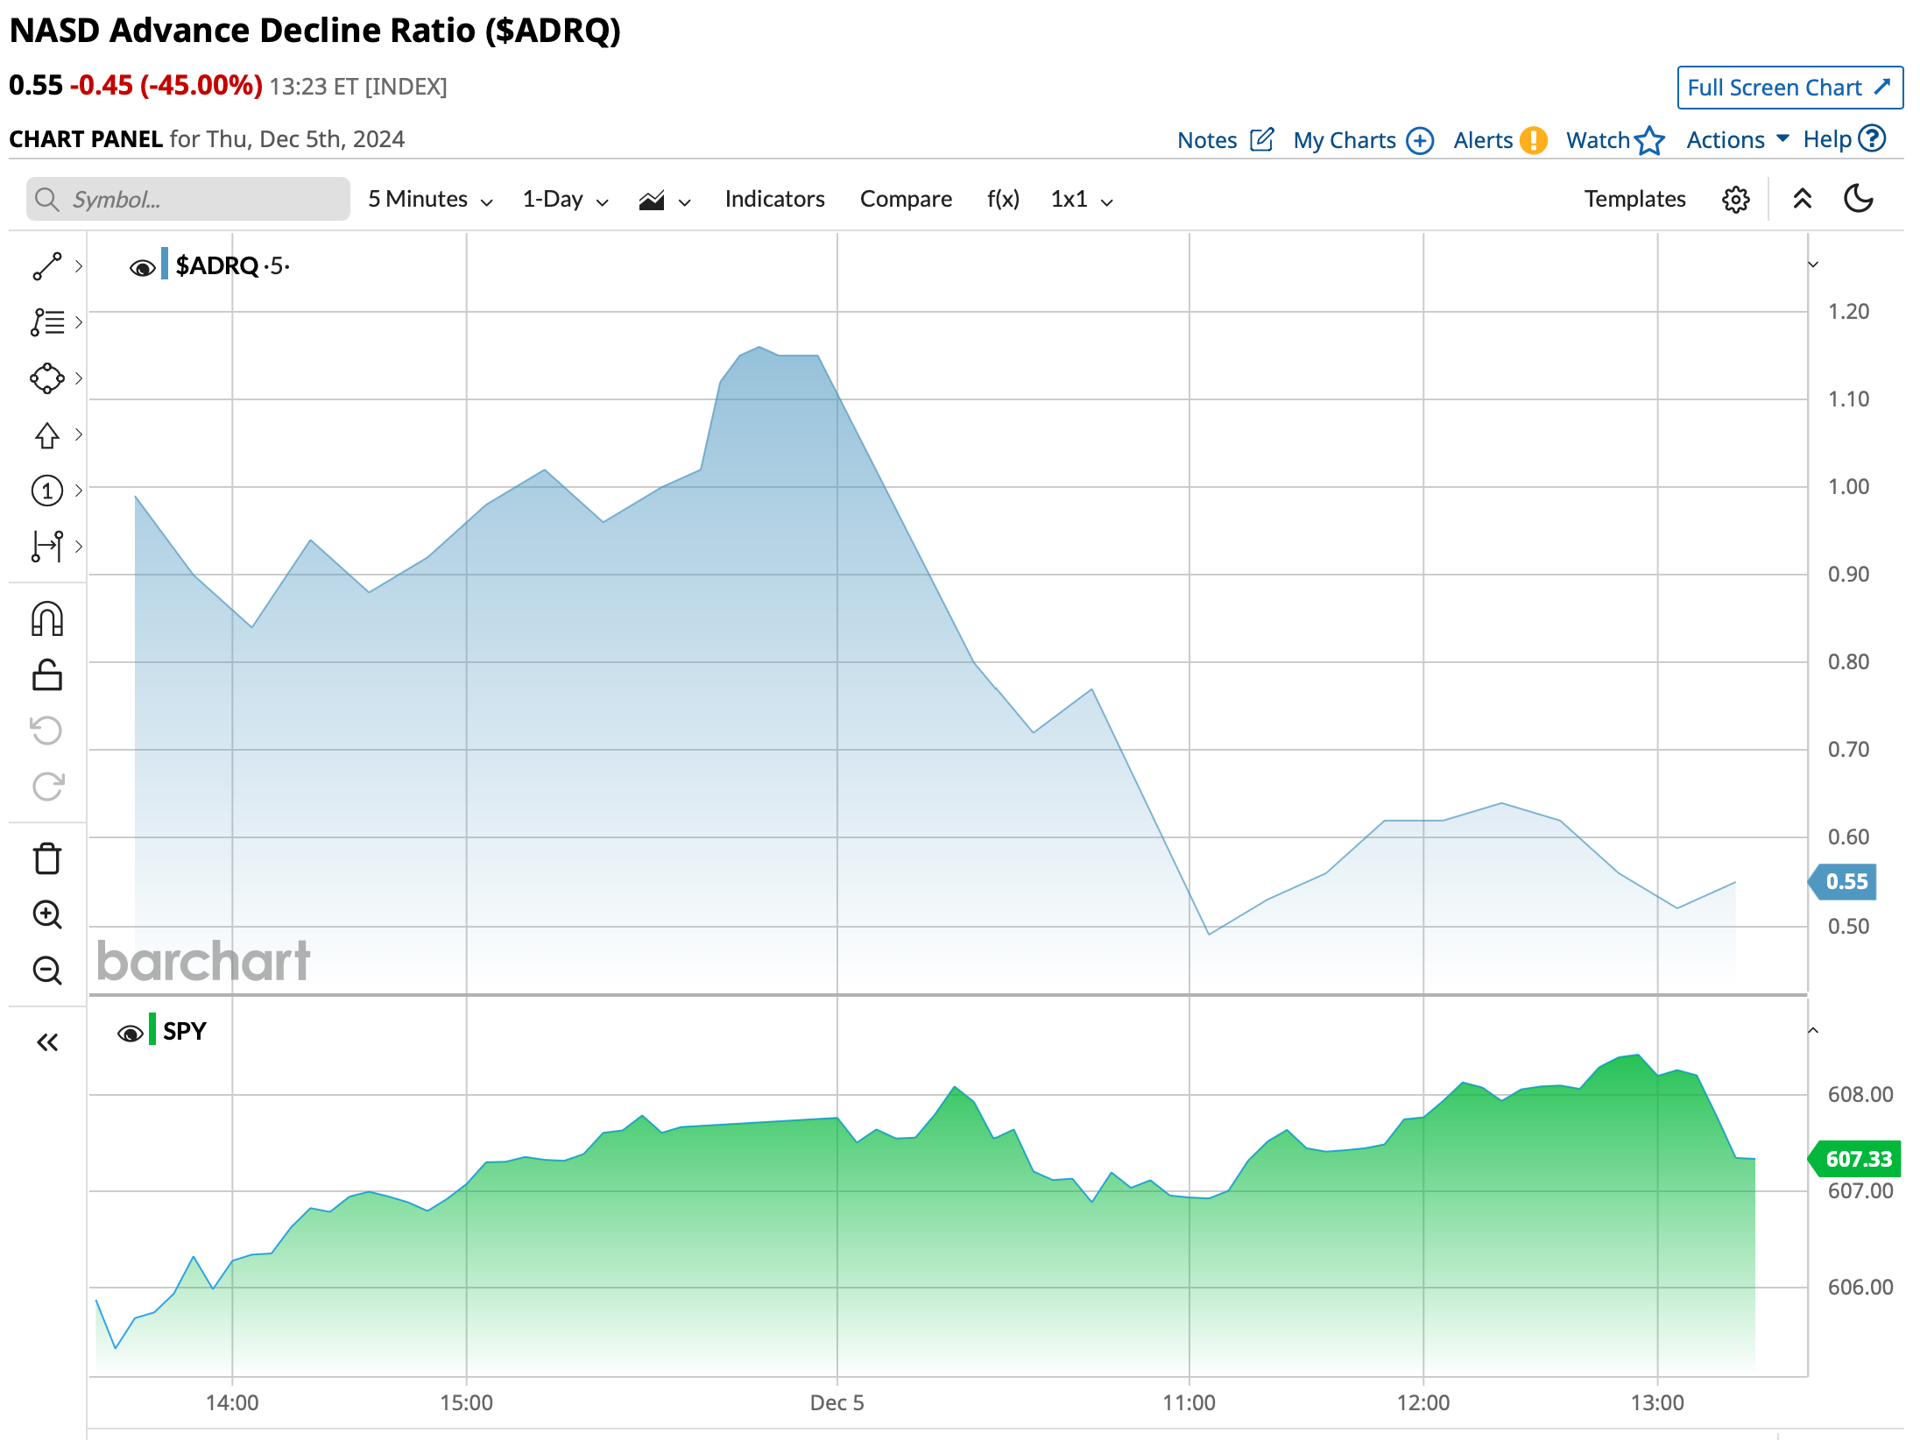
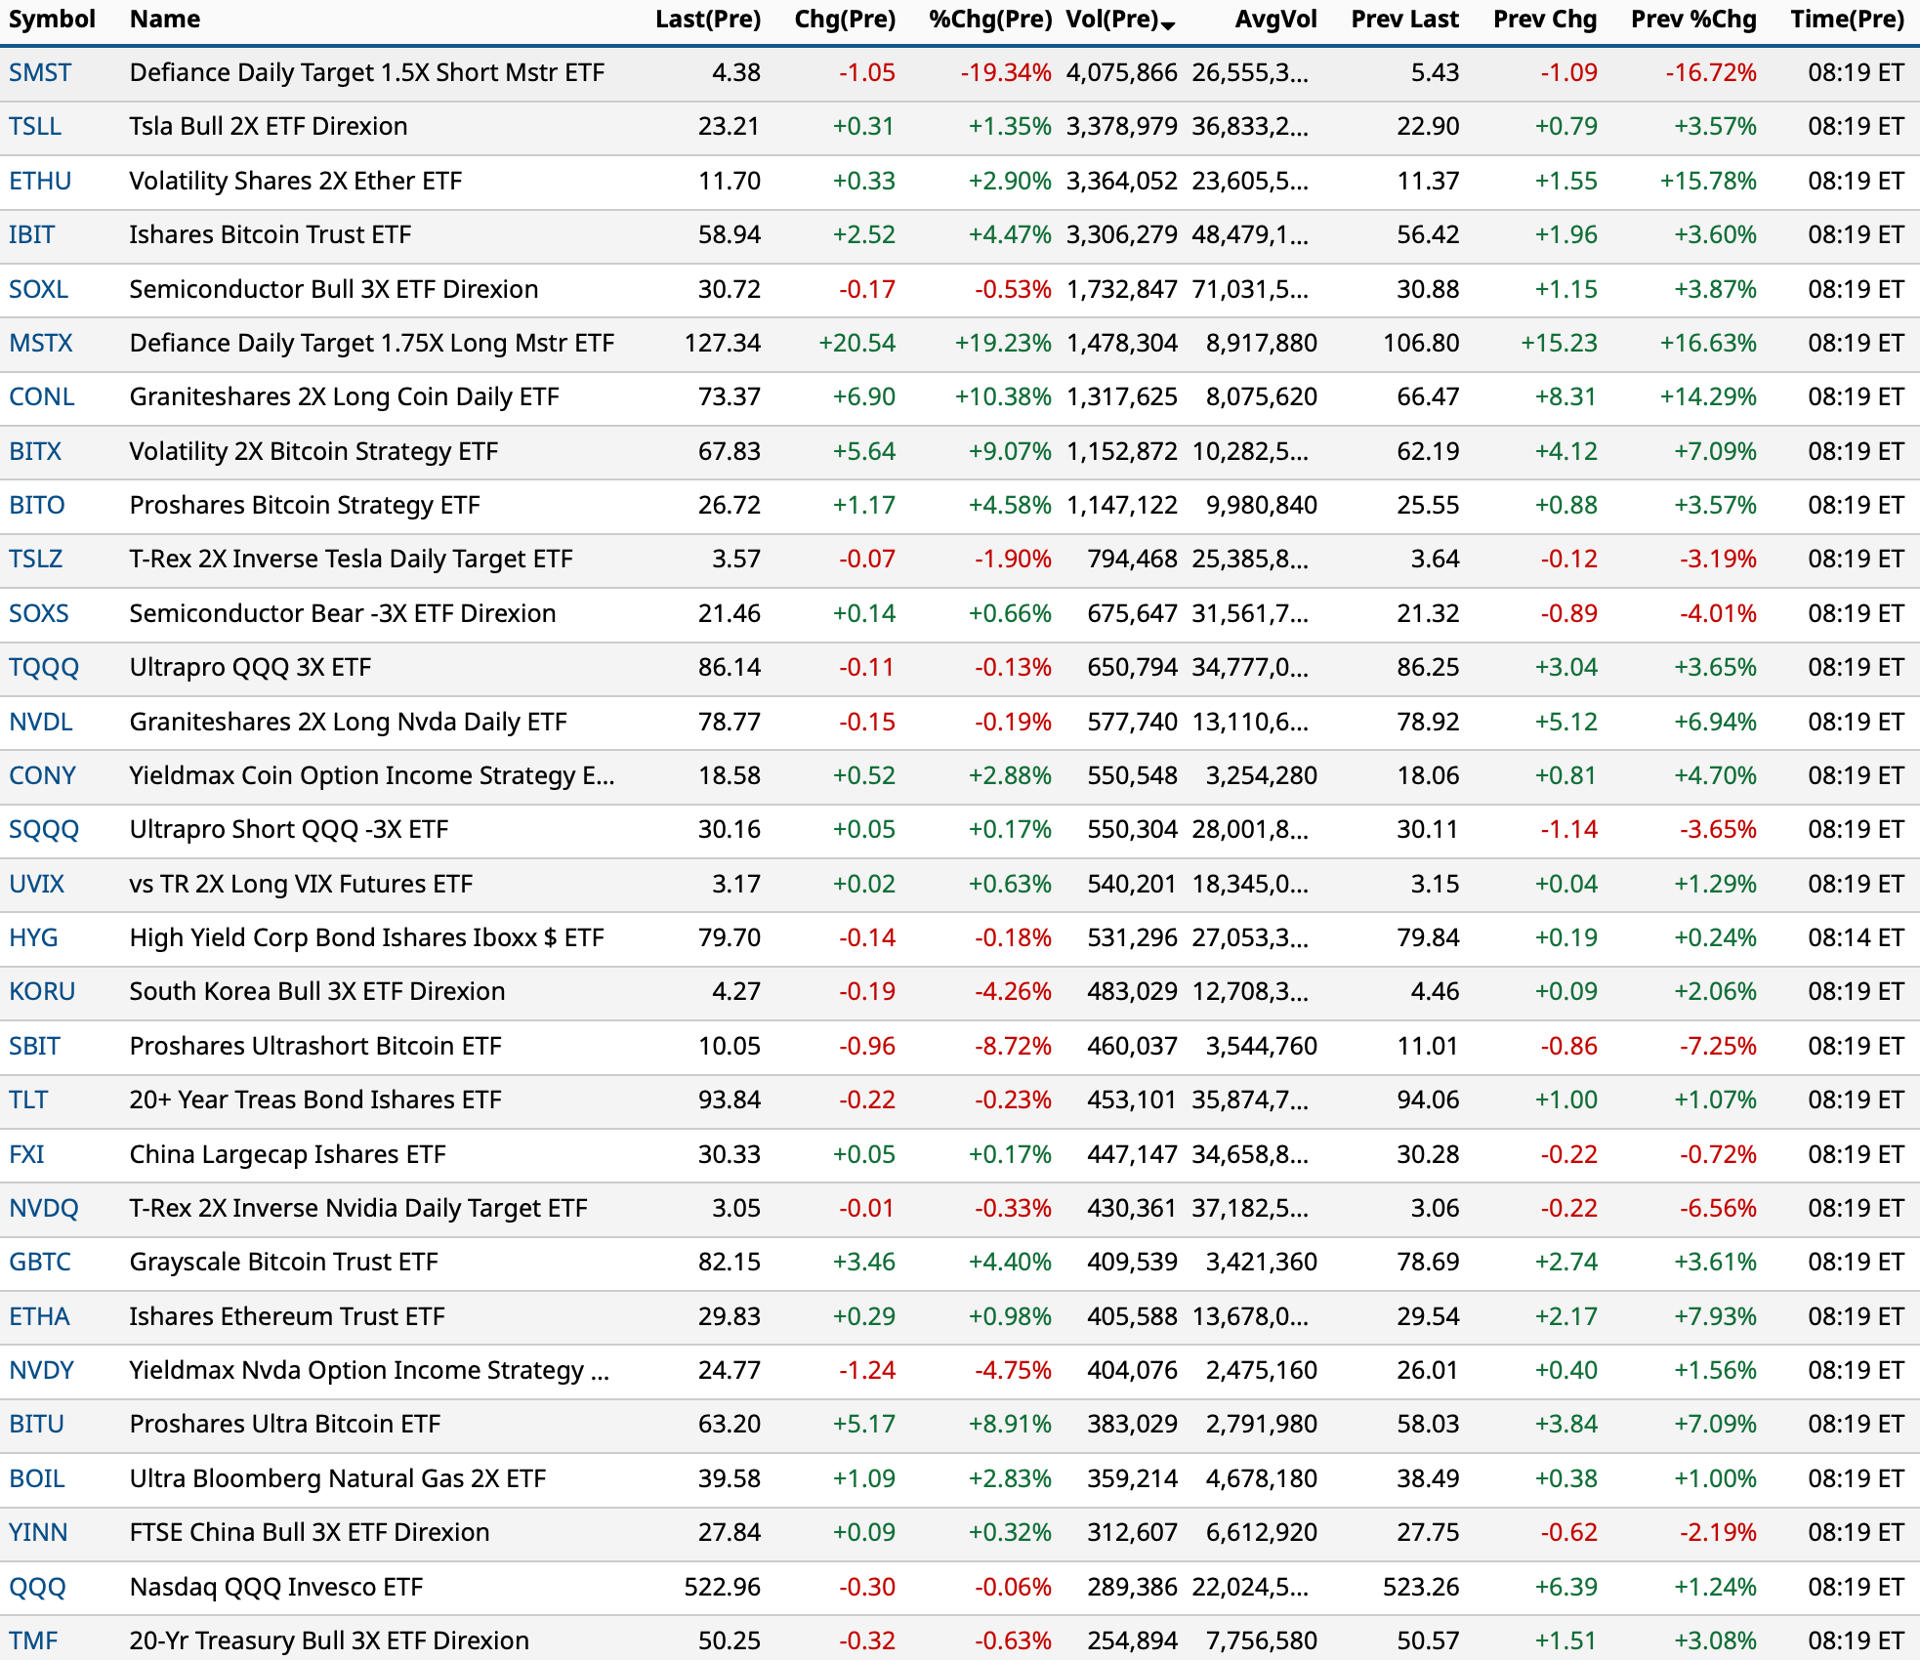
Charts from 8:19 a.m. ET:
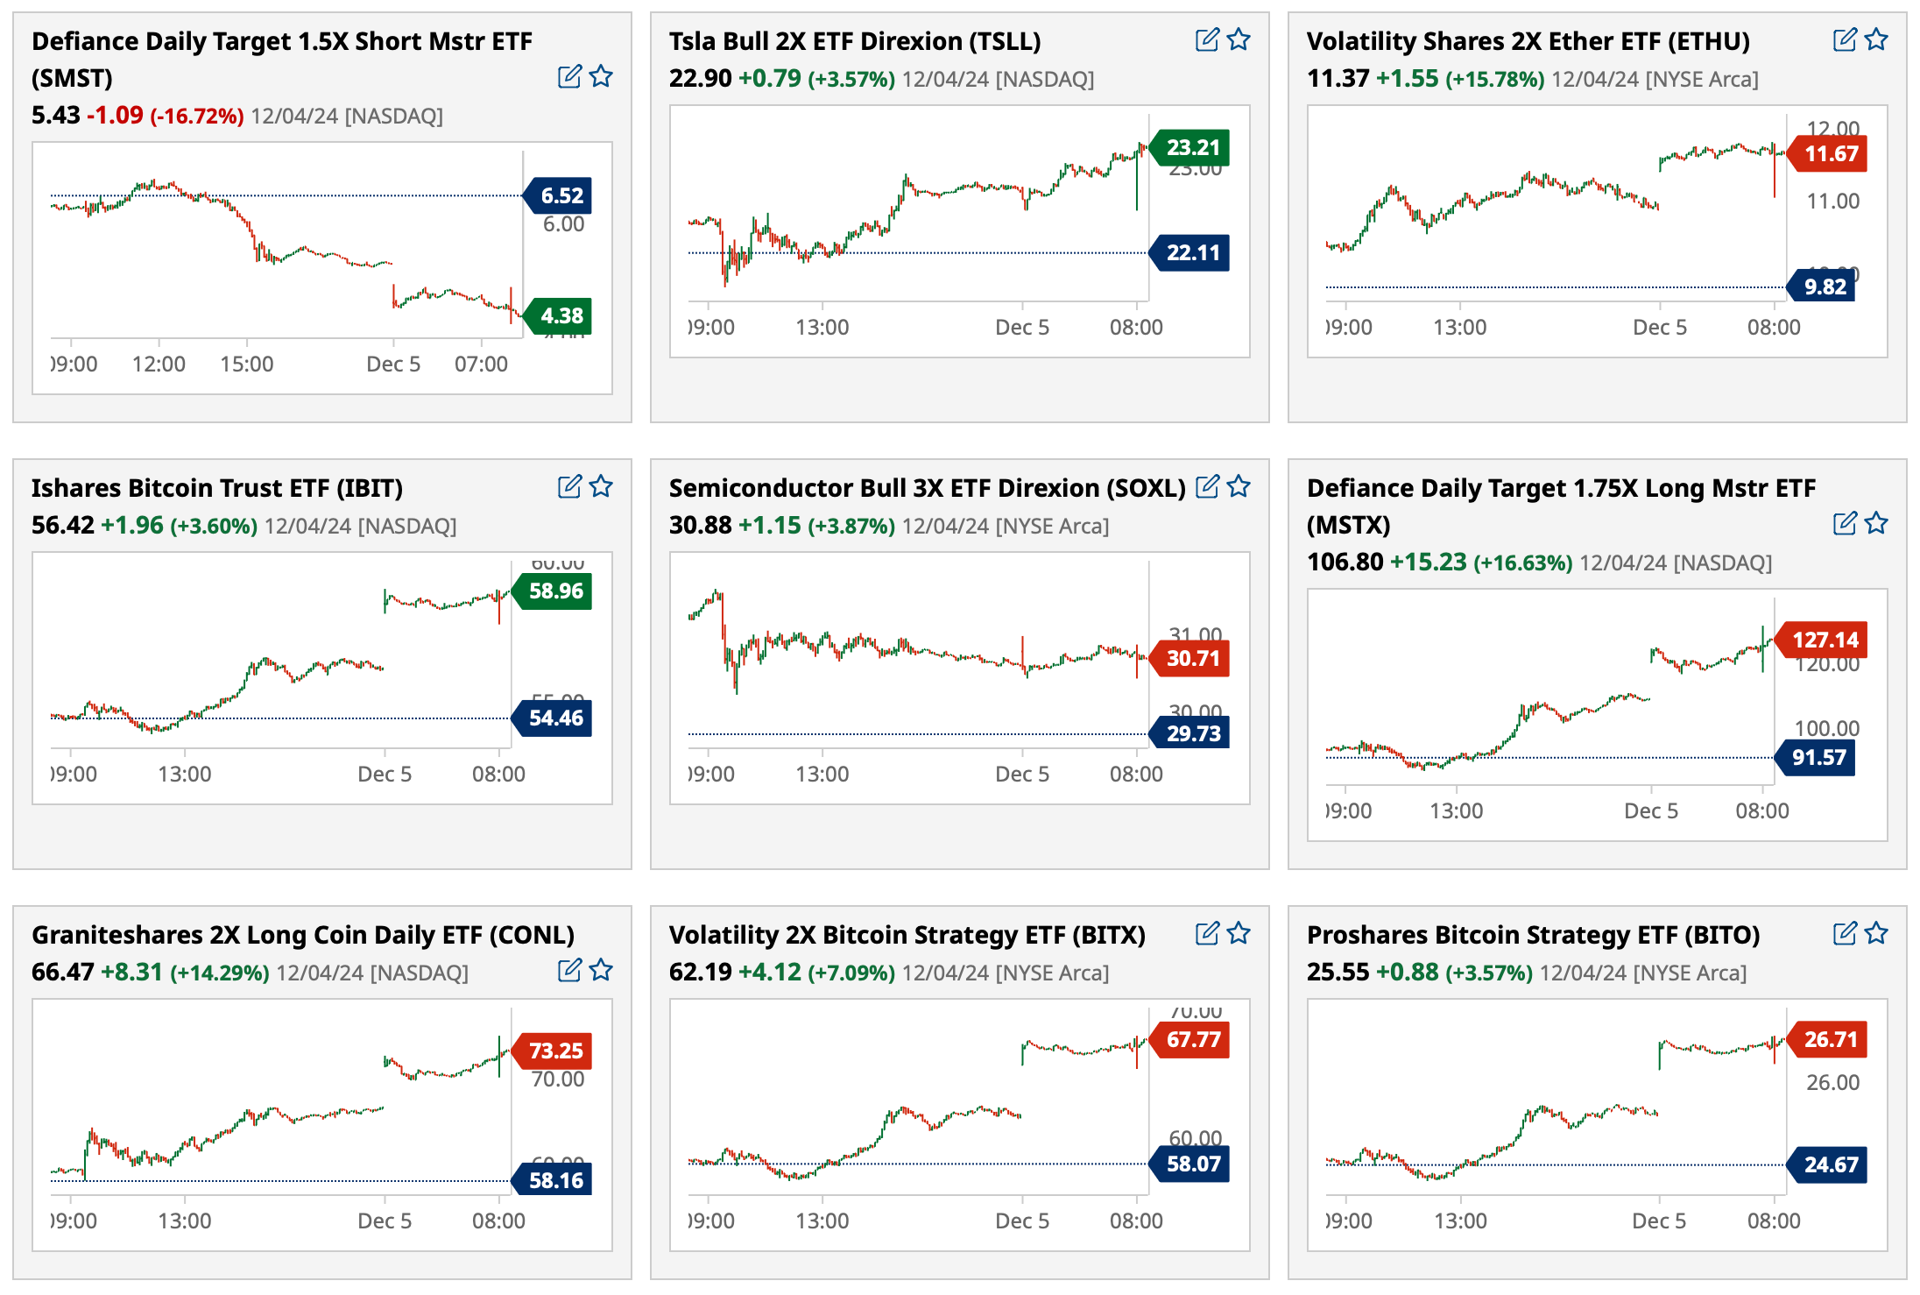
BY Doug Kass · Dec 5, 2024, 9:05 AM EST
Chart from 8:36 a.m. ET:
BY Doug Kass · Dec 5, 2024, 8:53 AM EST
BY Doug Kass · Dec 5, 2024, 8:25 AM EST
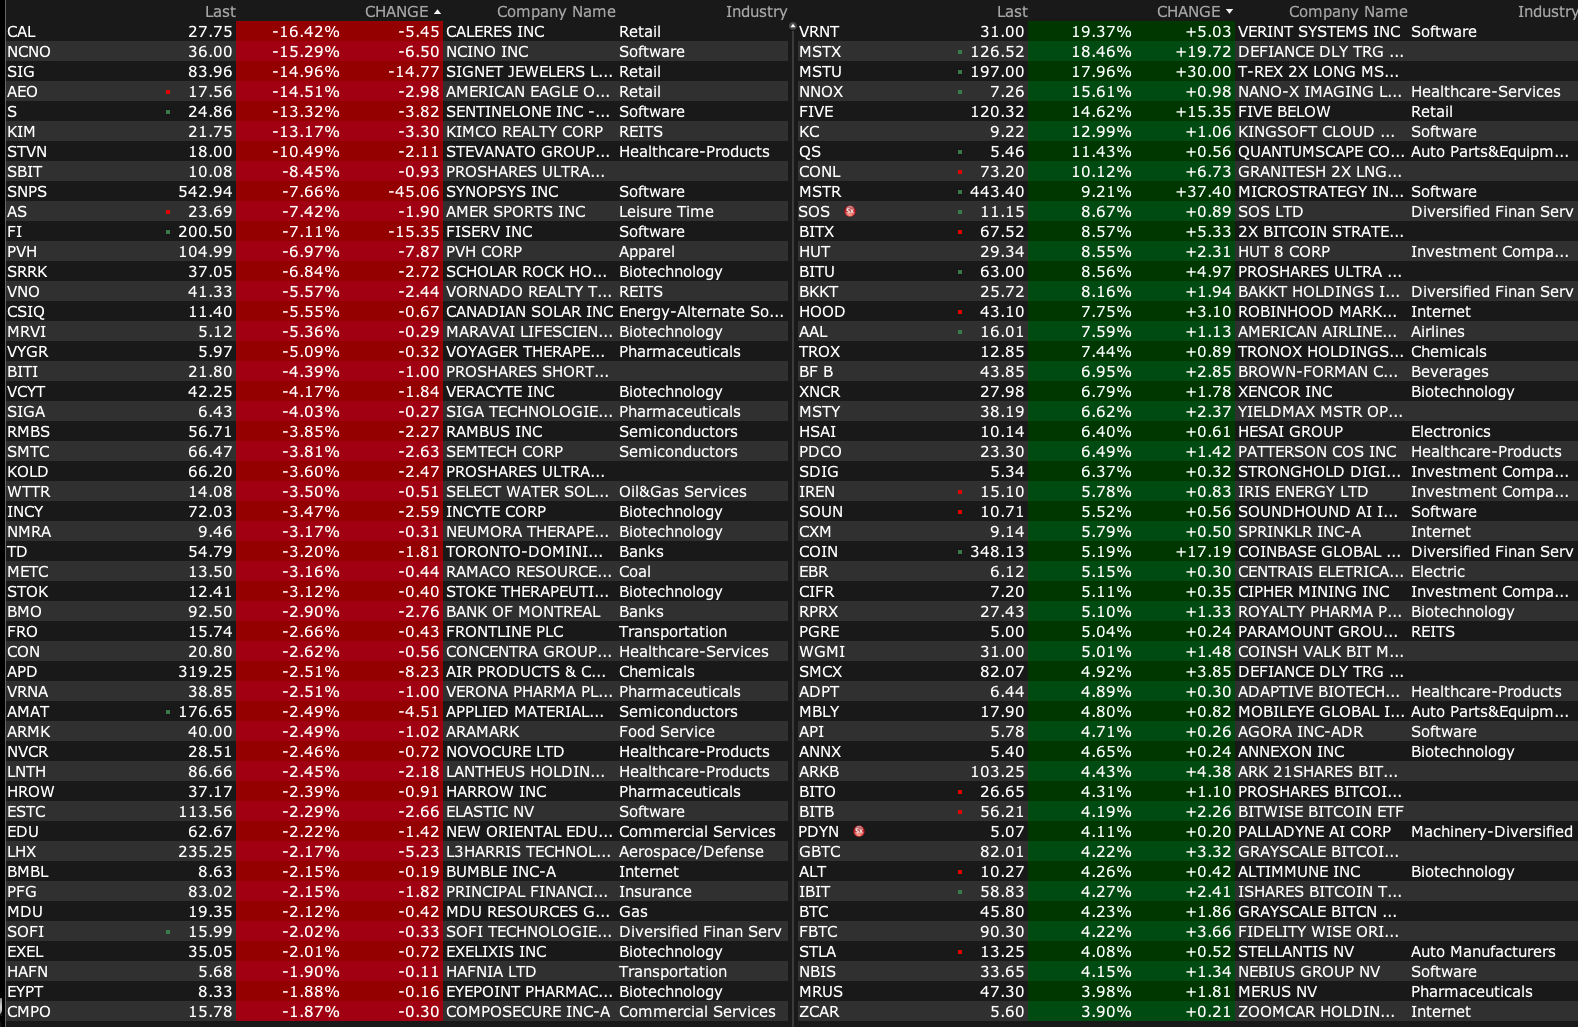
BY Doug Kass · Dec 5, 2024, 7:25 AM EST
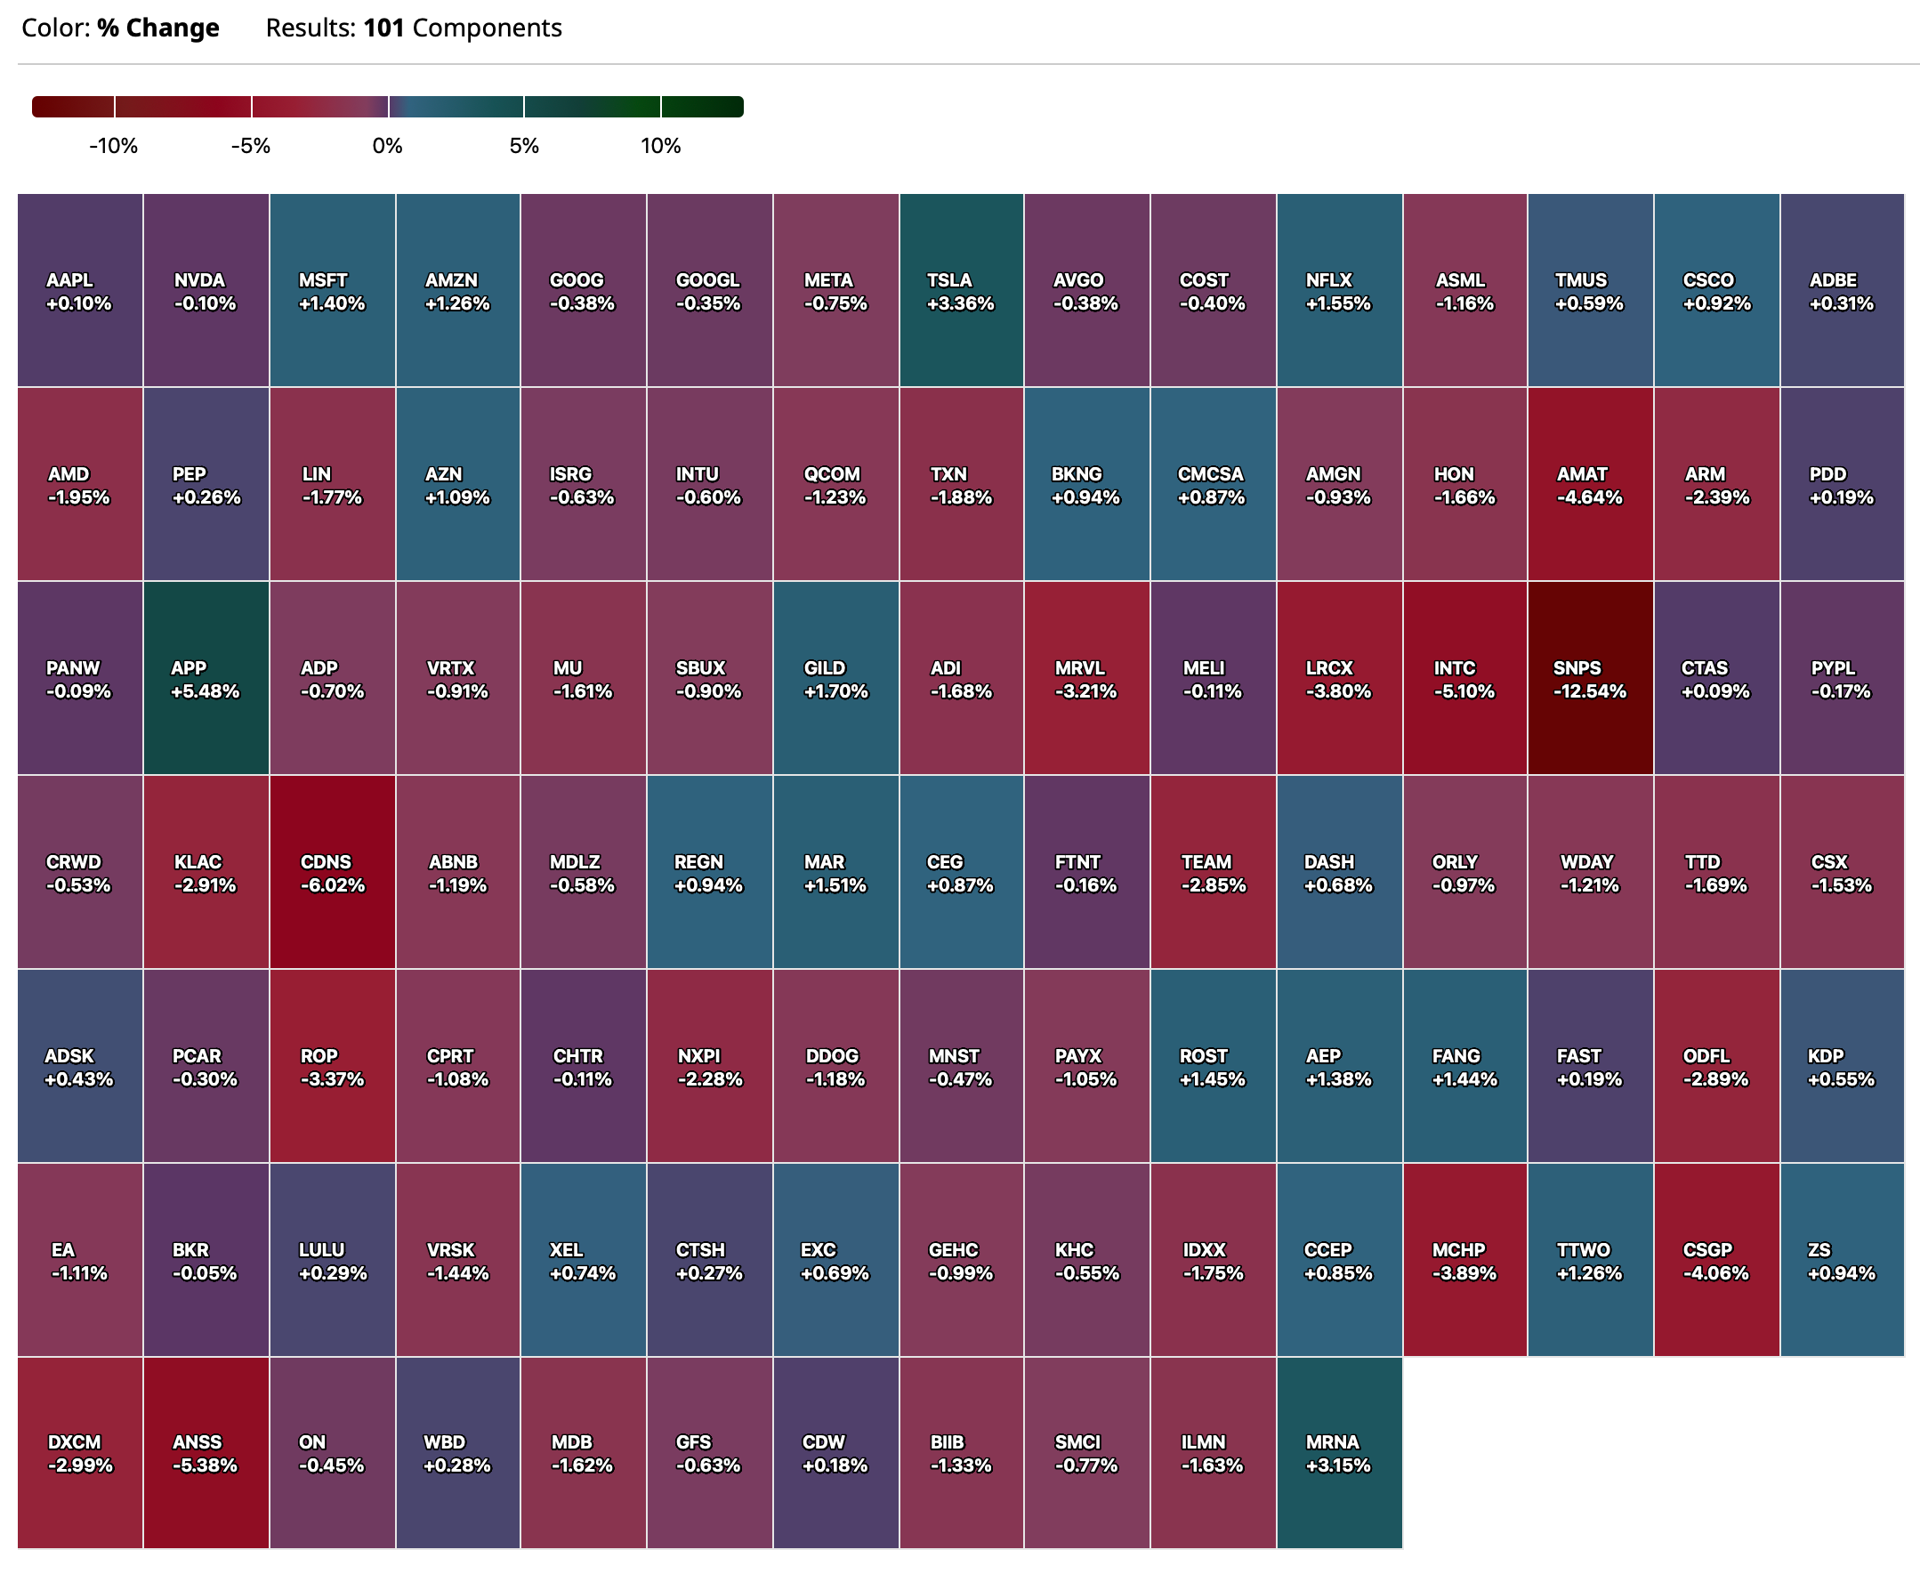
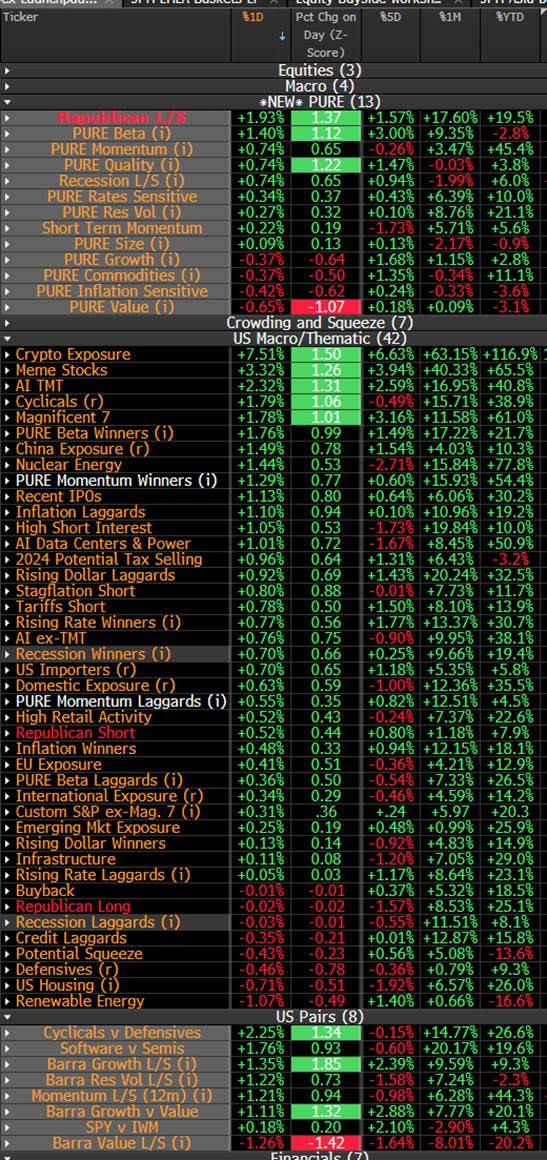
This is a valuable table for momentum-based short-term traders:
BY Doug Kass · Dec 5, 2024, 7:11 AM EST
From JPMorgan:
US: Futs are off a touch on what appears to be a quiet day ahead of NFP; bond yields are 1-2bps higher. Pre-mkt, Mag7 names are lower with Semis underperforming the group. Financials indicated higher. Cmdtys mixed while USD extends losses for a third consecutive day. It is a relatively light macro data day with jobless claims, which is not thought to be catalytic given tmrw’s NFP print.
and..
EQUITY AND MACRO NARRATIVE: Today, we will receive the initial jobless claims. Feroli expects initial jobless claims to print 215k vs. 213k prior, in line with the Street, with continuing claims increasing to 1907k vs. 1907k prior, higher than the Street’s estimates. We have seen the downward trend in initial jobless claims continue, while continuing claims remaining at the highest since November 2021. Feroli and team think it may suggest that layoff have remained low, while a persistent weakness in hiring is causing employed workers to take longer to secure new jobs. This is in line with some anecdotal evidence from ISM reports where companies were reporting slowing hiring plan ahead of election or politics uncertainties. Overall, given the emphasis on Friday’s NFP report, reactions to tomorrow’s macro data could largely muted.
BY Doug Kass · Dec 5, 2024, 6:40 AM EST
BY Doug Kass · Dec 5, 2024, 6:25 AM EST
From my friends at Miller Tabak:
Wednesday, December 4, 2024
As we look ahead to 2025, our outlook has shifted from highly optimistic to mixed. In the near-term, through at least late 2025, we expect the U.S. economy to perform well. Beginning in late 2025, however, we see much more downside risk. As a result, we are upgrading the risk of recession beginning within the next year from 10% to 15%, although this mostly reflects that this window now extends through late 2025.
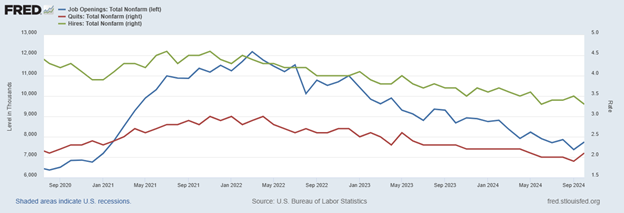
Three factors have allowed the U.S. economy to exceed all expectations, including ours (which were among the most optimistic), since 2022. First, the U.S. job market has had excess job openings which has allowed higher rates to cool the labor market by reducing job vacancies without a major rise in unemployment. Figure 1 shows the latest update from the October JOLTS data. Since early 2022, openings (blue), quits (red) and hires (green) have trended downwards in response to high interest rates. The October data show unexpected rises in openings (7.4 million to 7.7 million) and quits (1.9% to 2.1%). Like all movements since 2022, however, these are very likely just noise around the trend rather than signs of a lasting change. The hire rate, in contrast, fell from 3.5% to 3.3%. This is partly because, as openings have fallen, available workers are less of a match for available jobs.
Figure 1: Job Openings (blue), Quits (red) and Hires (green)
The second factor has been household balance sheets, including historically low delinquencies and debt to disposable income ratios. These, however, continue to normalize. Delinquencies in 3Q2024 rose to 1.51% (highest since 4Q2020) with commercial real estate (1.52%) delinquencies at their highest since 2014. The third factor was very high productivity growth in 2023 which fortuitously arrived just as the Fed raised rates well above neutral. This week, Fed Governor Adriana Kugler gave the best description yet from a FOMC member of productivity growth’s role, while also noting that upcoming immigration and trade policies may damage productivity over the next few years.
The good news is that while no longer exceptional, the labor market, household balance sheets, and productivity are still in solid shape. This is the basis for our forecast that growth will remain solid in the near term, and possibly for much longer if the economy avoids any significant hits to demand. The bad news is that the safety blanket that insulated the U.S. economy for the past two years is nearly gone. The economy is now much more vulnerable to either the Fed keeping rates too high for too long or a potential fiscal contraction.
BY Doug Kass · Dec 5, 2024, 6:15 AM EST
The U.S. deficit is 6% of its GDP, the same as France.
However, the stock markets of the U.S. and France are moving opposite directions.
French Government Falls After National Assembly Approves No-Confidence Vote
BY Doug Kass · Dec 5, 2024, 6:05 AM EST
BY Doug Kass · Dec 5, 2024, 5:55 AM EST
The overbought edged up overnight with the S&P Short Range Oscillator rising from 4.93% to 4.98%.
BY Doug Kass · Dec 5, 2024, 5:45 AM EST