I am taking in a portion of my shorts in the following positions - FMC (-$1.50), NKE (-$0.60), SBUX (-$1.25), WGO (-$3), RILY ($1.50), XPOF (-$1.05) and AAPL (-$4.18).
My old pal Abie responded to my opener on Market Structure just now:
Dougie,
I believe, as you do, that ODTE options have added massive risk to markets and that Tom Lee can only hold his opinion if he learned nothing from 1987 or simply does not understand the mechanics of how risk happens in mechanical strategy situations.
Specifically, I have found that almost no one really understands how the 1987 crash low grew to such massive proportions in just 2 days (Friday and Monday) of that period. I was very much involved in that event and offer the insight so lacking in Tom Lee's view.
Specifically, there were two independent risk accelerating factors at work then and continue to exist in EVERY market dominated by mechanical algorithms and leveraged instruments like options and futures.
The first is that mechanical algorithms are both easily decoded and largely transparent to market makers. And all you need is one or two major algo players getting a little too far over their skis to create a situation where "market makers" of all stripes are incentivized to add flow on top of algo flow attempting to correct a situation where risk is getting too large or positions leaning too far off the algos idea of neutral and trying to compensate to accelerate a price trend very rapidly and uncontrollably.
I note here that so called market breakers only worsen the matter because as they are approached all players on the wrong side of the trend are pushed into action further accelerating the trend to avoid getting left with positions in a market closed or frozen and facing a big gap reopening against them with little liquidity.
That is exactly what happened in 1987 as the portfolio insurers need to trade grew rapidly in size as the market moved so as to require them to be active in greater size in the leveraged futures markets with its very limited supply of market making liquidity which not only disappeared on the side the portfolio insurance folks wanted to trade but in fact, was pushed down further by market makers piling on even as they pulled their normal liquidity from the market - result, prices waterfalling.
The second major risk is that virtually ALL algorithms must be based in practice on certain expectations of liquidity in the instruments and markets they trade in to control order size and flow. Unfortunately, few things can change more rapidly and in greater size than liquidity at a given price ONCE MARKET MAKERS ASCERTAIN A DISTRESSED AND TRAPPED PLAYER MUST TRADE. Again, another BIG part of the acceleration price crash in 1987.
With ODTE options, I suspect the public and many self-professed gurus like Tom Lee either simply do not understand the nature of volatility vs time where volatility is a function of time-squared not linearly and the massive percentage changes involved in ODTE options volatility as they move from 6 1/2 hours to expiration to 3 hours to 1 hour to 30 minutes. The hedging and trading mechanisms required to control risk in those cases quickly moves from controlled response to GET ME OUT MORTIMER in heart beat-much faster than anything that happened in 1987.
The worst part of ODTD options is that there is not even a "pretend" useful purpose to their existence. At least the portfolio insurance guys believed they had found a way to protect their client - misguided and ignorant of real market dynamics as they were. I am not much in the equity markets any more - what need does an octogenarian have for such things? - but now, on Fridays, i enter my "insane" below market bids on a few items because I will get paid triple digit returns in a day or two on some of those someday on the crash rebound (paid for by the FED of course).
In my opinion, ODTE options should be banned. PERIOD end of story. They have, literally, NO redeeming value and could easily cause great harm to innocents.
As you all know, I occasionally make really stupid market forecasts - usually looking for an intraday reversal from a deep oversold or deep overbought.
Today my Ludacris Surprise/Forecast is a political one!
In the next few weeks Senator Dianne Feinstein will resign from Senate.
Vice President Harris "resigns" and is appointed to Feinstein's Senate seat.
California Governor Gavin Newsom is named Vice President.
Adam Schiff is appointed Governor of California.
A Biden/Newsom ticket is predicated on President Biden's tacit agreement to resign within the next two years for "health reasons."
Dougie, you thinking about starting to get a bit more aggressive around where should be support SPY 425-26 or just let this play out? Looks terrible to me. Likely opportunity coming for short term long rental. I'm waiting for now. News flow is awful as well. The bounce when or IF it comes is going to be shape and likely short lived. As always, timing in my game. Need the woosh.
1. The yield on the one year Treasury is now 5.47%. A 6% yield did the trick in October, 1987.
2. Net 52 week lows. Now at 270. 400 usually does it. 3. Action in Estee Lauder EL . Why? High quality company in non cyclical business. Valuation got stretched based on my 50 years of looking at consumer equities. Just hit 52 week low. Heavily exposed to mainland China. 4. Action in Cintas CTAS . Uniform company. Great gauge of industrial America. Great cult like management. Stock down 5% after good quarter was reported.
Yield on the ten-year continues to flirt with the bothersome 4.50% level, but the stock markets own internals appear to be taking center stage.
The S&P has dipped below 4300 - something I was concerned about yesterday and the day before. That is the first dip below 4300 in weeks, maybe even a month or so.
We will watch to see if the selling pressure begins to feed upon itself. If they go back to focus on the ten-year, getting above 4.55%, will get the equity players attention.
From the standpoint of watching the market internals, traders will be attentive this afternoon to see if the S&P goes down and violates presumed support at the 4280 area. If so, we will look to see if that produces carry-on selling.
So, yields on the ten year means minor alarm bells go off at 4.55% and the internal technical go off on further weakness and any possible violation of 4280.
From Peter: Data rundown on consumer confidence, housing and manufacturing.
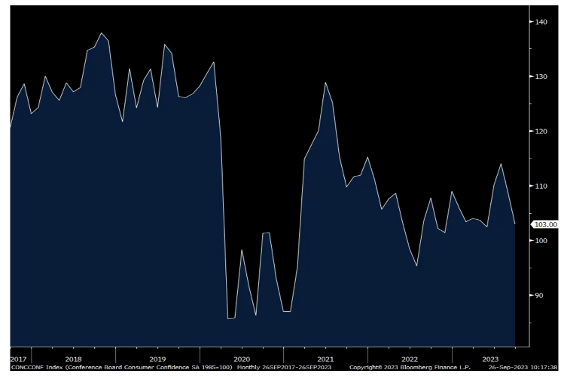
The September consumer confidence index from the Conference Board was 103, down from a revised 108.7 (initially 106.1) in August and 2.5 pts below expectations. That's the lowest since May. The components though were mixed as there was a slight increase in the Present Situation but more than offset by an almost 10 pt m/o/m drop in the Expectations component to the lowest since May. One yr inflation expectations held at 5.7% for a 3rd straight month.
The answers to the current labor market questions were mixed. After falling by 3.8 pts in August, those that said jobs were Plentiful rose 1 pt. But, those that said they were Hard to Get rose another .4 pts to 13.6, the highest since November 2022. Expectations from here for 'More Jobs' dropped 2 pts to a 3 month low and 'Fewer Jobs' was up at a 4 month high. Of note too, those that expect an Increase in income fell 2.4 pts to the lowest since March.
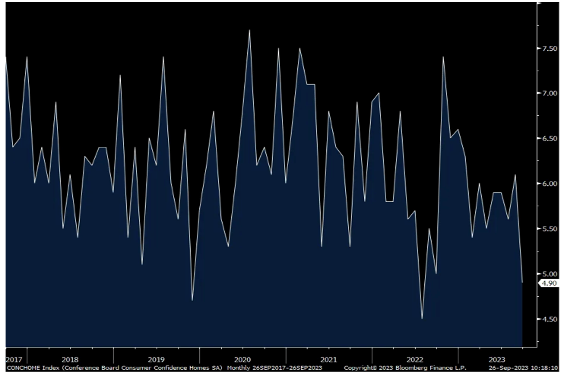
Spending intentions deteriorated with most likely much higher interest rates an increasingly negative influence on these big ticket items. Those that plan on buying a home fell to 4.9 from 6.1 and that is the lowest since July 2022. Those that plan on buying a vehicle within the coming 6 months fell 1.3 pts m/o/m to a 5 month low. After rising 3.4 pts in August, spending intentions on major appliances fell by 1.8 pts.
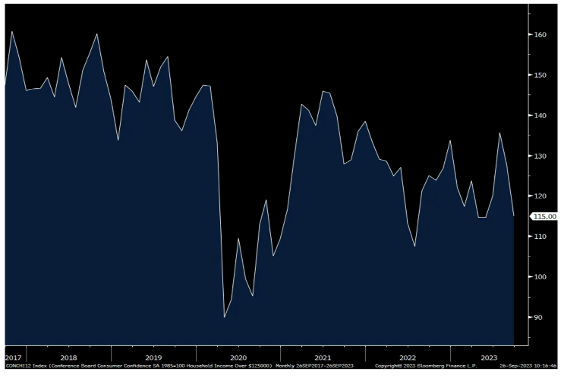
In terms of the age and income breakdowns, the drop in consumer confidence was pretty much broad based. I want to point out specifically that confidence among those that make more than $125,000 per yr is a hair from the lowest level since July 2022.
The Conference Board said "When asked about current family financial conditions, the share of respondents citing a 'good' situation fell again, and those citing 'bad' conditions rose, signaling rising concerns about current family finances."
The bottom line from the Conference Board was this, "Write-in responses showed that consumers continued to be preoccupied with rising prices in general, and for groceries and gasoline in particular. Consumers also expressed concerns about the political situation and higher interest rates. The decline in consumer confidence was evident across all age groups, and notably among consumer with household incomes of $50,000 or more."
I'll add, after going thru countless earnings calls/transcripts on retail/restaurant earnings calls over the past month plus, the consumer seems on unstable ground where prioritizing spend is their main priority.
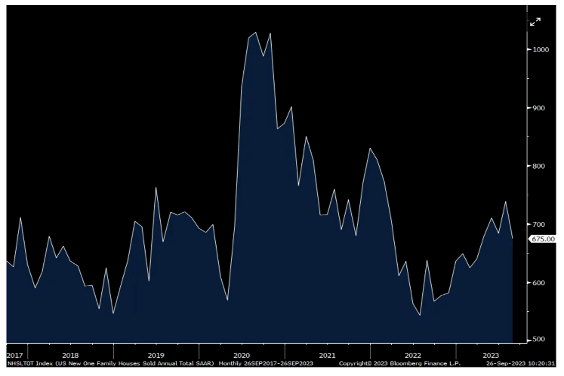
New home sales in August totaled 675k, 23k less than expected but July was revised up by 25k to 739k so call it a push. That's the least amount since March. As homes for sale rose, the months' supply increased to 7.8 from 7.0. After jumping in July, the median home price fell 1.4% sequentially and down by 2.3% y/o/y.
Bottom line, we now have an intensifying tug of war between the need for new homes to fill the supply vacuum but the price affordability problem is only growing, however tempered by builder incentives. It is in large part those builder incentives that are keeping their sales afloat. Smoothing out this volatile data point has the 3 month home sales figure at 699k vs the 6 month average of 688k and the 12 month average of 647k. By the way, the average 30 yr mortgage rate according to Bankrate jumped 11 bps yesterday alone to 7.75%.
Reflecting the pricing situation of existing homes, though dated data, S&P CoreLogic's July home price index rose by .65% m/o/m, up for a 6th straight month and higher by 1% y/o/y. Keep in mind that during this 6 month streak, the average 30 yr mortgage rate has risen by almost 100 bps thru July.
Some of the over heated markets over the past few years are the ones now taking it on the chin, Las Vegas and Phoenix but San Francisco and Seattle saw notable price declines too y/o/y. Price gains were led by Chicago, Cleveland and NY.
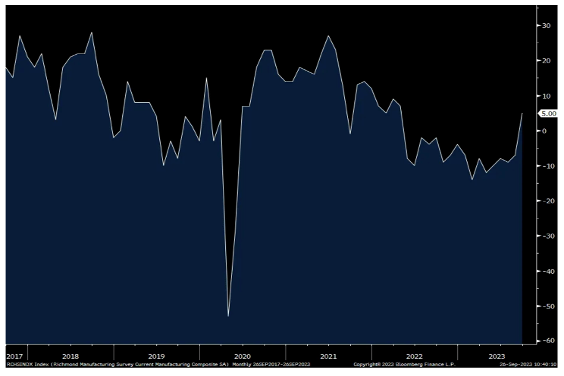
Finally, the Richmond Fed's manufacturing index for September got back above zero at +5 from -7. The estimate was for no change and that's the first time since April 2022 that this index has a plus sign in front of it. The internals were all over the place and the bottom line for manufacturing generally, both in the US and globally, is at what point does the destocking stop and some restocking begins. There are some signs that the former is taking shape but none at all yet on the latter.
Stocks went through Monday's trading session as though traders were getting direct minute by minute instructions from good ole Casey Stengel, perhaps, however, in pig Latin with a simultaneous translation by maybe Yogi Berra. Confusion was the watchword of the day from the morning on through the closing bell. It began with a weary look over their shoulder at the yield on the ten-year, as has been the case since I started droning about that two months ago and it continued with a strong pronounced effort. We even had to deal with it in this late morning update:
Late Morning Update 09.25.23 - Yield on the ten-year punched up to about 4.54%, which was enough to spook some of us cocktail napkin (amateur) chart types that a breakout above 4.50% might be imminent. Professionals, however, like Katie Stockton say the potential breakout is unconfirmed and we will need some Friday closes above key levels to confirm it. At any rate, after hitting that minor peak, they pulled back a few basis points and stocks came off the morning lows and now are trying to trade sideways.
Some technical pros in the FoF are calling for a short-term bottom low in the first few trading days of October and then a minor debate as to whether that leads to a minor spike then a sharp reversal or what it leads to. We will try to get more detail from them and try to explore who said what about where. You will recall that another group had seen a possible selloff starting on September 15th based on a lunar cycle and that certainly looks good, as does the sell on Rosh Hashanah rule of thumb.
For now, the bulls are trying to circle the wagons. Keep your eye on the S&P 4300 level, but most importantly, keep your eye on that yield on the ten-year. We will try to get more on the breakout details from pros like Katie Stockton and get more about the early October potential bounce from Friends of Fermentation. In the meantime, I think it is the ten-year yield that is driving the bus. As expected, trading remains light. Stay safe.
The movement on the yield on the ten-year remained the fascinated puzzle throughout the day, arising to tempting and even problematic levels, but slowing at times and that gave mixed signal to the market, which continued on through midday and into early afternoon. We touched on that difference in this midafternoon recap:
09.25.23Mid-Afternoon Recap - Stock market trades a bit indecisively as equity traders try to decipher what the message is in the yields on the 10-year. Traders look at it from two perspectives. One is the absolute level of the yield and the other is the velocity of change in the yield, and that to some degree is what is contributing to the indecisiveness. They move slightly above the important 4.50% and then they paused without a significant pullback. So, the move above 4.50%, began to put some pressure on stocks and that was then mitigated by the fact the velocity changed as yields moved a bit more sideways.
Awaiting some resolution of the minor conflict between level and velocity, equity traders don't appear to know exactly what to do. So, some of it also may be a factor of religious holiday with volume being exceptionally light and a lot of traders not even turning their positions over to the machines. So, we will continue to watch if they can move up above that 4.55% level which should bring pressure on stocks or if they appear to slow velocity. For now, as the King of Siam would say "it is a puzzlement!" Keep following the yields and try to stay safe.
I think, finally perceiving that difference between velocity and specific level, was enough to help move things. The final 90-minutes of trading were borderline bizarre, particularly the first 60 of those 90-minutes, in which, we saw the things like the Dow sweeping to -100 points to up 60 points to back on the minus side and all without any discernible headline on the newsticker, but almost all in reaction to how that ten-year yield was moving about.
They, ultimately, calmed down slightly in the final 20-minutes of trading and the wild whipsaw slowed to a rather anxious Arthur Murray kind of boxed step and that seemed to get everybody slightly back in gear, but from what we could tell, that yield on the ten-year at 4.54%, which is about as high as it got, left a lot of questions marks and will certainly tell us a lot about where equity prices may or may not be trading. As is customary, at this point, in the morning, we need to take a look at what our cousins offshore were doing in reaction to all the confusion expressed by their American cousins.
Overnight, global equity markets are leaning toward the anxious side, clearly in Asia that was true. Tokyo closed down about 400 points in the Dow and Hong Kong was even weaker, down about 550 Dow points. Mainland China, however, was off about 180 points in the Dow. Hong Kong was probably affected by new rumors about the large property companies in China, including possible police visits to some of the offices. India, on the other hand, was down, but only fractionally so.
As we go to press, London was flat and Paris is down about 180 points in the Dow and Frankfurt is off about 200 to 220 points in the Dow, but again, volume is light, picking up after the religious holiday yesterday. They still look shy of normal if my tickertape is current. The economic calendar is somewhat moderate.
We get Case/Shiller Home Prices before the NYSE opening and we will also see FHFA Home Prices at about the same time. In midmorning, we get the Consumer Confidence New Home Sales and Richmond Fed Manufacturing Index. At 1:00 p.m., results of the two-year note auction and then some hints on the Money Supply in early afternoon and at least one Fed speaker around 1:30/2:00 p.m. NYT. The futures look shaky and the technicals are somewhat difficult to decipher. As we say, we had several members of the FoF with pretty good track records looking for at least short-term bottoms in the early trading days of October.
We will try to get a bit more specific on that. It is also important to discern what happens if there is a short term bottom. At least one estimate has it followed by a minor spike and then a secondary selloff but take that with a major grain of salt while we try to dig in a develop a bit more data. We will see how markets re-assemble themselves after a long period of self-reflection in the Jewish community. Otherwise, with all the geopolitical gossip about, you know the drill.
Stay close to the newsticker. Keep your seatbelt fastened. Stay nimble and alert and, once again, we will be homing in on the yield on the ten-year as we evaluate changes in velocity and changes in actual levels. For now, on the level basis, the 4.55% and above will draw many of the equity trader's attention. So, remain alert and please stay safe.
-FEMY +195% (receives U.S. FDA Clearance to Market FemaSeed, an Innovative Infertility Treatment Solution) -SLNO +166% (Study C602 of DCCR for Prader-Willi Syndrome Met Primary Endpoint with Highly Statistically Significant Difference in Change from Baseline in HQ-CT Total Score for DCCR Compared to Placebo) -IMVT +62% (Subcutaneously administered doses of IMVT-1402 produced dose-dependent reductions in IgG in initial data from Phase 1 clinical trial in healthy adults; Initial MAD study results for 300 mg cohort released ahead of schedule) -STSS +45% (signs Asset Purchase Agreement to acquire InjectEZ Specialty Copolymer Syringe Manufacturing Facility and a 10-year purchase agreement for >$400M from Nephron Pharmaceuticals) -PRSO +20% (receives initial EOL purchase orders totaling $11.3M) -PLRX +17% (INTEGRIS-PSC, a Phase 2a clinical trial of bexotegrast in patients with primary sclerosing cholangitis (PSC) and suspected moderate to severe liver fibrosis met primary and secondary endpoints) -ROIV +16% (higher in sympathy with IMVT drug data; Jefferies Reiterates ROIV with Buy, price target: $14) -LSXMA +11% (Liberty Media Corp proposes combination with Sirius XM Holdings) -ABEO +5.5% (Submits BLA to US FDA Seeking Priority Review and Approval of EB-101 for Treatment of Patients with Recessive Dystrophic Epidermolysis Bullosa) -FSR +5.5% (plans to ramp up deliveries to 300 vehicles/day in US and Europe later this year) -AKBA +5.3% (receives approval of Vafseo (vadadustat) in Australia and provides commercial update) -SURG +4.8% (partners with ClearLine Mobile for customer-facing LCD tablets in convenience stores) -DKNG +3.3% (JPMorgan Chase and Co Raised DKNG to Overweight from Neutral, price target: $37 from $26) -ARCT +2.8% (Arcturus Therapeutics and Cystic Fibrosis Foundation extend agreement to advance ARCT-032, an Investigational Messenger RNA (mRNA) Therapeutic to treat Cystic Fibrosis) -MANU +2.0% (reportedly owners are still considering range of offers for the club) -SRFM +2.0% (Textron announces confirmed order for first 20 Cessna Grand Caravan EX Aircraft from Surf Air Mobility)
Downside
-RNAZ -69% (prices 15.7M shares at $0.51/shr for $8M offering) -UNFI -18% (earnings, guidance; enters cooperation agreement with JCP Investment Management, LLC and acceleration and expansion of customer and supplier focused multi-year Transformation Plan) -OMGA -10% (announces preliminary clinical data for OTX-2002 from ongoing MYCHELANGELO I Trial) -IMMX -5.4% (files to offer 5.2M shares for selling holders) -SIRI -5.2% (Liberty Media Corp proposes combination with Sirius XM Holdings) -RGEN -4.0% (to acquire fluid management firm Metenova) -SNX -4.0% (earnings, guidance) -MDGL -3.9% (Chief Commercial Officer to depart) -BYRN -3.8% (reports prelim Q3 revenue) -COTY -3.4% (launches global offering of 33M shares of common stock; plans listing on the Professional Segment of Euronext Paris) -THO -3.1% (earnings, guidance) -ICPT -2.9% (Alfasigma to acquire ICPT for $19/share in cash)
Market Structure Represents an Under-Appreciated and Existential Risk to the S&P
* It feels like deja vu all over again as risks to market stability have increased
* Just as "portfolio insurance" was the catalyst to Black Monday (in October, 1987), the dominance of systematic products and strategies represent meaningful market risk today
* This (left tail) risk is being ignored by most...
"People have memories. Markets don't."
- Ken Fisher
Market Structure Distortions:Change is market structure, passive vs. active investing, and shocking developments in the options market - invisible to many market participants - raise real risks to stocks.
The dominance of passive strategies - manifested in the popularity of exchange traded funds and the dominance of quantitative investing that worship at the altar of price momentum - conjures up memories of October, 1987, when "portfolio insurance" (a new strategy of the era) directly resulted in a -20% market correction over a very brief period of time.
These strategies know everything about price and nothing about value. They are heavily tilted to the long side - popular risk parity strategy/products, in particular, are leveraged.
While I remain fundamentally-based in my investment decision making process, changes in market structure represent a growing market risk that many are ignoring.
Over the last decade, systematic players - vol control funds, risk parity, CTAs, etc. - have begun to dominate and, arguably, overwhelm our markets. This change in market structure holds risks to overall market stability.
Importantly, systematic players are rules based and not fundamentally based. They are run by emotion-less machines, who know everything about price but nothing about value. They are instructed to trade, not by humans, but by algos. And, not surprisingly, the strategies are highly leveraged.
Adding a cherry to the potentially toxic brew are ODTE (zero days to expiration) options have added even more systemic risks to the proliferation of systematic players. If someone told you ten years ago that in 2023 ODTE options (with 24 hour maturities!) would represent more than 60% of the options traded daily you would have been laughed out of the room. But this is the case.
ODTE options, depending on positioning, can significantly influence and exaggerate short term market moves. At the least ODTE options add to volatility. But, in the extreme, ODTE options hold the potential to have an almost catastrophic impact on our markets. Yesterday's late day action was instructive. Large SPY positioning in ODTE calls pushed the S&P Index up by over 20 handles in the last few minutes of trading. But, when ODTE options expired, S&P futures reversed back down the same amount that the rose towards the end of the day's trading - as the fundamental fears of rising Treasury yields took over.
Many of the same gamblers/speculators who chased cryptocurrencies, and lost much of their nest eggs, have now migrated into the ODTE options pits - with an economic outcome likely to be similar:
Emphasizing the importance of ODTE positioning (gamma), JPMorgan highlighted ODTE options color this morning:
OPTIONS COLOR
Zero-day to expiry (0DTE) options' volume share continues to grow and now represents ~50% of S&P 500 option turnover. However, 0DTE options appear to have developed their own, largely separate, user base, rather than cannibalizing flows from longer-dated S&P 500 options, as the rest of the S&P 500 options complex kept pace with the growth of broader US equity options markets at the same time as 0DTEs surged. However, in SPY, 0DTE options do appear to have absorbed some flows in other short-dated (<1M) options.
Dealers are short gamma, which lead to the first down >1.5% day since March 22; the implications of short gamma are larger moves, up or down. Further, the large collar (SPX) that is in the market place has a strike around 4,200 which could act as a magnet; also, the 200dma is ~4,200, too. Interestingly, our Equity Derivatives team is seeing limited demand for downside protection, at the index level. (Also, should consider the ~15bn of CTA selling after the SPX broke the 100DMA alongside all of this...).
The volatility into and after Monday's close could be child's play to what could happen, in theory.
Yesterday, none other than Fundstrat's Tom Lee has rejected my concern and of those that compare today to Black Monday in October, 1987, when equities fell by -21% in one day in which the Dow Jones Industrial Average fell by -22.6% - the largest one day percentage decline in history. It is generally recognized that another change in market structure, this time by "portfolio insurance."
Rather, Tom sees my concern, and the concern of some others, as provocative and not fact-based. He sees those that are concerned with market structure to "zealots who proclaim the end of the world to a date (remember 2012?)":
In my opener, I wrote several summary points. This was an important one:
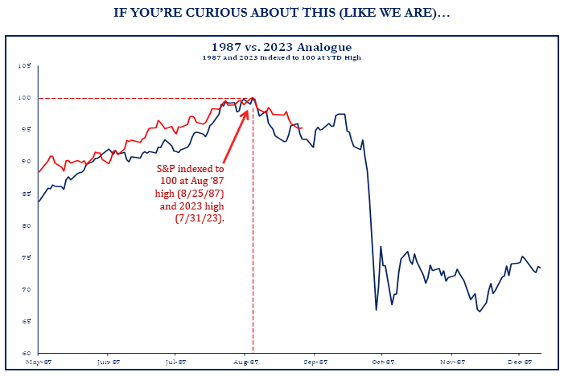
This is starting to feel like an October, 1987 set up - a period 36 years ago in which market structure changes "portfolio insurance" were dismissed, too.
Here are some charts that suggest that a repeat of 1987 is NOT out of the question - below is from late August:
The evolution of market structure changes from active investing to passive investing holds profound risk to market stability, just as it did 36 years ago.
Highly leveraged quant strategies that allocate capital based on an assessment of risk have become the tail that wags the market's dog. When that risk assessment moves into the extreme - in either direction - the chance of market instability (up OR down) rises dramatically and has the potential of contributing to much heightened market volatility and instability.
In 1987 portfolio insurance was considered to be a "gift" for those seeking to hedge risk. To understand what an "existential risk" is, think in terms of how ODTE options have, for now, tempered volatility. That feature can easily break if you understand the term gamma and market participants' gamma positioning.
As Grandma Koufax used to say, "Dougie, stay tuned."
Read the stuff on ODTE calls because it modifies my opener coming up.
From JPMorgan:
US: Futs are weaker amid a global risk-off tone, a trend that may continue throughout the week. Yields are flat, USD is flat, and cmdtys are coming for sale with both Energy/Metals selling off. Moody's warns a gov't shutdown would be credit-negative. There is a $48bn auction for 2Y bonds today; this likely requires some concession to be digested and is the first of several auctions this week that are larger than normal size. Today's macro data focus includes housing prices, new home sales, regional Fed activity surveys, and consumer confidence.
and...
EQUITY AND MACRO NARRATIVE: Yields took another step higher yesterday. This move in yields is occurring despite there not being a material change in rate hike or inflation expectations. Are we priming for a reversal lower once we get through this week? Ultimately, Powell's commentary should have been bullish for stocks as he denotes stronger than expected growth for longer than anticipated. Against this stronger growth backdrop, we are not seeing a material acceleration in inflation. While much ink has been spilled on oil prices (WT +7.3% MTD) gasoline and natgas have fallen 8.3% and 5.7%, respectively. The decline in gasoline and natgas may be more impactful to the consumer than the increase in crude. The potential government shutdown, student loan payment resumption, and UAW strike add more noise to an otherwise solid picture; to be clear, none of those 3 events is impactful on a ~$27T economy. Separately, September seasonality can be a mixed bag but the last two weeks tend to be negative and Q4 tends to be the strongest quarter of the year.
OPTIONS COLOR
· BRAM KAPLAN (full note is here): Zero-day to expiry (0DTE) options' volume share continues to grow and now represents ~50% of S&P 500 option turnover. However, 0DTE options appear to have developed their own, largely separate, user base, rather than cannibalizing flows from longer-dated S&P 500 options, as the rest of the S&P 500 options complex kept pace with the growth of broader US equity options markets at the same time as 0DTEs surged. However, in SPY, 0DTE options do appear to have absorbed some flows in other short-dated (<1M) options.
· JPM EQY DERIVS TRADING: Dealers are short gamma, which lead to the first down >1.5% day since March 22; the implications of short gamma are larger moves, up or down. Further, the large collar (SPX) that is in the market place has a strike around 4,200 which could act as a magnet; also, the 200dma is ~4,200, too. Interestingly, our Equity Derivatives team is seeing limited demand for downside protection, at the index level. (Also, should consider the ~15bn of CTA selling after the SPX broke the 100DMA alongside all of this...).
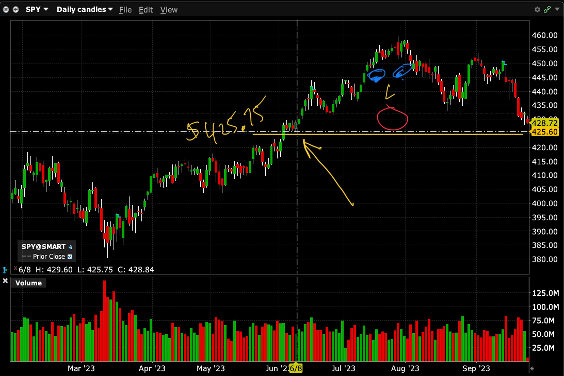
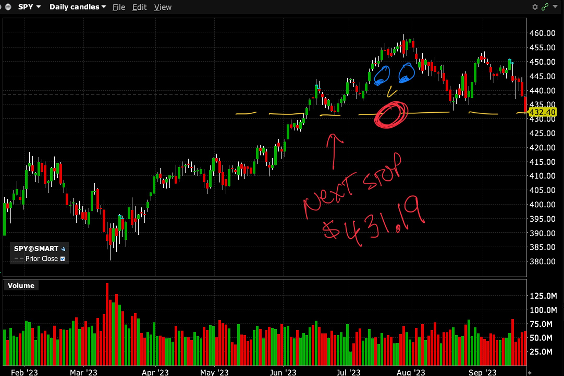
Today's Chart of the Day was shared by Nautilus Research (@NautilusCap). Over the past three months, the S&P 500 has formed a potential Head & Shoulders top. The neckline of this bearish pattern coincides with the August 2022 highs, around 4,300. We could argue about the nuances and validity of this pattern, but most would agree this pattern should be bearish. The thing is, we're all watching the same movie here. The S&P 500 is the most over-analyzed chart in the world, and many are seeing this bearish pattern. When patterns become too obvious, they tend to fail. And when patterns fail, you often get a sharp reaction in the opposite direction. In this case, that would mean a sharp reaction higher. Failed patterns can often be more powerful than successful patterns. As Nautilus points out, it wouldn't be the first time in recent history that we had a well-broadcast Head & Shoulders top resolve sharply higher. ------------------------ I prefer this chart (from Thursday in my Diary):
In case you missed it here on Real Money Pro yesterday, here is my pick for the rest of 2023:
Doug Kass: My Real Money Pal Just Picked Berkshire for Q4. I Disagree
Here's why I'm shorting the very stock that Stephen 'Sarge' Guilfoyle picked as his stock for the remainder of the year.
Let's have some fun (and respectful debate!) with the request by our managing editor to choose our favorite stock (long or short) over the last three months of the year.
My good pal, Stephen "Sarge" Guilfoyle, identified Berkshire Hathaway ( BRK.B) as his favorite long bet for the last quarter of the year. Readers can check out his strong analysis at Real Money: " My Stock Pick for the Rest of 2023? The Big 'B'." Sarge is attracted to the diversity of Warren Buffett's enterprise, the strong operating results and rock solid financials. He's also attracted to the company's significant exposure to energy (Berkshire Hathaway Energy and Occidental Petroleum ( OXY) investment), the sizeable position in Apple's ( AAPL) shares, the relatively good technicals (and stock chart) and Buffett's constructive view of equities, in general.
Sarge makes a good argument, but I'm going with the opposite plan: My pick is to short Berkshire. You read that correctly -- I'm shorting BRK.B.
Let me summarize my investment rationale. Unlike Sarge, I hold a negative view for equities. This is no secret: I've noted my feelings on equities over the last four months in my Diary. See " Investors Like Ostriches, Have Their Heads in the Sand" for more on my take.
Also, Berkshire's operating profile -- as you can see here -- is skewed toward the cyclical (Burlington Northern), energy (Berkshire Hathaway Energy Company), housing (Home Services, Johns Manville, Clayton Homes) and financials (Geico, General Re, National Indemnity). I am negative on cyclicals, energy (which I believe is overbought), housing and financials.
In addition, Berkshire's investment portfolio is heavily skewed toward Apple. The stock represents over half of its equity holdings, and is six-times larger than Bank of America ( BAC) , which is Berkshire's second-largest holding. Berkshire's 915 million Apple shares have a market value of approximately $189 billion, representing about 25% of Berkshire's market capitalization. I, for the record, am short AAPL shares.
What about the balance of the stocks in Berkshire's investment portfolio? They are skewed toward financials, with Bank of America ($29 billion) and American Express ( AMEX) ($26 billion) the second and third largest holdings. As noted in my Diary, I continue to view banks and financials unfavorably.
Berkshire's chart looks like it may be teetering -- as the price action over the last two trading days has been poor, absolutely and relatively.